. 2021 Nov 22:12:754185.
doi: 10.3389/fphar.2021.754185. eCollection 2021.

HR-MS Based Untargeted Lipidomics Reveals Characteristic Lipid Signatures of Wilson's Disease

Affiliations

HR-MS Based Untargeted Lipidomics Reveals Characteristic Lipid Signatures of Wilson's Disease

Yixiao Zhi et al. Front Pharmacol. .

Abstract

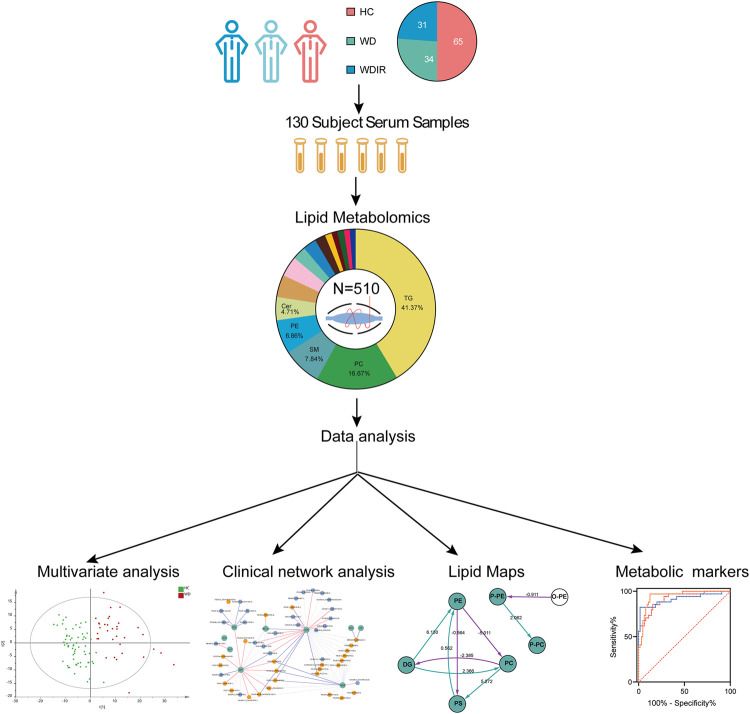
Background and Aims: The diagnosis of Wilson's disease (WD) is challenging by clinical or genetic criteria. A typical early pathological change of WD is the increased liver lipid deposition and lowered serum triglyceride (TG). Therefore, the contents of serum lipids may provide evidence for screening of biomarkers for WD. Methods: 34 WD patients, 31 WD relatives, and 65 normal controls were enrolled in this study. Serum lipidomics data was acquired by an ultra-high-performance liquid chromatography high-resolution mass spectrometry system, and the data were analyzed by multivariate statistical methods. Results: Of all 510 identified lipids, there are 297 differential lipids between the WD and controls, 378 differential lipids between the relatives and controls, and 119 differential lipids between the patients and relatives. In WD, the abundances of most saturated TG were increased, whereas other unsaturated lipids decreased, including phosphatidylcholine (PC), sphingomyelin (SM), lysophosphatidylcholine (LPC), ceramide (Cer), and phosphatidylserine (PS). We also found many serum lipid species may be used as biomarkers for WD. The areas under the receiver operating characteristic curve (AUC) of PS (35:0), PS (38:5), and PS (34:0) were 0.919, 0.843, and 0.907. The AUCs of TG (38:0) and CerG1 (d42:2) were 0.948 and 0.915 and the AUCs of LPC (17:0) and LPC (15:0) were 0.980 and 0.960, respectively. The lipid biomarker panel exhibits good diagnostic performance for WD. The correlation networks were built among the different groups and the potential mechanisms of differential lipids were discussed. Interestingly, similar lipid profile of WD is also found in their relatives, which indicated the changes may also related to the mutation of the ATP7B gene. Conclusions: Lipid deregulation is another important hallmark of WD besides the deposition of copper. Our lipidomic results provide new insights into the diagnostic and therapeutic targets of WD.

Keywords: Wilson disease; biomarkers; lipidomics; metabolomic; triglyceride.


Conflict of interest statement

Author ZW is employed by iPhnome (Yun Pu Kang) biotechnology Inc. Dalian. The remaining authors declare that the research was conducted in the absence of any commercial or financial relationships that could be construed as a potential conflict of interest.

Figures

FIGURE 1
FIGURE 1
Workflow of WD serum analysis. This figure depicts the design and steps of this study, beginning with sample collection for the three cohorts, followed by untargeted lipidomic analysis, and then the various data analyses employed, including PCA, OPLS-DA, univariate T-test and ANOVA.
FIGURE 2
FIGURE 2
Overview of differential lipid profiles in three groups. (A) Principal component analysis (PCA) was used to test the samples of the WD, WDIR and HC (R2X = 0.893, Q2 = 0.772). (B) Partial least squares discriminant analysis (PLS-DA) was used to cluster the samples of the three groups (R2X = 0.524, R2X = 0.676, Q2 = 0.506). (C) A volcano plot showing the dysregulated features between WD and HC (Student’s t-test, FDR<0.05). (D) A volcano plot for the different lipids of WDIR and HC. (E) A volcano plot for the WD and WDIR. (F) Venn diagram displaying the number of differentially abundant metabolites that overlapped in the WD versus HC comparison (WD vs HC), WD versus WDIR comparison (WD vs WDIR), and WDIR versus HC comparison (WDIR vs HC).
FIGURE 3
FIGURE 3
Metabolomic profiles differ between WD and HC. (A) Heat map of the 36 differential lipids between WD and HC. (B) Correlation network of differential metabolites and clinical indicators in WD and HC. The connections between two nodes were established by Pearson correlation (Student’s t-test, FDR <0.05). CP = ceruloplasmin; SCL = serum copper level; 24-h UCL = 24-h urinal copper level; ALT = alanine transaminase; AST = aspartate transaminase; GGT = γ-glutamyltransferase; ALP = alkaline phosphatase; AchE = acetylcholine esterase; ALB = albumin. (C) Lipid subclass correlation network of differentially abundant metabolites in WD and HC. (D) Lipid molecular species correlation network of differentially abundant metabolites in WD and HC.
FIGURE 4
FIGURE 4
Metabolomic profiles differ between WDIR vs HC and WD vs WDIR. (A) Heat map of the 37 differential metabolites between WDIR and HC. (B) Relative concentration of differential metabolites screened by LASSO in WDIR and HC. (C) Heat map of the 6 differential metabolites between WD and WDIR. (D) Relative concentration of differential metabolites in WD and WDIR.
FIGURE 5
FIGURE 5
Fitting prediction of WD biomarkers. (A–G) Relative concentration of significantly differentially abundant metabolites screened by LASSO in WD and HC. (H–I) Relative unsaturated TG concentration of significantly differentially abundant metabolites in WD and HC. (J–K) ROC curve analysis of increased metabolites in WD and HC. (L) ROC curve analysis of the biomarker panel in WD and HC.

References

    1. Ala A., Walker A. P., Ashkan K., Dooley J. S., Schilsky M. L. (2007). Wilson's Disease. Lancet 369, 397–408. 10.1016/S0140-6736(07)60196-2 - DOI - PubMed
    1. Allard J. P., Aghdassi E., Mohammed S., Raman M., Avand G., Arendt B. M., et al. (2008). Nutritional Assessment and Hepatic Fatty Acid Composition in Non-Alcoholic Fatty Liver Disease (NAFLD): a Cross-Sectional Study. J. Hepatol. 48, 300–307. 10.1016/j.jhep.2007.09.009 - DOI - PubMed
    1. Bandmann O., Weiss K. H., Kaler S. G. (2015). Wilson's Disease and Other Neurological Copper Disorders. Lancet Neurol. 14, 103–113. 10.1016/S1474-4422(14)70190-5 - DOI - PMC - PubMed
    1. Barber R. G., Grenier Z. A., Burkhead J. L. (2021). Copper Toxicity Is Not Just Oxidative Damage: Zinc Systems and Insight from Wilson Disease. Biomedicines 9, 316. 10.3390/biomedicines9030316 - DOI - PMC - PubMed
    1. Blanksby S. J., Mitchell T. W. (2010). Advances in Mass Spectrometry for Lipidomics. Annu. Rev. Anal. Chem. Palo Alto Calif. 3, 433–465. 10.1146/annurev.anchem.111808.073705 - DOI - PubMed