. 2021 Nov 22:12:757293.
doi: 10.3389/fphys.2021.757293. eCollection 2021.

Physiologically Based Modeling of the Effect of Physiological and Anthropometric Variability on Indocyanine Green Based Liver Function Tests

Affiliations

Physiologically Based Modeling of the Effect of Physiological and Anthropometric Variability on Indocyanine Green Based Liver Function Tests

Adrian Köller et al. Front Physiol. .

Abstract

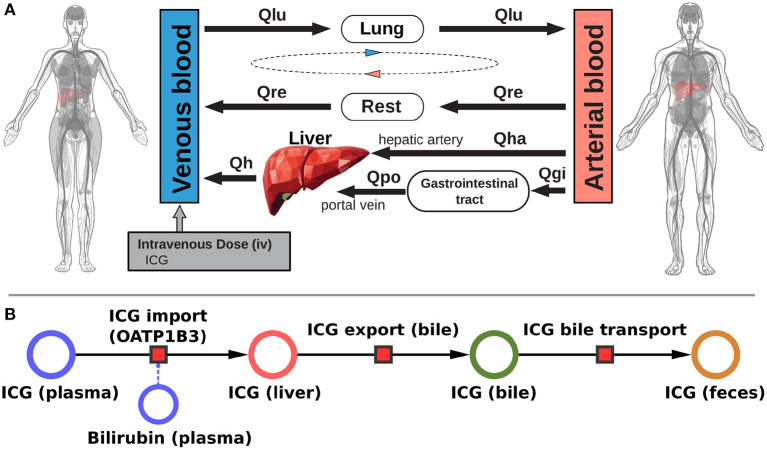
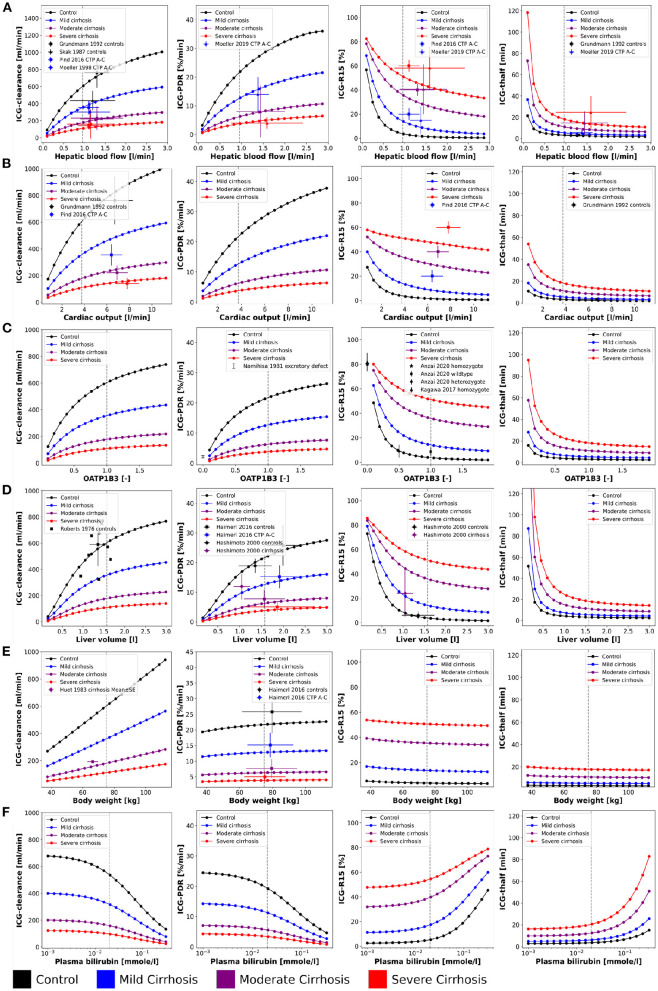
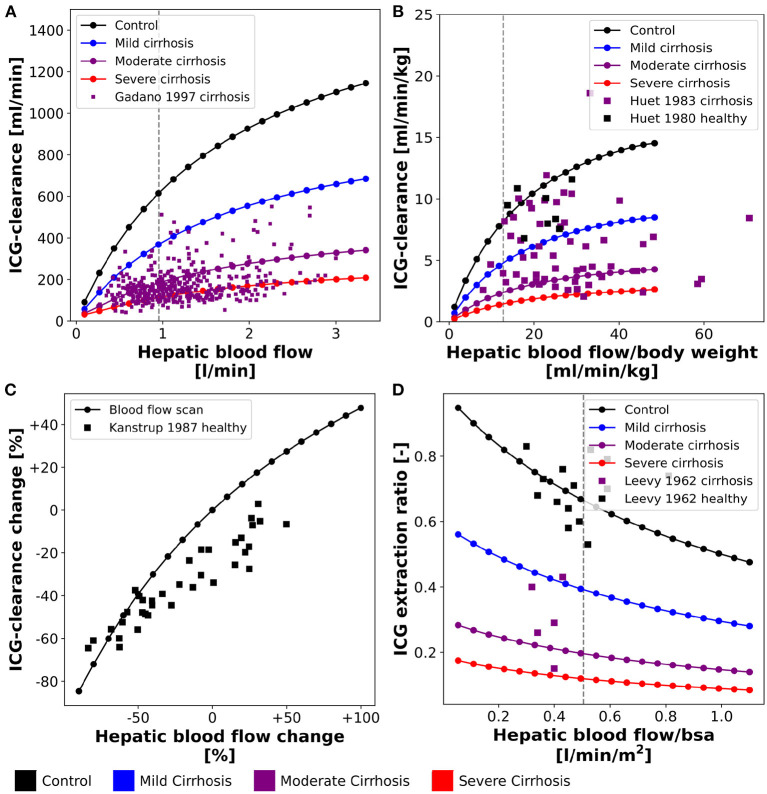
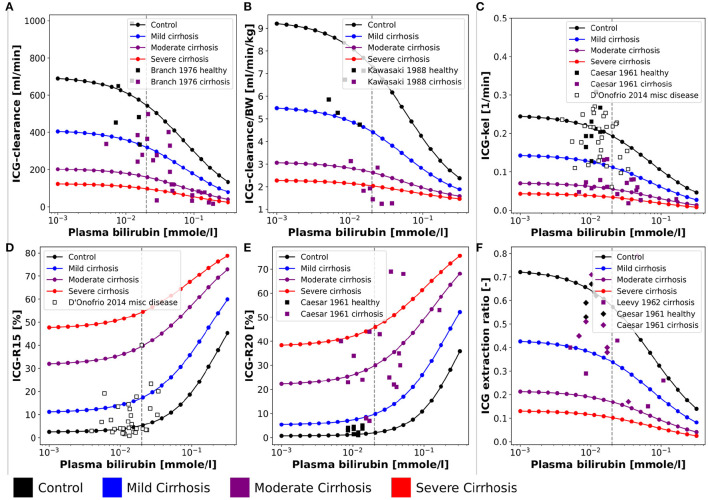
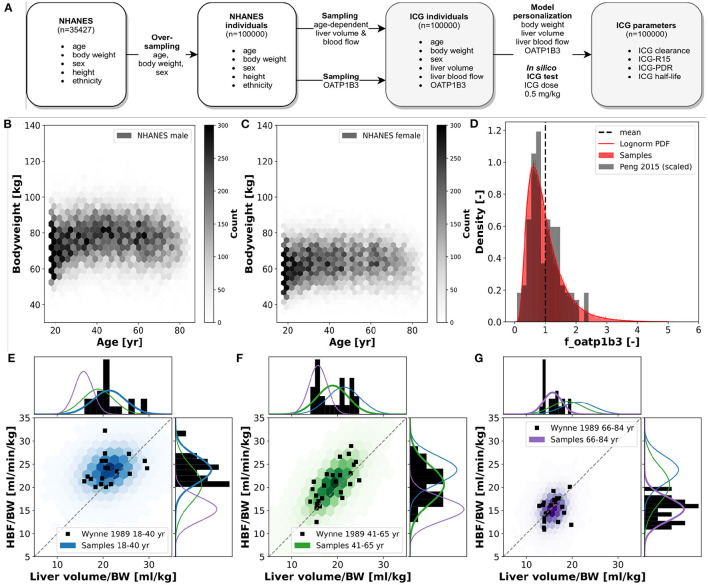
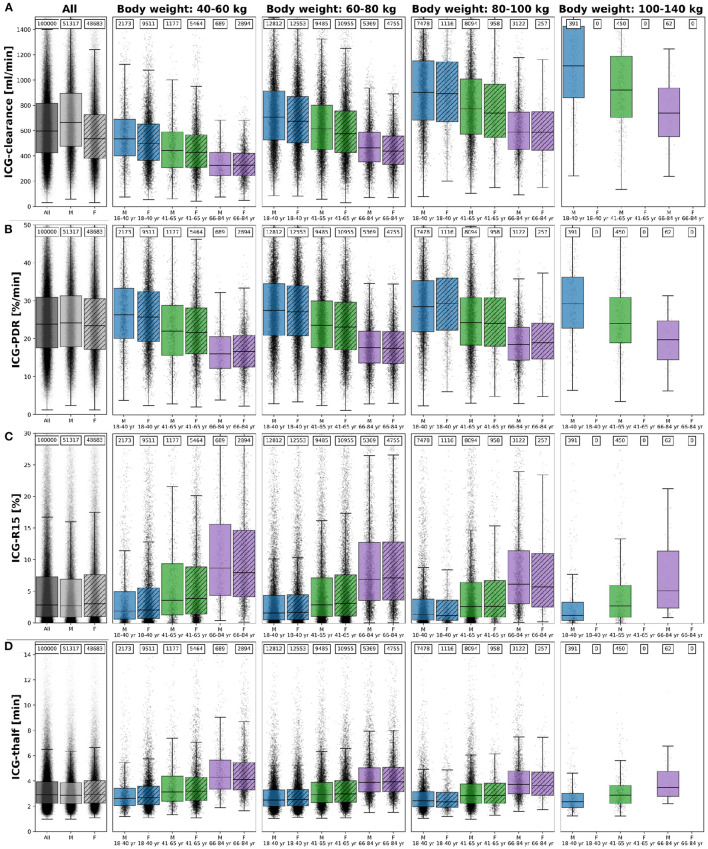
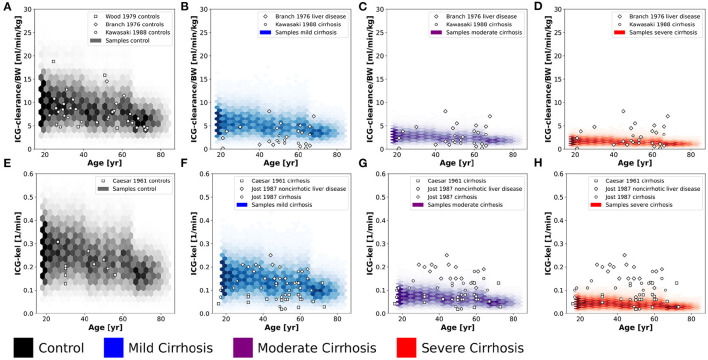
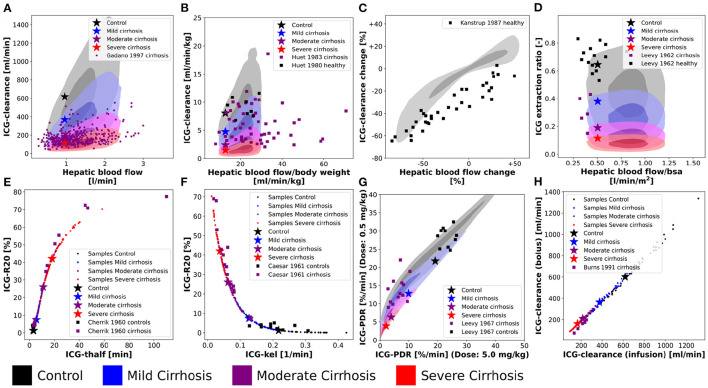
Accurate evaluation of liver function is a central task in hepatology. Dynamic liver function tests (DLFT) based on the time-dependent elimination of a test substance provide an important tool for such a functional assessment. These tests are used in the diagnosis and monitoring of liver disease as well as in the planning of hepatobiliary surgery. A key challenge in the evaluation of liver function with DLFTs is the large inter-individual variability. Indocyanine green (ICG) is a widely applied test compound used for the evaluation of liver function. After an intravenous administration, pharmacokinetic (PK) parameters are calculated from the plasma disappearance curve of ICG which provide an estimate of liver function. The hepatic elimination of ICG is affected by physiological factors such as hepatic blood flow or binding of ICG to plasma proteins, anthropometric factors such as body weight, age, and sex, or the protein amount of the organic anion-transporting polypeptide 1B3 (OATP1B3) mediating the hepatic uptake of ICG. Being able to account for and better understand these various sources of inter-individual variability would allow to improve the power of ICG based DLFTs and move toward an individualized evaluation of liver function. Within this work we systematically analyzed the effect of various factors on ICG elimination by the means of computational modeling. For the analysis, a recently developed and validated physiologically based pharmacokinetics (PBPK) model of ICG distribution and hepatic elimination was utilized. Key results are (i) a systematic analysis of the variability in ICG elimination due to hepatic blood flow, cardiac output, OATP1B3 abundance, liver volume, body weight and plasma bilirubin level; (ii) the evaluation of the inter-individual variability in ICG elimination via a large in silico cohort of n = 100,000 subjects based on the NHANES cohort with special focus on stratification by age, sex, and body weight; (iii) the evaluation of the effect of various degrees of cirrhosis on variability in ICG elimination. The presented results are an important step toward individualizing liver function tests by elucidating the effects of confounding physiological and anthropometric parameters in the evaluation of liver function via ICG.

Keywords: ICG; PBPK; computational model; indocyanine green; liver cirrhosis; liver function; mathematical model; pharmacokinetics.


Conflict of interest statement

The authors declare that the research was conducted in the absence of any commercial or financial relationships that could be construed as a potential conflict of interest.

Figures

Figure 1
Figure 1
Model overview: (A) PBPK model. The whole-body model for ICG consists of venous blood, arterial blood, lung, liver, gastrointestinal tract, and rest compartment (accounting for organs not modeled in detail). The systemic blood circulation connects these compartments. (B) Liver model. ICG is taken up into the liver tissue (hepatocytes) via OATP1B3. The transport was modeled as competitively inhibited by plasma bilirubin. Hepatic ICG is excreted in the bile from where it is subsequently excreted in the feces. No metabolism of ICG occurs in the liver. Figure adapted from Köller et al. (2021).
Figure 2
Figure 2
Effect of physiological factors on ICG parameters: The effect of hepatic blood flow, cardiac output, OATP1B3, liver volume, body weight, and plasma bilirubin on ICG-clearance, ICG-PDR, ICG-R15, and ICG-t1/2 were studied. Reference values of the model parameters, i.e., model parameters in the unchanged model, are indicated as vertical gray dashed lines. Simulations were performed for four different cirrhosis degrees (see Section 2.1): Black: control, blue: mild cirrhosis: purple: moderate cirrhosis, red: severe cirrhosis. (A) Dependency on hepatic blood flow. Clinical data from Grundmann et al. (1992), Pind et al. (2016), Skak and Keiding (1987), and Møller et al. (1998, 2019). For additional data see Figure 3. (B) Dependency on cardiac output. Clinical data (Grundmann et al., ; Pind et al., 2016). (C) Dependency on transport protein amount (OATP1B3). Clinical data from Anzai et al. (2020), Namihisa et al. (1981), and Kagawa et al. (2017). Heterozygote null variants with 0.5 activity, homozygote null variants with 0.0 activity. (D) Dependency on liver volume. Clinical data from Haimerl et al. (2016), Hashimoto and Watanabe (2000), and Roberts et al. (1976). (E) Dependency on body weight. Clinical data from Haimerl et al. (2016) and Huet and Villeneuve (1983). (F) Dependency on the plasma bilirubin concentration. For additional data see Figure 4.
Figure 3
Figure 3
Effect of hepatic blood flow on ICG parameters: For model validation multiple blood flow experiments were simulated and compared to clinical data sets. Simulations were performed for four different cirrhosis degrees (see section 2.1): Black: control, blue: mild cirrhosis: purple: moderate cirrhosis, red: severe cirrhosis. (A) Dependency of ICG-clearance on hepatic blood flow. Clinical data of subjects with liver cirrhosis from Gadano et al. (1997). (B) Dependency of ICG-clearance per kg body weight on hepatic blood flow per kg body weight. Clinical data of control and cirrhotic subjects from Huet and Lelorier (1980) and Huet and Villeneuve (1983). (C) Dependency of ICG-clearance on externally changed hepatic blood flow. Clinical data of healthy subjects from Kanstrup and Winkler (1987). (D) Dependency of ICG extraction ratio on hepatic blood flow. Clinical data of control and cirrhotic subjects from Leevy et al. (1962).
Figure 4
Figure 4
Effect of plasma bilirubin on ICG parameters: For model validation multiple plasma bilirubin experiments were simulated and compared to clinical data sets. Simulations were performed for four different cirrhosis degrees (see section 2.1): Black: control, blue: mild cirrhosis: purple: moderate cirrhosis, red: severe cirrhosis. (A) Dependency of ICG-clearance on the plasma bilirubin concentration. Clinical data of control and cirrhotic subjects from Branch et al. (1976). (B) Dependency of ICG-clearance per kg body weight on the plasma bilirubin concentration. Clinical data of control and cirrhotic subjects from Kawasaki et al. (1988). (C) Dependency of ICG-kel on the plasma bilirubin concentration. Clinical data of control and cirrhotic subjects from Caesar et al. (1961). Clinical data of subjects with other liver diseases from D'Onofrio et al. (2014). (D) Dependency of ICG-R15 on the plasma bilirubin concentration. Clinical data of subjects with other liver diseases from D'Onofrio et al. (2014). (E) Dependency of ICG-R20 on the plasma bilirubin concentration. Clinical data of control and cirrhotic subjects from Caesar et al. (1961). (F) Dependency of ICG extraction ratio on the plasma bilirubin concentration. Clinical data of control and cirrhotic subjects from Caesar et al. (1961) and Leevy et al. (1962).
Figure 5
Figure 5
In silico population: ICG elimination was simulated for an in silico population consisting of n = 100,000 individuals (see Figure 1E for workflow). Subjects are sampled form the NHANES cohort thereby accounting for the existing covariances between sex, age, body weight, height and ethnicity. (A) Workflow to simulate ICG elimination in a large in silico population consisting of n = 100,000 individuals. (B,C) Dependency of body weight on age in men and women. Data from NHANES (NHANES, 1999-2018) depicted as hexbin with shading corresponding to number of subjects (hexbins containing ≥300 subjects are encoded in black). (D) Lognormal density distribution of OATP1B3 amount. Clinical data (gray) from Peng et al. (2015) was normalized to the the model parameter f_oatp1b3 describing the change in OATP1B3 amount relative to the model reference value. (E–G) Distributions of hepatic blood flow per kg body weight and liver volume per kg body weight in three different age groups: blue, 18–40 year; green, 41–65 year; purple, 66–84 year. Clinical data (black) from Wynne et al. (1989).
Figure 6
Figure 6
ICG parameters healthy in silico population: The dependency of (A) ICG-clearance [ml/min], (B) ICG-PDR [%/min], (C) ICG-R15[%], and (D) ICG-t1/2 [min] on body weight, sex and age in n = 100,000 individuals. Results are stratified by body weight class (40–60 kg, 60–80 kg, 80–100 kg, and 100–140 kg), age group (blue, 18–40 year; green, 41–65 year; purple, 66–84 year) and sex (M, unshaded; F, shaded). No women exist with body weight > 100 kg in the cohort. The sample size of the respective subgroups are depicted above each boxplot. The box extends from the lower to upper quartile values of the data, with a line at the median with whiskers as defined by Tukey. Individual data points are plotted for all subgroups. Subjects were simulated as healthy controls. For the corresponding results in mild cirrhosis, moderate cirrhosis, and severe cirrhosis see Supplementary Figures 1–3, respectively.
Figure 7
Figure 7
Validation of in silico population predictions: Age dependency of ICG clearance per body weight (A–D) and kel (E–H) in the population depicted as hexbins. Simulations were performed for four different cirrhosis degrees (see section 2.1): Black, control, blue, mild cirrhosis; purple, moderate cirrhosis; red, severe cirrhosis. Clinical data of controls from Caesar et al. (1961), Branch et al. (1976), Wood et al. (1979), and Kawasaki et al. (1988), and cirrhotic subjects from Caesar et al. (1961), Branch et al. (1976), Jost et al. (1987), and Kawasaki et al. (1988).
Figure 8
Figure 8
Variability analysis-model validation: Simulations were performed for four different cirrhosis degrees [except in (C)]. Black, control; blue, mild cirrhosis; purple, moderate cirrhosis; red, severe cirrhosis. Stars depict the respective reference simulations. (A–D,G) The identical simulations as in Figure 3 were performed for the entire in silico population (n = 100,000). (E,F,H) Simulations were performed for a subset of the in silico population (n = 50). (E) Correlation between ICG-R20 and ICG-t1/2. Clinical data of control and cirrhotic subjects from Cherrick et al. (1960). (F) Correlation between ICG-R20 and ICG-kel. Clinical data of control and cirrhotic subjects from Caesar et al. (1961). (G) Correlation between ICG-PDR after an ICG dose of 0.5 mg/kg and 5.0 mg/kg. Clinical data of control subjects and liver cirrhosis from Leevy et al. (1967). (H) Correlation between ICG-clearance after a bolus administration and a constant infusion of ICG. Clinical data of cirrhotic subjects from Burns et al. (1991).
Figure 9
Figure 9
Contributions to population variability: Relationship between ICG-clearance and ICG-PDR with clinical data from Sakka and van Hout (Sakka and van Hout, 2006). (A) Results of the simulations of the complete in silico population (n = 100,000). (B–E) Results of simulations, when hepatic blood flow, OATP1B3 level, liver volume, or body weight were varied individually in the range covered by the population. The respective other factors were set to their respective reference values in the simulation. Stars depict the reference simulation of the model.

Similar articles

Cited by

References

    1. Anzai K., Tsuruya K., Morimachi M., Arase Y., Hirose S., Hirabayashi K., et al. . (2020). The impact of a heterozygous SLCO1B3 null variant on the indocyanine green retention test. J. Pharm. Sci. 109, 3206–3209. 10.1016/j.xphs.2020.06.020 - DOI - PubMed
    1. Berk P. D., Potter B. J., Stremmel W. (1987). Role of plasma membrane ligand-binding proteins in the hepatocellular uptake of albumin-bound organic anions. Hepatology 7, 165–176. 10.1002/hep.1840070131 - DOI - PubMed
    1. Branch R. A., James J. A., Read A. E. (1976). The clearance of antipyrine and indocyanine green in normal subjects and in patients with chronic lever disease. Clin. Pharmacol. Ther. 20, 81–89. 10.1002/cpt197620181 - DOI - PubMed
    1. Burns E., Triger D. R., Tucker G. T., Bax N. D. (1991). Indocyanine green elimination in patients with liver disease and in normal subjects. Clin. Sci. 80, 155–160. 10.1042/cs0800155 - DOI - PubMed
    1. Burt H. J., Riedmaier A. E., Harwood M. D., Crewe H. K., Gill K. L., Neuhoff S. (2016). Abundance of hepatic transporters in caucasians: a meta-analysis. Drug Metab. Dispos. 44, 1550–1561. 10.1124/dmd.116.071183 - DOI - PMC - PubMed

LinkOut - more resources