. 2021 Nov 22:12:747576.
doi: 10.3389/fgene.2021.747576. eCollection 2021.

Identification and Validation of Prognostic Factors of Lipid Metabolism in Obstructive Sleep Apnea

Affiliations

Identification and Validation of Prognostic Factors of Lipid Metabolism in Obstructive Sleep Apnea

Lu Peng et al. Front Genet. .

Abstract

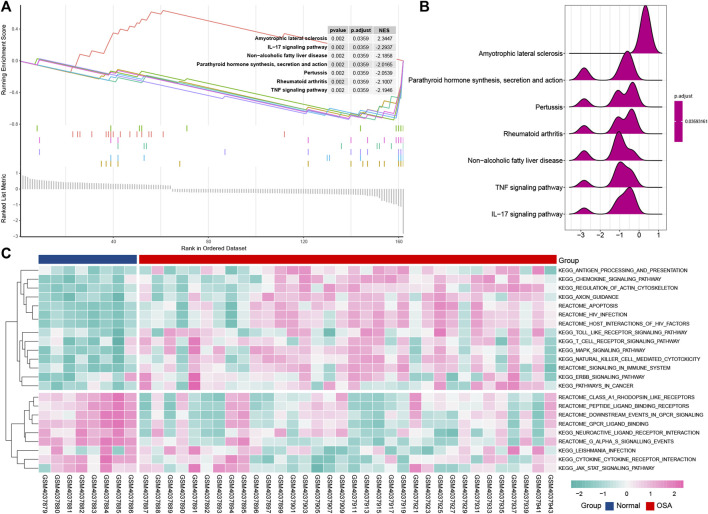
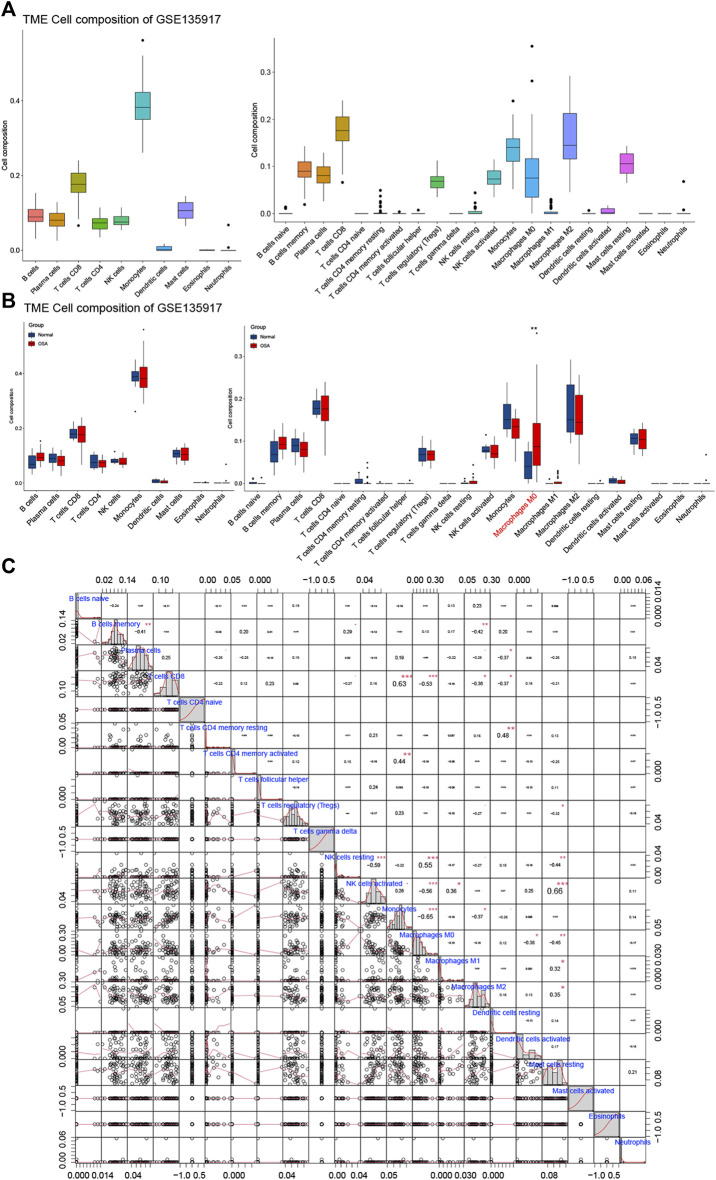
Background: Obstructive sleep apnea (OSA) is considered to be an independent factor affecting lipid metabolism. This study explored the relationship between immune genes and lipid metabolism in OSA. Methods: Immune-related Differentially Expressed Genes (DEGs) were identified by analyzing microarray data sets from the Gene Expression Omnibus (GEO) database. Subsequently, we conducted protein-protein interaction (PPI) network analysis and calculated their Gene Ontology (GO) semantic similarity. The GO, Kyoto Encyclopedia of Genes and Genomes (KEGG) pathways, Disease Ontology (DO), gene set enrichment analysis (GSEA), and gene set variation analysis (GSVA) were employed for functional enrichment analyses and to determine the most significant functional terms. Combined with the results of boruta and random forest, we selected predictors to build a prognostic model, along with seeking out the potential TFs and target drugs for the predictive genes. Results: Immune-related DEGs included 64 genes upregulated and 98 genes downregulated. The enrichment analysis might closely associate with cell adhesion and T cell-mediated immunity pathways and there were many DEGs involved in lipid and atherosclerosis signaling pathways. The highest-ranking hub gene in PPI network have been reported lowly expressed in OSA. In line with the enrichment analysis, DO analysis reveal that respiratory diseases may be associated with OSA besides immune system disorders. Consistent with the result of the KEGG pathway, the analysis of GSVA revealed that the pro-inflammation pathways are associated with OSA. Monocytes and CD8 T cells were the predominant immune cells in adipose tissue. We built a prognostic model with the top six genes, and the prognostic genes were involved in the polarization of macrophage and differentiation of T lymphocyte subsets. In vivo experimental verification revealed that EPGN, LGR5, NCK1 and VIP were significantly down-regulated while PGRMC2 was significantly up-regulated in mouse model of OSA. Conclusions: Our study demonstrated strong associations between immune genes and the development of dyslipidemia in OSA. This work promoted the molecular mechanisms and potential targets for the regulation of lipid metabolism in OSA.

Keywords: immunologic factors; lipid metabolism; macrophage activation; microarray analysis; obstructive sleep apnea.


Conflict of interest statement

The authors declare that the research was conducted in the absence of any commercial or financial relationships that could be construed as a potential conflict of interest.

Figures

FIGURE 1
FIGURE 1
Flow chart of methodologies applied in the current study.
FIGURE 2
FIGURE 2
The Expression profiles before and after normalization. (A) GSE135917 data before normalization. (B) GSE135917 data after normalization. (C) GSE38792 data before normalization. (D) GSE38792 data after normalization.
FIGURE 3
FIGURE 3
Analysis of DEGs and immune-related DEGs in data set GSE135917. (A) Principle component analysis (PCA) plot of 382 DEGs shows that samples be divided into two clusters. Blue dots indicate normal samples, red dots indicates obstructive sleep apnea (OSA) samples. (B) The volcano plot of differentially expressed genes (DEGs). Red dots represent significant different expression genes, and green dots represent no significant different expression genes. (C) The heatmap of DEGs. Each row represents one gene, and each column represents one sample. Red indicates that the expression of genes is relatively upregulated, and blue indicates that the expression of genes is relatively downregulated. (D). PCA plot of 162 immune-related DEGs. (E) The volcano plot of immune-related DEGs. (F) The heatmap of immune-related DEGs.
FIGURE 4
FIGURE 4
Protein-protein interactions (PPI) network construction and semantic similarity analysis of immune-related DEGs. (A) The PPI network of immune-related DEGs. Each circle represents a gene. The upregulated genes (red) and downregulated genes (green) are represented by circles. Different sizes indicate the core degree of genes in the PPI network, whereas bigger size indicates more important in the network. (B) Summary of functional similarities of the top 10 immune-related DEGs. The aggregate score is between 0 and 1. The higher the score is, the more similarity genes are.
FIGURE 5
FIGURE 5
GO, KEGG pathway and Do terms enrichment analysis of immune-related DEGs. GO terms enrichment analysis of the DEGs, including BP (A), CC (B), and MF (C) categories. (D) KEGG pathway enrichment analysis of the DEGs. (E) Do terms enrichment analysis of DEGs. The size of the symbol represents the gene counts enriched in the signaling pathway. The color indicates the degree of significance. Signaling pathways of the T cell receptor signaling pathway (F), lipid and atherosclerosis (G), and cytokine-cytokine receptor interaction (H). The genes significantly up-regulated filled in red color and down-regulated filled in green color.
FIGURE 6
FIGURE 6
Pathway enrichment analysis of the immune-related DEGs. Gene set enrichment analysis (GSEA) displays the top 7 enriched pathways in OSA using enrichment plots (A) and ridge plots (B). (C) Gene set variation analysis (GSVA) for significantly enriched pathways in OSA.
FIGURE 7
FIGURE 7
Prognostic model building and validation. (A) The z score evolution with Boruta run. (B) Selected genes by Boruta algorithm. (C) The average error rate of random forest model. (D) Variable importance ordered by accuracy and the gini index of a mean decrease in random forest. (E) Receiver operating characteristic (ROC) curve with area under the curve (AUC) values for GSE135917. (F) The expression of predictors in GSE135917. (G) The expression of predictors in GSE38792. (H) ROC curve with AUC values for GSE38792.
FIGURE 8
FIGURE 8
Immune cell infiltrate analysis. (A) The composition of the immune cell infiltrate in OSA. (B) The differential expression of different types of immune cells between normal and OSA tissues. (C) Correlation matrix of 22 types of immune cell proportions.
FIGURE 9
FIGURE 9
Correlation analysis between predictors and immune cells. Significantly correlations between predictors and immune cells: NCK1 and monocytes (A), NCK1 and macrophages M1 (B), NCK1 and mast cells resting (C), PGRMC2 and macrophages M1 (D), EPGN and plasma cells (E), VIP and T cells CD4 memory resting (F), and LGR5 and monocytes (G,H). Violin plots of the abundance of macrophages M0. The box plots in the violin indicate the median and interquartile range of the data distribution.
FIGURE 10
FIGURE 10
Transcription factors and target drugs analysis. (A) Regulatory network of the predicted transcription factors and the target genes. (B) Drug-gene network using gene-centric fashions. Green circles indicate target genes, orange octagons indicate predictive transcription factors, and red quadrilateral indicate predictive drug.
FIGURE 11
FIGURE 11
The expression trend of prognostic factors after 4 weeks of chronic intermittent hypoxia (CIH). (A) The flow chart of CIH exposure procedure. The expression of EPGN (B), IGR5 (C), NCK1 (D), VIP (E), and PGRMC2 (F). Data are presented as means ± SEM, n = 6 for each group. *p < 0.05, * *p < 0.01 and * * *p < 0.001 compared with control animals.

Similar articles

Cited by

References

    1. Alterki A., Joseph S., Thanaraj T. A., Al-Khairi I., Cherian P., Channanath A., et al. (2020). Targeted Metabolomics Analysis on Obstructive Sleep Apnea Patients after Multilevel Sleep Surgery. Metabolites 10 (9), 358. 10.3390/metabo10090358 - DOI - PMC - PubMed
    1. Barros D., García-Río F. (2019). Obstructive Sleep Apnea and Dyslipidemia: from Animal Models to Clinical Evidence. Sleep 42 (3). 10.1093/sleep/zsy236 - DOI - PubMed
    1. Batra V., Maheshwarappa A., Dagar K., Kumar S., Soni A., Kumaresan A., et al. (2019). Unusual Interplay of Contrasting Selective Pressures on β-defensin Genes Implicated in Male Fertility of the Buffalo (Bubalus Bubalis). BMC Evol. Biol. 19 (1), 214. 10.1186/s12862-019-1535-8 - DOI - PMC - PubMed
    1. Bhattacharya S., Andorf S., Gomes L., Dunn P., Schaefer H., Pontius J., et al. (2014). ImmPort: Disseminating Data to the Public for the Future of Immunology. Immunol. Res. 58 (2-3), 234–239. 10.1007/s12026-014-8516-1 - DOI - PubMed
    1. Cao Y., Cai X., Zhu Q., Li N. (2021). Screening and Identification of Potential Biomarkers for Obstructive Sleep Apnea via Microarray Analysis. Medicine (Baltimore) 100 (4), e24435. 10.1097/md.0000000000024435 - DOI - PMC - PubMed