Differential Gene Expression in Host Ubiquitination Processes in Childhood Malarial Anemia
- PMID: 34880904
- PMCID: PMC8646022
- DOI: 10.3389/fgene.2021.764759
Differential Gene Expression in Host Ubiquitination Processes in Childhood Malarial Anemia
Abstract
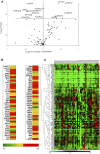
Background: Malaria remains one of the leading global causes of childhood morbidity and mortality. In holoendemic Plasmodium falciparum transmission regions, such as western Kenya, severe malarial anemia [SMA, hemoglobin (Hb) < 6.0 g/dl] is the primary form of severe disease. Ubiquitination is essential for regulating intracellular processes involved in innate and adaptive immunity. Although dysregulation in ubiquitin molecular processes is central to the pathogenesis of multiple human diseases, the expression patterns of ubiquitination genes in SMA remain unexplored. Methods: To examine the role of the ubiquitination processes in pathogenesis of SMA, differential gene expression profiles were determined in Kenyan children (n = 44, aged <48 mos) with either mild malarial anemia (MlMA; Hb ≥9.0 g/dl; n = 23) or SMA (Hb <6.0 g/dl; n = 21) using the Qiagen Human Ubiquitination Pathway RT2 Profiler PCR Array containing a set of 84 human ubiquitination genes. Results: In children with SMA, 10 genes were down-regulated (BRCC3, FBXO3, MARCH5, RFWD2, SMURF2, UBA6, UBE2A, UBE2D1, UBE2L3, UBR1), and five genes were up-regulated (MDM2, PARK2, STUB1, UBE2E3, UBE2M). Enrichment analyses revealed Ubiquitin-Proteasomal Proteolysis as the top disrupted process, along with altered sub-networks involved in proteasomal, protein, and ubiquitin-dependent catabolic processes. Conclusion: Collectively, these novel results show that protein coding genes of the ubiquitination processes are involved in the pathogenesis of SMA.
Keywords: Plasmodium falciparum; differential gene expression; malarial anemia; ubiquitin proteasome system; ubiquitination.
Copyright © 2021 Anyona, Raballah, Cheng, Hurwitz, Ndege, Munde, Otieno, Seidenberg, Schneider, Lambert, McMahon, Ouma and Perkins.
Conflict of interest statement
The authors declare that the research was conducted in the absence of any commercial or financial relationships that could be construed as a potential conflict of interest.
Figures


Similar articles
-
Transcriptomic and Proteomic Insights into Host Immune Responses in Pediatric Severe Malarial Anemia: Dysregulation in HSP60-70-TLR2/4 Signaling and Altered Glutamine Metabolism.Pathogens. 2024 Oct 3;13(10):867. doi: 10.3390/pathogens13100867. Pathogens. 2024. PMID: 39452740 Free PMC article.
-
Entire expressed peripheral blood transcriptome in pediatric severe malarial anemia.Nat Commun. 2024 Jun 12;15(1):5037. doi: 10.1038/s41467-024-48259-4. Nat Commun. 2024. PMID: 38866743 Free PMC article.
-
Human NCR3 gene variants rs2736191 and rs11575837 alter longitudinal risk for development of pediatric malaria episodes and severe malarial anemia.BMC Genomics. 2023 Sep 13;24(1):542. doi: 10.1186/s12864-023-09565-1. BMC Genomics. 2023. PMID: 37704951 Free PMC article.
-
Severe malarial anemia: innate immunity and pathogenesis.Int J Biol Sci. 2011;7(9):1427-42. doi: 10.7150/ijbs.7.1427. Epub 2011 Nov 2. Int J Biol Sci. 2011. PMID: 22110393 Free PMC article. Review.
-
Entire Expressed Peripheral Blood Transcriptome in Pediatric Severe Malarial Anemia.Res Sq [Preprint]. 2023 Jul 19:rs.3.rs-3150748. doi: 10.21203/rs.3.rs-3150748/v1. Res Sq. 2023. Update in: Nat Commun. 2024 Jun 12;15(1):5037. doi: 10.1038/s41467-024-48259-4. PMID: 37503086 Free PMC article. Updated. Preprint.
Cited by
-
Transcriptomic and Proteomic Insights into Host Immune Responses in Pediatric Severe Malarial Anemia: Dysregulation in HSP60-70-TLR2/4 Signaling and Altered Glutamine Metabolism.Pathogens. 2024 Oct 3;13(10):867. doi: 10.3390/pathogens13100867. Pathogens. 2024. PMID: 39452740 Free PMC article.
-
Entire expressed peripheral blood transcriptome in pediatric severe malarial anemia.Nat Commun. 2024 Jun 12;15(1):5037. doi: 10.1038/s41467-024-48259-4. Nat Commun. 2024. PMID: 38866743 Free PMC article.
-
Systems biology of malaria explored with nonhuman primates.Malar J. 2022 Jun 7;21(1):177. doi: 10.1186/s12936-022-04199-2. Malar J. 2022. PMID: 35672852 Free PMC article. Review.
-
Ingestion of hemozoin by peripheral blood mononuclear cells alters temporal gene expression of ubiquitination processes.Biochem Biophys Rep. 2022 Jan 11;29:101207. doi: 10.1016/j.bbrep.2022.101207. eCollection 2022 Mar. Biochem Biophys Rep. 2022. PMID: 35071802 Free PMC article.
References
Grants and funding
LinkOut - more resources
Full Text Sources
Research Materials
Miscellaneous

