. 2021 Dec;11(12):503.
doi: 10.1007/s13205-021-03050-w. Epub 2021 Nov 18.

Identification of the key functional genes in salt-stress tolerance of Cyanobacterium Phormidium tenue using in silico analysis

Affiliations

Identification of the key functional genes in salt-stress tolerance of Cyanobacterium Phormidium tenue using in silico analysis

Mehrdad Shahbazi et al. 3 Biotech. 2021 Dec.

Abstract

The development of artificial biocrust using cyanobacterium Phormidium tenue has been suggested as an effective strategy to prevent soil degradation. Here, a combination of in silico approaches with growth rate, photosynthetic pigment, morphology, and transcript analysis was used to identify specific genes and their protein products in response to 500 mM NaCl in P. tenue. The results show that 500 mM NaCl induces the expression of genes encoding glycerol-3-phosphate dehydrogenase (glpD) as a Flavoprotein, ribosomal protein S12 methylthiotransferase (rimO), and a hypothetical protein (sll0939). The constructed co-expression network revealed a group of abiotic stress-responsive genes. Using the Basic Local Alignment Search Tool (BLAST), the homologous proteins of rimO, glpD, and sll0939 were identified in the P. tenue genome. Encoded proteins of glpD, rimO, and DUF1622 genes, respectively, contain (DAO and DAO C), (UPF0004, Radical SAM and TRAM 2), and (DUF1622) domains. The predicted ligand included 22B and MG for DUF1622, FS5 for rimO, and FAD for glpD protein. There was no direct disruption in ligand-binding sites of these proteins by Na+, Cl-, or NaCl. The growth rate, photosynthetic pigment, and morphology of P. tenue were investigated, and the result showed an acceptable tolerance rate of this microorganism under salt stress. The quantitative real-time polymerase chain reaction (qRT-PCR) results revealed the up-regulation of glpD, rimO, and DUF1622 genes under salt stress. This is the first report on computational and experimental analyses of the glpD, rimO, and DUF1622 genes in P. tenue under salt stress to the best of our knowledge.

Supplementary information: The online version contains supplementary material available at 10.1007/s13205-021-03050-w.

Keywords: Biocrust; Homology modeling; Molecular docking; NaCl; Phormidium tenue; Transcript analysis.


Figures

Fig. 1
Fig. 1
schematic representation of biochemical pathways related to glpD and rimO proteins. A [sulfur carrier] − SH + AH2 + l-aspartate89- [ribosomal protein uS12]-hydrogen + 2 S-adenosyl-l-methionine = 3-methylsulfanyl-l-aspartate89- [ribosomal protein uS12]-hydrogen + 5′-deoxyadenosine + [sulfur carrier]-H + A + 2 H +  + l-methionine + S-adenosyl-l-homocysteine. B A quinone + sn-glycerol 3-phosphate = a quinol + dihydroxyacetone phosphate
Fig. 2
Fig. 2
The predicted structures for glpD, rimO and sll0939. A, D Predicted structure for glpD with trRosetta database with very high confidence and Ramachandran plot with 96% of amino acids in most favoured region. B, E Predicted structure for rimO with trRosetta database with very high confidence and Ramachandran plot with 92% of amino acids in most favoured region. C, F Predicted structure for sll0939 with trRosetta database with very high confidence and Ramachandran plot with 91% of amino acids in most favoured region
Fig. 3
Fig. 3
The overall 3D view of the modeled proteins bound to their predicted native ligands. A The FS5 ligand for rimO protein, B the FAD ligand for glpD protein, C The MG ligand for DUF1622 protein, D The 22B ligand for sll0939 protein
Fig. 4
Fig. 4
A The complex of DUF1622 and MG in presence of Na+, B The complex of DUF1622 and 22B in presence of Na+, C The complex of DUF1622 and 22B in presence of Cl, D The complex of DUF1622 and MG in presence of Cl, E The complex of rimO and FS5 in presence of Na+, F The complex of rimO and FS5 in presence of Cl, G The complex of glpD and FAD in presence of Cl, H The complex of glpD and FAD in presence of Na+
Fig. 5
Fig. 5
structural representation of Na+, Cl, and NaCl molecules binding poses on the glpD, rimO and DUF1622 A Predicted Cl binding pose in glpD, B Predicted Na+ binding pose in glpD, C Predicted NaCl binding poses in glpD, D Predicted Cl binding pose in rimO, E Predicted Na+ binding pose in rimO, F Predicted NaCl binding poses in rimO. G Predicted Cl binding pose in DUF1622, H Predicted Na+ binding pose in DUF1622, I Predicted NaCl binding poses in DUF1622
Fig. 6
Fig. 6
The binding free energies of all proteins in complex with their predicted native ligands. Energyt is the total binding energy of native ligand and the protein. Energyu Na+ is the Na+ binding energy to the binding site. Energyt Na+ is the binding energy of native ligand in presence of Na+. Energyu Cl is the Cl binding energy to the binding site. Energyt Cl is the binding energy of native ligand in presence of Cl
Fig. 7
Fig. 7
The binding energies of Na+, Cl and NaCl different poses on glpD, rimO and DUF1622 proteins. Na+, Cl and NaCl binding energies are shown with blue, red and green bars respectively
Fig. 8
Fig. 8
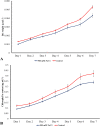
A The dry weight mesurment of P. tenue under 500 mM NaCl for 7 days. B Chlrophyll a content mesutment of P. tenue under 500 mM NaCl for 7 days
Fig. 9
Fig. 9
Depigmentation of cells. A control cells. B, C 500 mM NaCl treated cell after 7 days
Fig. 10
Fig. 10
Relative gene expression analysis of glpD, rimO and DUF1622 genes under 500 mM NaCl for 24 h condition. Error bars represent the means ± SD taken from three independent biological replicates. Different lower case letters above columns indicate significant differences at the (P < 0.05) and show significant differences compared with control

References

    1. Allakhverdiev SI, Murata N. Salt stress inhibits photosystems II and I in cyanobacteria. Photosynth Res. 2008;98:529–539. - PubMed
    1. Allakhverdiev SI, Sakamoto A, Nishiyama Y, Inaba M, Murata N. Ionic and osmotic effects of NaCl-induced inactivation of photosystems I and II in Synechococcus sp. Plant Physiol. 2000;123:1047–1056. - PMC - PubMed
    1. Allocco DJ, Kohane IS, Butte AJ. Quantifying the relationship between co-expression, co-regulation and gene function. BMC Bioinform. 2004;5:1–10. - PMC - PubMed
    1. Allu AD, Soja AM, Wu A, Szymanski J, Balazadeh S. Salt stress and senescence: identification of cross-talk regulatory components. J Exp Bot. 2014;65:3993–4008. - PMC - PubMed
    1. Antoninka A, Bowker MA, Reed SC, Doherty K. Production of greenhouse-grown biocrust mosses and associated cyanobacteria to rehabilitate dryland soil function. Restor Ecol. 2016;24:324–335.