. 2021 Dec;8(23):e2100759.
doi: 10.1002/advs.202100759. Epub 2021 Oct 28.

Inhibition of the PLK1-Coupled Cell Cycle Machinery Overcomes Resistance to Oxaliplatin in Colorectal Cancer

Affiliations

Inhibition of the PLK1-Coupled Cell Cycle Machinery Overcomes Resistance to Oxaliplatin in Colorectal Cancer

Zhaoliang Yu et al. Adv Sci (Weinh). 2021 Dec.

Abstract

Dysregulation of the cell cycle machinery leads to genomic instability and is a hallmark of cancer associated with chemoresistance and poor prognosis in colorectal cancer (CRC). Identifying and targeting aberrant cell cycle machinery is expected to improve current therapies for CRC patients. Here,upregulated polo-like kinase 1 (PLK1) signaling, accompanied by deregulation of cell cycle-related pathways in CRC is identified. It is shown that aberrant PLK1 signaling correlates with recurrence and poor prognosis in CRC patients. Genetic and pharmacological blockade of PLK1 significantly increases the sensitivity to oxaliplatin in vitro and in vivo. Mechanistically, transcriptomic profiling analysis reveals that cell cycle-related pathways are activated by oxaliplatin treatment but suppressed by a PLK1 inhibitor. Cell division cycle 7 (CDC7) is further identified as a critical downstream effector of PLK1 signaling, which is transactivated via the PLK1-MYC axis. Increased CDC7 expression is also found to be positively correlated with aberrant PLK1 signaling in CRC and is associated with poor prognosis. Moreover, a CDC7 inhibitor synergistically enhances the anti-tumor effect of oxaliplatin in CRC models, demonstrating the potential utility of targeting the PLK1-MYC-CDC7 axis in the treatment of oxaliplatin-based chemotherapy.

Keywords: MYC; cell division cycle 7; colorectal cancer; oxaliplatin; polo-like kinase 1.


Conflict of interest statement

The authors declare no conflict of interest.

Figures
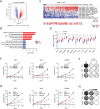
Figure 1
Figure 1
Dysfunction of PLK1 signaling pathway promotes tumorigenesis of CRC. A) The differentially expressed genes in 54 pairs of human colorectal tumor versus matched normal mucosa are shown in the volcano plot. B) The top five up/down enrichment pathways in tumors versus matched normal mucosa. C) Heatmap of NES values in GSEA analysis of tumors compared with matched normal mucosa using hallmark gene sets. 54 patients were listed according to the NES values in GSEA analysis with PLK1 signaling gene set, top 10 hallmark gene sets are shown, and relative expression of MKI67 and PCNA is shown. D) Relative mRNA levels of PLK1 signaling genes in CRC samples and matched normal colon tissues. E) Cell viability of indicated cancer cell lines after silencing PLK1 or applying a control. F) Colony formation assay in cells treated with siPLK1 knockdown after 12 days culture. G) Cell viability of indicated cancer cell lines after treatment with different doses of PLK1 inhibitor (GSK461364), with applying DMSO as a control. H) Colony formation assay in cells treated with indicated concentration of GSK461364 in DLD1 (5, 10 nm) and in WiDr and SW480 (2.5, 5 nm). Cells were stained with crystal violet after 12 days. Error bars represent ± SD (E,G). Data are representative of three independent experiments (E–H).
Figure 2
Figure 2
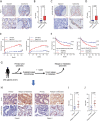
Hyperactivity of PLK1 is associated with CRC recurrence and poor prognosis. A) Representative IHC staining of PLK1 in CRC and normal tissues, and high‐ magnification images of representative IHC staining. B) IHC scores of PLK1 expression in tumor tissue versus adjacent tissue. C) Representative IHC staining of p‐PLK1 (T210) in CRC and normal tissues, and high‐ magnification images of representative IHC staining. Scale bar = 100 µm (A,C). D) IHC scores of p‐PLK1 expression in tumor tissue versus adjacent tissue. p values were determined by two‐tailed Student's t‐test (B,D). E) Kaplan–Meier curves of recurrence time in CRC patients according to high and low PLK1/p‐PLK1 expression. F) Kaplan–Meier curves of overall survival rates in CRC patients according to high and low PLK1/p‐PLK1 expression. G) Schematic diagram of collecting primary tumor specimens and relapse or metastasis specimens from the same patient underwent oxaliplatin based chemotherapy. H) Representative IHC images for PLK1 and p‐PLK1 (T210) in primary and relapse or metastasis CRC tissues. Scale bar = 50 µm. I) IHC scores of PLK1 expression in primary tumor tissue versus relapse or metastasis tumor tissue. J) IHC scores of p‐PLK1 expression in primary tumor tissue versus relapse or metastasis tumor tissue. IHC scores were determined by the intensity score and the proportion of area positively stained tumor cells. p values were determined by two‐tailed paired Student's t‐test (I,J).
Figure 3
Figure 3
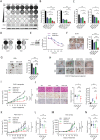
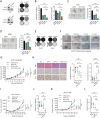
PLK1 inhibition overcomes the resistance to oxaliplatin in vitro and in vivo. A) Colony formation assay of indicated cancer cell lines treated with different dosages of oxaliplatin. Cells were stained with crystal violet after 12 days of cell culture. B) Cell viability of indicated cancer cell lines treated with 2 siRNAs targeting PLK1, oxaliplatin, or both. Cell viability was determined on day 1 and day 5 after treatment and proliferation index was calculated as fold change of cell viability. Error bars represent ± SD. C) Cell viability of indicated cancer cell lines treated with PLK1 inhibitor (GSK461364) at the presence or absence of oxaliplatin for 5 days. Error bars represent ± SD. D) Colony formation assay in cells treated PLK1 inhibitor (GSK461364), oxaliplatin, or combination at 12 days. E) Effects of PLK1 overexpression in SW480 cells on oxaliplatin sensitivity, assessed by growth curves. F) Representative image of tumor sphere formation assay in DLD1 cells treated with GSK461364, oxaliplatin, or combination (left) after 10 days of cell culture. Scale bar = 500 µm. Relative tumor spheres in cells treated with GSK461364, oxaliplatin, or combination (right). G) Representative image of tumor sphere formation assay in WiDr cells treated with GSK461364, oxaliplatin, or combination (left) after 10 days of cell culture. Scale bar = 500 µm. Relative tumor spheres in cells treated with GSK461364, oxaliplatin, or combination (right). H) Representative image of PDO CC0117 treated with GSK461364, oxaliplatin, or combination after 16 days culture. Scale bar = 200 µm. I) The growth curve of tumor volume in vivo efficacy of oxaliplatin and PLK1 inhibitor (volavertib) in DLD xenografts. Error bars represent ± SEM. J) Representative image of hematoxylin‐eosin staining (HE) and IHC of Ki‐67 and cleaved‐caspase 3 in DLD1 xenograft tumors (left). Scale bar = 20 µm. Relative Ki‐67 and relative cleaved‐caspase 3 positive cells expression in four groups of DLD1 xenograft tumors (right). K) The growth curve of tumor volume in vivo efficacy of oxaliplatin and volasertib in PDX CC0117 model. Error bars represent ± SEM. L) Relative Ki‐67 expression in four groups of PDX CC0117 model. M) The growth curve of tumor volume in vivo efficacy of oxaliplatin and volasertib in PDX 07162 model. N) Relative Ki‐67 expression in four groups of PDX 07162 model. Error bars represent ± SEM. Data are representative of three independent experiments (A–G). *p< 0.05, **p< 0.01, ***p< 0.001, one‐way ANOVA with Dunnett's multiple comparisons test (B–D,F,G,J,L,N), and two‐way ANOVA with Dunnett's multiple comparisons test (I,K,M).
Figure 4
Figure 4
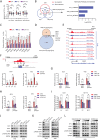
PLK1 inhibition blocks CDC7 transactivation via MYC signaling. A) Box plots showing expression changes of cell cycle pathway genes in DLD1 cells treated with 5 µm oxaliplatin, 40 nm volasertib, or combination for 48 h. The vertical axis represents the log2 (TPM) in the indicated genotype group. B) Venn diagram showing up‐ and down‐regulated genes (adjust p < 0.05) by oxaplatin, volasertib, or combination compared with control (left) and the hallmark pathway analysis of 27 target genes (right). C) RT‐qPCR analysis of candidated genes in DLD1 treated with 5 µm oxaplatin, 40 nm volasertib, or combination. D) Venn diagram showing the RNA‐seq target genes and the MYC ChIP‐seq target genes. E) Track view of MYC CHIP‐seq density profile on CDC7 genomic region from published datasets. The x axis shows genomic position. The y axis shows signal strength of MYC binding. F) Schematic diagram of the ChIP primer (P1–P4) locations across the CDC7 promoter region (up). Chromatin extracts from DLD1 and WiDr cells were subjected to ChIP using anti‐MYC antibody or normal IgG, genomic regions of the CDC7 promoter were tested for enrichment of MYC binding (down). Data are presented relative to input and shown as mean ± SD of technical triplicates. G) CDC7 promoter luciferase reporter was transfected into DLD1 and WiDr cells infected with control siRNA or MYC siRNA, and luciferase activity was measured 48 h after transfection. pGL3‐base is the empty vector control for CDC7 promoter reporter. Data are presented relative to Renilla readings and shown as mean ± SD of biological triplicates. H) CDC7 promoter luciferase reporter was transfected into DLD1 and WiDr cells infected with control siRNA or siPLK1, and luciferase activity was measured 48 h after transfection. Data are presented relative to Renilla readings and shown as mean ± SD of biological triplicate. I) DLD1 and HCT116 cells were infected with retroviral constructs expressing empty vector and MYC. CDC7 promoter luciferase reporter was transfected into the cells and the cells were treated with DMSO or PLK1 inhibitor (GSK461364) for 24 h. Data are presented relative to Renilla readings and shown as mean ± SD of biological triplicate. J) Immunoblot analysis of DLD1 and WiDr cells infected with two siRNAs targeting MYC. Samples were collected at 72 h after siRNA transfection. K) Immunoblot analysis of DLD1 and WiDr cells infected with two siRNAs targeting PLK1. Samples were collected at 72 h after siRNA transfection. L) Immunoblot analysis of DLD1 cells treated with PLK1 inhibitors for 48 h. *p < 0.05, **p < 0.01, ***p < 0.001, and two‐tailed Student's t‐test (C,F–I).
Figure 5
Figure 5
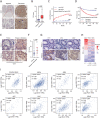
Aberrant PLK1‐MYC‐CDC7 signaling is associated with poor prognosis and recurrence in CRC. A) Representative IHC staining of CDC7 in CRC and normal tissues, and high‐ magnification images of representative IHC staining. Scale bar = 100 µm. B) IHC scores of CDC7 expression in tumor tissue versus adjacent tissue. p value was determined by two‐tailed Student's t‐test. C) Kaplan–Meier curves of recurrence time in CRC patients according to high and low CDC7 expression. D) Kaplan–Meier curves of overall survival rates in CRC patients according to high and low CDC7 expression. E) Representative IHC images for CDC7 in primary and relapse or metastasis CRC tissues. Scale bar = 100 µm. F) IHC scores of CDC7 expression in primary tumor tissue versus relapse or metastasis tumor tissue (n = 27). IHC scores were determined by the intensity score and the proportion of area positively stained tumor cells. p values were determined by two‐tailed paired Student's t‐test. G) Representative IHC staining of PLK1, MYC, and CDC7 in the same patients. Scale bar = 200 µm. H) Heatmap of IHC score (by Spearman relevance) between PLK1, MYC, and CDC7 in CRC specimens. I) Positive correlation (by Pearson's) between CDC7 and PLK1 in eight types of cancer. Data were derived from the TCGA dataset. COAD: colon adenocarcinoma, READ: rectum adenocarcinoma, BRCA: breast invasive carcinoma, GBM: glioblastoma multiforme, LGG: brain lower grade glioma, ACC: adrenocortical carcinoma, LIHC: liver hepatocellular carcinoma, LUAD: lung adenocarcinoma, and PRAD: prostate adenocarcinoma.
Figure 6
Figure 6
CDC7 inhibition overcomes the resistance to oxaliplatin in vitro and in vivo. A) Colony formation assay in cells treated with siRNA siCDC7, oxaliplatin, or both after 12 days of cell culture. B) Cell viability of indicated cancer cell lines treated with CDC7 inhibitor (XL413) in the presence or absence of oxaliplatin for 5 days. Error bars represent ± SD. C) Representative image of tumor sphere formation assay in DLD1 cells treated with XL413, oxaliplatin, or combination after 10 days of cell culture (left). Scale bar = 500 µm. Relative tumor spheres in cells treated with XL413, oxaliplatin, or combination (right). D) Representative image of tumor sphere formation assay in WiDr cells treated with XL413, oxaliplatin, or combination after 10 days of cell culture (left). Scale bar = 500 µm. Relative tumor spheres in cells treated with XL413, oxaliplatin, or combination (right). E) Colony formation assay in cells treated with CDC7 inhibitor (XL413), oxaliplatin, or combination. Cells were stained with crystal violet after 12 days. F) Representative image of PDO CC0117 treated with XL413, oxaliplatin, or combination after 16 days culture. Scale bar = 200 µm. G) The growth curve of tumor volume in vivo efficacy of oxaliplatin and CDC7 inhibitor (XL413) in DLD xenografts. Error bars represent ± SEM. H) Representative image of HE and IHC of Ki‐67 and cleaved‐caspase 3 in DLD1 xenograft tumors (left). Scale bar = 20 µm. Relative Ki‐67 expression and relative cleaved‐caspase 3 positive cells in four groups of DLD1 xenograft tumors (right). I) The growth curve of tumor volume in vivo efficacy of oxaliplatin and volasertib in PDX CC0117 model. J) Relative Ki‐67 expression in four groups of PDX CC0117 model. K) The growth curve of tumor volume in vivo efficacy of oxaliplatin and volasertib in PDX 07162 model. L) Relative Ki‐67 expression in four groups of PDX 07162 model. Data are representative of three independent experiments (A–E). *p < 0.05, **p < 0.01, ***p < 0.001, one‐way ANOVA with Dunnett's multiple comparisons test (B–D,H,J,L), and two‐way ANOVA with Dunnett's multiple comparisons test (G,I,K).
Figure 7
Figure 7
Schematic model illustrating the role of PLK1‐MYC‐CDC7 axis in mediating oxaliplatin resistance in CRC. Hyperactivity of PLK1‐MYC‐CDC7 axis was correlated with the resistance to oxaliplatin (left). Pharmacological inhibition of PLK1 dramatically suppressed CDC7 expression via MYC transactivation, resulting in sensitization to oxaliplatin treatment (right). Targeting PLK1‐MYC‐CDC7 axis could be an attractive therapeutic strategy to improve the clinical outcomes of oxaliplatin‐based chemotherapy in CRC.

References

    1. Bray F., Ferlay J., Soerjomataram I., Siegel R. L., Torre L. A., Jemal A., Ca‐Cancer J. Clin. 2018, 68, 394. - PubMed
    1. Pino M. S., Chung D. C., Gastroenterology 2010, 138, 2059. - PMC - PubMed
    1. Lee A. J., Endesfelder D., Rowan A. J., Walther A., Birkbak N. J., Futreal P. A., Downward J., Szallasi Z., Tomlinson I. P., Howell M., Kschischo M., Swanton C., Cancer Res. 2011, 71, 1858. - PMC - PubMed
    1. Gutteridge R. E., Ndiaye M. A., Liu X., Ahmad N., Mol. Cancer Ther. 2016, 15, 1427. - PMC - PubMed
    1. Spring L. M., Wander S. A., Andre F., Moy B., Turner N. C., Bardia A., Lancet 2020, 395, 817. - PubMed

Publication types

MeSH terms