. 2021 Dec 10;374(6573):eabj6641.
doi: 10.1126/science.abj6641. Epub 2021 Dec 10.

Mouse and human share conserved transcriptional programs for interneuron development

Affiliations

Mouse and human share conserved transcriptional programs for interneuron development

Yingchao Shi et al. Science. .

Abstract

Genetic variation confers susceptibility to neurodevelopmental disorders by affecting the development of specific cell types. Changes in cortical and striatal γ-aminobutyric acid–expressing (GABAergic) neurons are common in autism and schizophrenia. In this study, we used single-cell RNA sequencing to characterize the emergence of cell diversity in the human ganglionic eminences, the transitory structures of the human fetal brain where striatal and cortical GABAergic neurons are generated. We identified regional and temporal diversity among progenitor cells underlying the generation of a variety of projection neurons and interneurons. We found that these cells are specified within the human ganglionic eminences by transcriptional programs similar to those previously identified in rodents. Our findings reveal an evolutionarily conserved regulatory logic controlling the specification, migration, and differentiation of GABAergic neurons in the human telencephalon.


Conflict of interest statement

Competing interests: The authors declare no competing interests.

Figures

Fig. 1
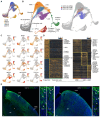
Fig. 1. Major sources of transcriptional heterogeneity among cells from the human ganglionic eminences.
(A) Clustering of individual cells from different gestational weeks by UMAP. (B) Annotation of cell clusters based on gene expression. The schema on the right illustrates the distribution of cells obtained from individual dissections of the MGE, LGE and CGE in relation to the unsupervised clustering of all cells. (C) Gene expression visualized by UMAP. Each dot represents an individual cell colored according to the expression level (red, high; grey, low). (D) Heatmaps illustrating differentially expressed genes (DEGs) enriched in progenitors and post-mitotic cells in the ganglionic eminences (left) and among post-mitotic cells in the MGE, LGE and CGE (right). (E) Expression of NTRK2 in progenitor cells in the ganglionic eminences at GW12. The areas in white boxes are shown at high magnification. Scale bars, 200 μm (LGE/MGE), 100 μm (CGE), 10 μm (boxes 1-3).
Fig. 2
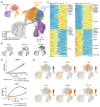
Fig. 2. Cell diversity and genetic regulation of progenitor cells in the human ganglionic eminences.
(A) Clustering of individual progenitor cells in the human ganglionic eminences (top left) and gene expression visualized by UMAP. Each dot represents an individual cell colored according to the expression level (red, high; grey, low). The developmental trajectory of progenitor cells is analyzed via pseudotime alignment (top right). The inset illustrates the ratio of RGCs and IPCs among ganglionic eminence progenitor cells through GW9-18. (B) Heatmap illustrating DEGs that distinguish between RGCs and IPCs in the human ganglionic eminences. (C) Gene expression patterns along pseudo-differentiation (x-axis) and pseudo-lamina (y-axis) coordinates. (D) Cell diversity among progenitor cells in the human ganglionic eminences visualized by t-SNE. The regional identity of progenitor cells was established according to their characteristic patterns of gene expression. (E) Differentially expressed genes among progenitor cells. The relationships among subclusters of GE progenitors is illustrated via dendrogram. The size of the dots and the color bar were scaled with the average expression of the corresponding genes. (F) Expression of SIX3 and Ki67 in the human LGE and MGE at GW12. The areas in white boxes are shown at high magnification. Scale bars, 200 μm (left), 20 μm (right). (G) Quantification of the cell ratio of SIX3+ cells in LGE, MGE and CGE cells at GW10, GW12 and GW16, respectively. Data are presented as means ± s.e.m. (n = 4 samples from 3 individual experiments, * p < 0.05, ** p < 0.01, *** p < 0.001, one-way ANOVA).
Fig. 3
Fig. 3. Transcriptional programs underlying the developmental divergence of human ganglionic eminence.
(A) The cells of human ganglionic eminences and developing cortical and hippocampal interneurons are integrated and visualized by UMAP with inferred trajectories. MGE-2 cells were excluded from this analysis. Potential differentiation trajectories are schematically depicted with arrows. The pseudotime of ganglionic eminence cells is visualized via UMAP (top left). (B) Cell distributions at different gestational stages are shown in dark gray. (C) Heatmaps illustrating genes linked to cell fate divergence at branch point 1 (left) and 2 (right). (D) The expression of NKX2-1 and NFIX diverged at branch point 1 and 2, respectively. (E) The expression profile of genes related to cell fate divergence at branch point 1 and 2 is visualized by UMAP. Each dot represents an individual cell colored according to the expression level (red, high; grey, low).
Fig. 4
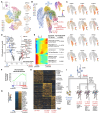
Fig. 4. Transcriptional regulation of LGE development.
(A) Unsupervised clustering of human LGE postmitotic cells and gene expression patterns visualized by t-SNE. Each dot represents an individual cell colored according to the expression level (red, high; grey, low). (B) Developmental trajectory of LGE cells visualized by UMAP. Pseudotime for individual cells is also shown (top right). (C) Gene expression profile along the developmental trajectories of LGE cells visualized via UMAP. (D) Volcano plot of DEGs for LGE cells with OB and striatal potential. (E) Heatmap illustrating the bifurcation of gene expression along the developmental trajectory of LGE cells committed to OB and striatal fates. (F and G) The neuropeptide signaling pathway is enriched in LGE cells with striatal potential. (H) Heatmap illustrating DEGs enriched in THSZ1+ D1 MSN, PDYN+ D1 MSNs and D2 MSNs. (I) Schematic of hypothetical genetic programs underlying the early diversification of human LGE cells.
Fig. 5
Fig. 5. Transcriptional control of early cell specification in the human MGE.
(A) Neuronal diversity of postmitotic cells in human MGE visualized via t-SNE. (B) Violin plots of DEGs among MGE clusters. (C) Developmental trajectory of MGE cells (including MGE progenitors and postmitotic cells) are inferred via monocle analysis and visualized by UMAP. Pseudotime of MGE cells in branch 1 and 2 is shown (top left). (D) Gene expression along the developmental trajectories of MGE cells is visualized via UMAP. MGE-2 cells comprise GABAergic and cholinergic subpallial neurons according to the expression of GAD2 and LHX8, respectively. Each dot represents an individual cell and colored according to the expression level (red, high; grey, low). (E) Schematic of hypothetical genetic programs underlying the early diversification of human MGE cells. The developmental trajectory linking pMGE to MGE-2 cells is uncertain (dotted line) due to the lack of related progenitor cells in our dataset. (F) Integration of postmitotic human MGE cells (M2 and M3) and LHX6+ adult human cortical interneurons is visualized by UMAP. MGE cells were annotated according to the classification of adult cortical interneurons based on transcriptional similarities. (G) Riverplot illustrating the relationship between MGE cell clusters and adult SST+ interneurons. The size of the bars of MGE cells is normalized to cell numbers. LRP, long-range projection neurons; MC, Martinotti cells; nMC, non-Martinotti cells.
Fig. 6
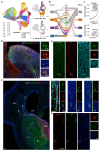
Fig. 6. Unique features of human ganglionic eminences.
(A) The datasets of human and mouse ganglionic eminence cells are integrated based on shared sources of variation and visualized via UMAP. (B) Riverplot illustrating relationships between human and mouse ganglionic eminence cell clusters. Two human-specific clusters (1 and 19) are highlighted by circles. (C) Specific gene expression in human-specific clusters 1 and 19. (D) Expression of SCGN and CR in the human CGE at GW12. The area in the white box is shown at high magnification. Scale bars, 100 µm (left), 20 µm (right). (E) Expression of SCGN, CR and GAD1 in the adult human cortex. The area in the white box is shown at high magnification. Scale bar, 100 µm (left), 10 µm (right). (F) Expression of CRABP1 and NKX2-1 in the embryonic human brain at GW16. The regions in the white boxes are shown at high magnification. The dotted lines illustrate potential migratory routes for CRABP1+ and NKX2-1+ cells. Scale bar, 500 µm (left), 50 µm (boxes 1-3, right), 10 µm (boxes 1-3, left). (G) Expression of CRABP1 and PVALB in the adult human cortex. The area in the white box is shown at high magnification.

References

    1. Herculano-Houzel S. The remarkable, yet not extraordinary, human brain as a scaled-up primate brain and its associated cost. Proc Natl Acad Sci U S A. 2012;109(Suppl 1):10661–10668. doi: 10.1073/pnas.1201895109. - DOI - PMC - PubMed
    1. Defelipe J. The evolution of the brain, the human nature of cortical circuits, and intellectual creativity. Front Neuroanat. 2011;5:29. doi: 10.3389/fnana.2011.00029. - DOI - PMC - PubMed
    1. DeFelipe J, Alonso-Nanclares L, Arellano JI. Microstructure of the neocortex: comparative aspects. J Neurocytol. 2002;31:299–316. - PubMed
    1. Boldog E, et al. Transcriptomic and morphophysiological evidence for a specialized human cortical GABAergic cell type. Nat Neurosci. 2018;21:1185–1195. doi: 10.1038/s41593-018-0205-2. - DOI - PMC - PubMed
    1. Oberheim NA, et al. Uniquely hominid features of adult human astrocytes. J Neurosci. 2009;29:3276–3287. doi: 10.1523/JNEUROSCI.4707-08.2009. - DOI - PMC - PubMed

Publication types

Substances