. 2021 Dec 10;374(6573):eabk0410.
doi: 10.1126/science.abk0410. Epub 2021 Dec 10.

PI(3,4)P2-mediated cytokinetic abscission prevents early senescence and cataract formation

Affiliations

PI(3,4)P2-mediated cytokinetic abscission prevents early senescence and cataract formation

Federico Gulluni et al. Science. .

Abstract

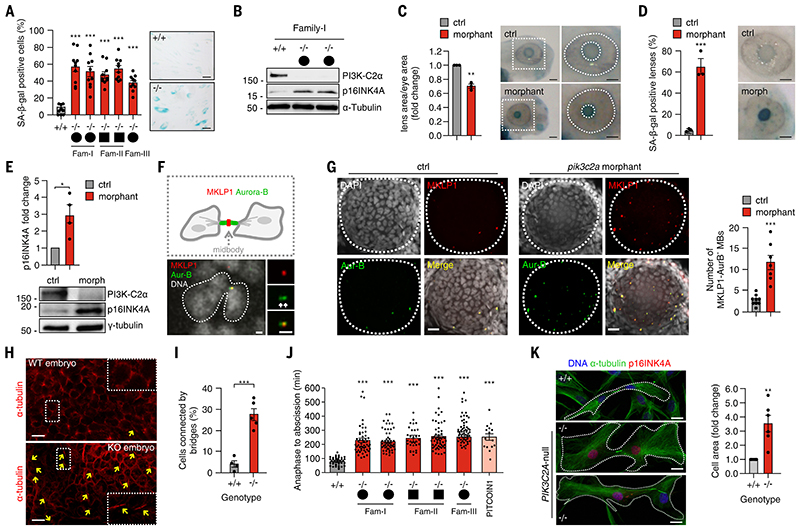
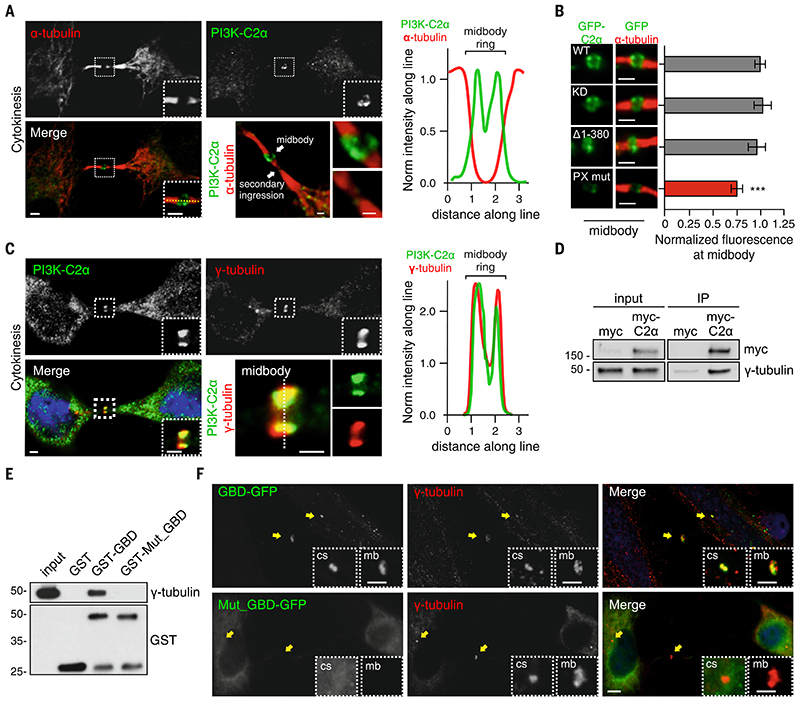
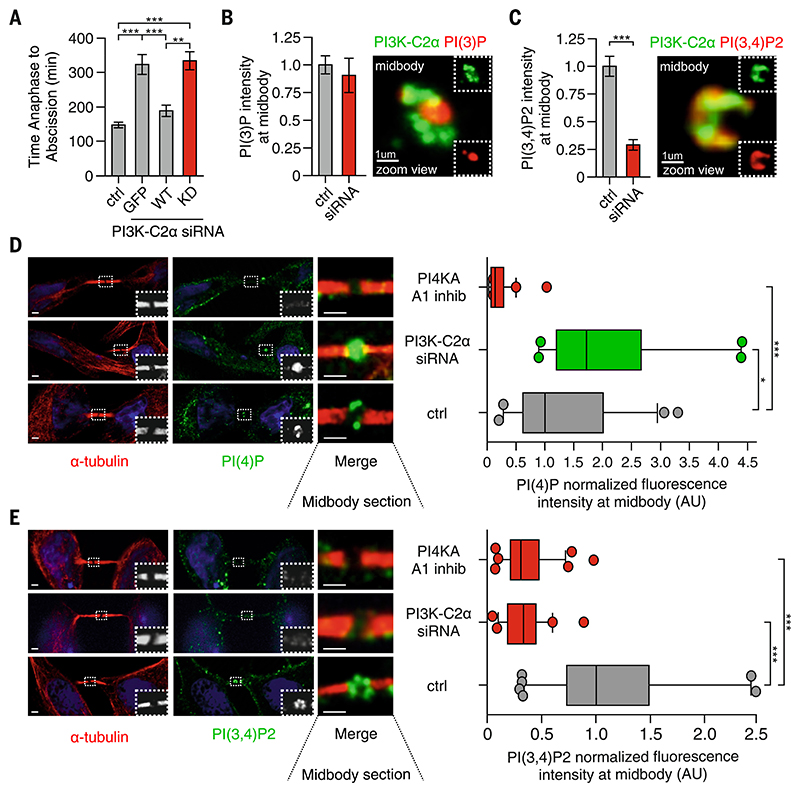
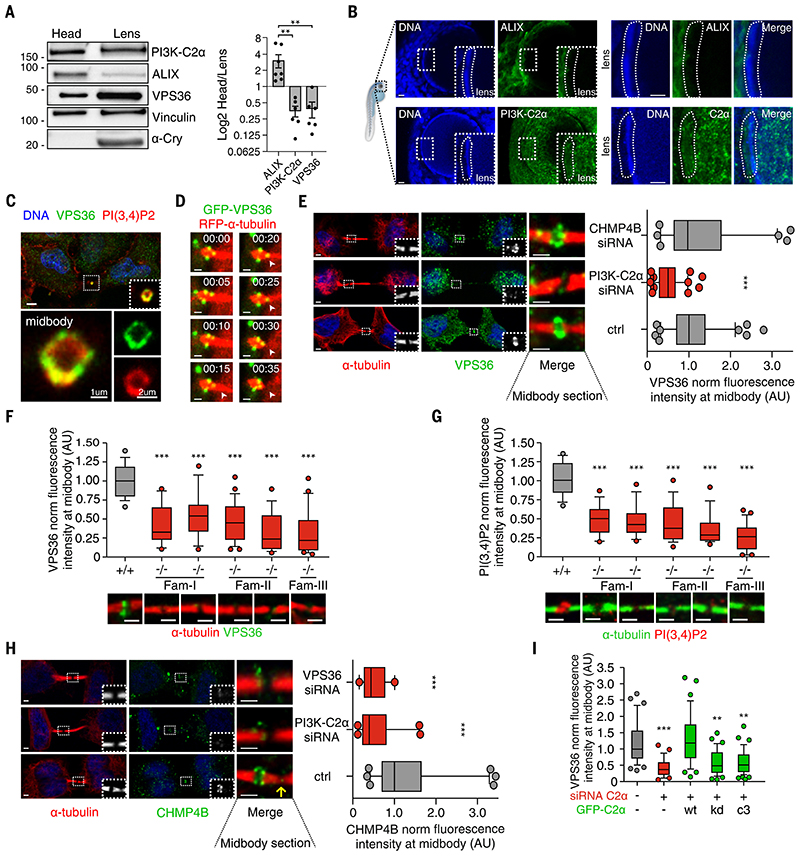
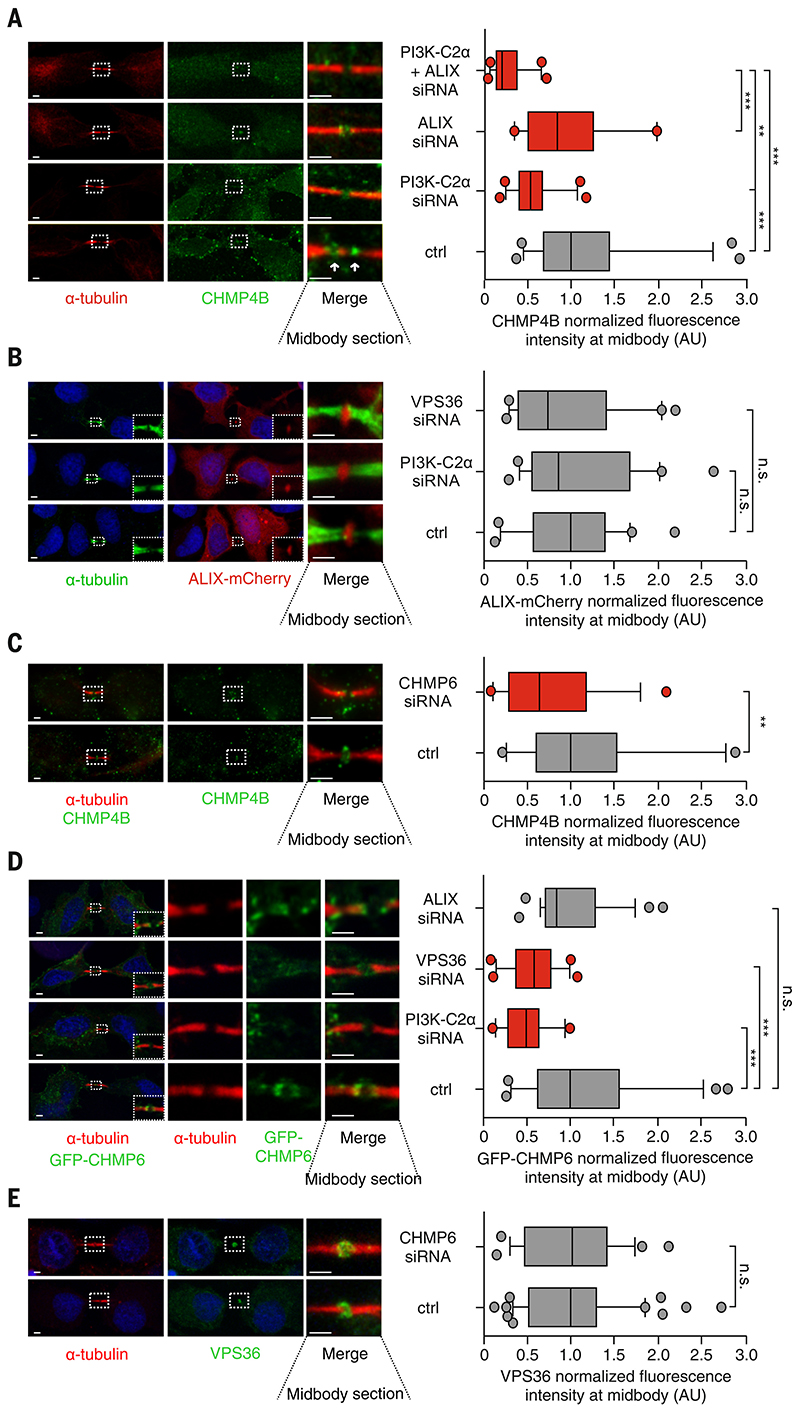
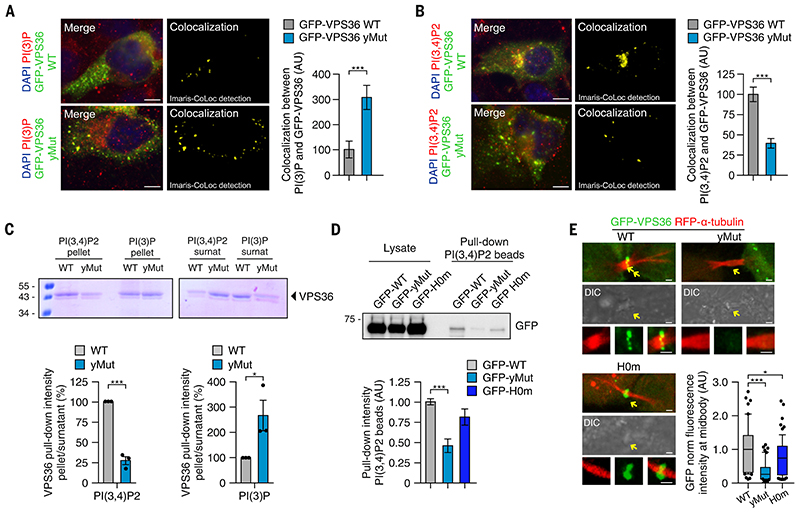
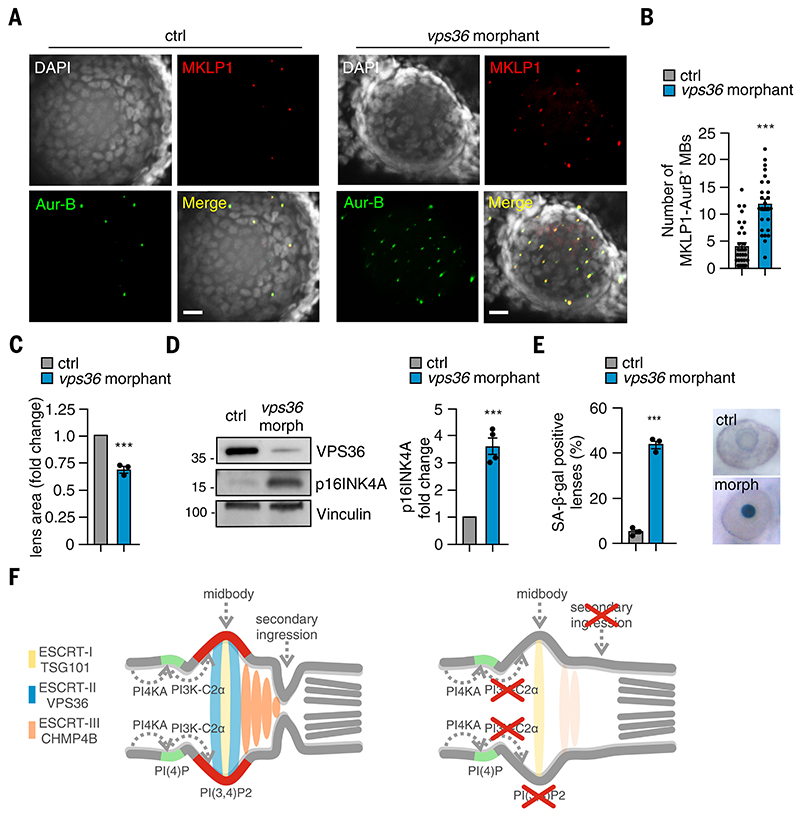
Cytokinetic membrane abscission is a spatially and temporally regulated process that requires ESCRT (endosomal sorting complexes required for transport)–dependent control of membrane remodeling at the midbody, a subcellular organelle that defines the cleavage site. Alteration of ESCRT function can lead to cataract, but the underlying mechanism and its relation to cytokinesis are unclear. We found a lens-specific cytokinetic process that required PI3K-C2α (phosphatidylinositol-4-phosphate 3-kinase catalytic subunit type 2α), its lipid product PI(3,4)P2 (phosphatidylinositol 3,4-bisphosphate), and the PI(3,4)P2–binding ESCRT-II subunit VPS36 (vacuolar protein-sorting-associated protein 36). Loss of each of these components led to impaired cytokinesis, triggering premature senescence in the lens of fish, mice, and humans. Thus, an evolutionarily conserved pathway underlies the cell type–specific control of cytokinesis that helps to prevent early onset cataract by protecting from senescence.


Figures

Figure 1
Figure 1. Loss of PI3K-C2α induces defective abscission and early senescence.
A) Quantification and representative images of SA-b-gal–positive fibroblasts derived from Family I, II, and III after 2 weeks in culture. +/+ genotypes are shown in the chart as pulled together. (B) Immunoblot analysis of p16INK4A protein level in fibroblasts derived from Family I after 2 weeks in culture. (C) Quantification and representative images of the ratio between lens and eye size in control and pik3c2a morphant 72 hours post-fertilization (hpf) zebrafish embryos. (D) Quantification and representative images of SA-b-gal intensity on the lens of control and pik3c2a morphant 72-hpf embryos. (E) Immunoblot analysis of p16INK4A and PI3K-C2α in control and pik3c2a morphant embryos (n = 4 pools of 15 embryos each). (F and G) Confocal images of whole-mount immunofluorescence performed on 72-hpf embryos lens using MKLP1 (red) and Aur-B (green) antibodies to stain midbody and TO-PRO-3 (gray) to stain nuclei. (H) Immunofluorescence of wild-type and Pik3c2a−/− embryo sections by using a-tubulin to mark intercellular bridges connecting cells in cytokinesis. (I) Quantification of the number of cells connected by bridges (%). n = 6 fields in at least four independent experiments. (J) Time-lapse analysis of the time required to progress from anaphase to cytokinesis in fibroblasts derived from patients with homozygous deletion of PI3K-C2α or in control fibroblasts treated with PITCOIN1. (K) (Left) Immunofluorescence of p16INK4A (red), DNA (blue), and a-tubulin (green) in wild-type and PI3K-C2α-null fibroblast. (Right) Quantification of cell area in control and PIK3C2A-null fibroblasts. If not previously specified, all results are shown as mean or representative picture of at least three independent experiments ± SEM. *P < 0.05; **P < 0.01; ***P < 0.001.
Figure 2
Figure 2. PI3K-C2α localizes to midbody through the PX- and the g-tubulin–binding domain.
A) Confocal images of HeLa cells stained for PI3K-C2α (green) and a-tubulin (red) (left) during cytokinesis and (right) fluorescence intensity along the line showing localization of PI3K-C2α at midbody. (B) Hela cells transfected with wild-type, kinase inactive (KD), clathrin-binding deletion (D1-380), and PX-binding mutant PI3K-C2α GFP-tagged. Immunofluorescence staining by using antibody to GFP showing (left) the enrichment of the different PI3K-C2α constructs and (right) their quantification at the midbody. (C) Confocal images of (left) HeLa cells stained for PI3K-C2α (green), 4′,6-diamidino-2-phenylindole (DAPI) (blue), and g-tubulin (red) and (right) fluorescence intensity along the line showing colocalization between PI3K-C2α and g-tubulin. (D) Immunoprecipitation of myc-PI3K-C2α from cells synchronized in cytokinesis. (E) Pull-down experiment by using GST-GBD and GST-GBDQ1022A-T1025A-S1081A from cells synchronized in cytokinesis. (F) Immunofluorescence staining of GFP-GBD and GFP-GBDQ1022A-T1025A-S1081A (green) with g-tubulin (red) during cytokinesis. Enlarged section shows colocalization with centrosome and midbody. If not previously specified, all results are shown as mean or representative picture of at least three independent experiments ± SEM. ***P < 0.001.
Figure 3
Figure 3. PI3K-C2α produces PI(3,4)P2 at the midbody ring.
(A) Time-lapse microscopy measuring the time required to progress from anaphase to abscission in HeLa cells treated with siRNA for PI3K-C2α alone or expressing GFP and siRNA-resistant GFP–wild-type (WT) or GFP-kinase inactive (KD) form of PI3K-C2α. n ≥ 25 cells imaged. (B) (Left) Quantification of PI(3)P levels at midbody by means of immunofluorescence staining (n ≥100 cells) and (right) confocal image of 3D reconstructed midbody stained for PI(3)P (red) and PI3K-C2α (green). (C) (Left) Quantification of PI(3,4)P2 levels at midbody by immunofluorescence staining (n ≥100 cells) and (right) confocal image of 3D reconstructed midbody stained for PI(3,4)P2 (red) and PI3K-C2α (green). (D) Quantification of PI(4)P levels at midbody in control, A1 inhibitor, and siRNA-treated cells. n ≥100 cells, mean ± SD. (E) Quantification of PI(3,4)P2 levels at midbody in control, A1 inhibitor, and siRNA-treated cells. n ≥100 cells, mean ± SD. If not previously specified, all results are shown as mean or representative picture of at least three independent experiments ± SEM. *P < 0.05; **P < 0.01; ***P < 0.001.
Figure 4
Figure 4. PI3K-C2α/VPS36 axis is an ALIX alternative pathway to recruit CHMP4B to the midbody in lens.
(A) Immunoblot analysis and protein quantification showing ALIX/PI3K-C2α expression ratio in zebrafish lens. (B) Immunofluorescence showing (top) ALIX or (bottom) PI3K-C2α expression in 72-hpf zebrafish lens. (C) Immunofluorescence staining showing colocalization between endogenous VPS36 and PI(3,4)P2 at the midbody ring. (D) Snapshots taken from time-lapse imaging of GFP-VPS36 during cytokinesis in HeLa cells stably expressing red fluorescent protein (RFP)–a-tubulin. Arrowheads indicate enrichment of VPS36 at the abscission site. (E) Quantification of VPS36 levels at midbody in control and siRNA-treated cells. n ≥ 200 cells, mean ± SD. (F and G) Immunofluorescence staining and quantification of endogenous (F) VPS36 and (G) PI(3,4)P2 levels at the midbody in fibroblasts derived from patients with homozygous deletion of PI3K-C2α. +/+ genotypes were pulled together. n ≥ 50 cells, mean ± SD. (H) Quantification of CHMP4B levels at midbody in control and siRNA-treated HeLa cells. n ≥ 120 cells, mean ± SD. (I) Quantification of VPS36 levels at midbody in control and siRNA treated cells upon transfection of siRNA-resistant WT, KD, and PI(3)P–producing (C3) forms of PI3K-C2α. n ≥ 30 cells, mean ± SD. If not previously specified, all results are shown as mean or representative picture of at least three independent experiments ± SEM. **P < 0.01; ***P < 0.001.
Figure 5
Figure 5. VPS36 recruits CHMP4B to the midbody through ALIX parallel pathway.
(A) Quantification of CHMP4B levels at midbody in HeLa cells treated with control siRNA or siRNA targeting PI3K-C2α, ALIX, or PI3K-C2α and ALIX. n ≥ 50 cells, mean ± SD. (B) Quantification of ALIX levels at midbody in HeLa cells transfected with ALIX-Cherry and treated with control or siRNA targeting PI3K-C2α or VPS36. n ≥ 60 cells, mean ± SD. (C) Quantification of CHMP4B levels at midbody in HeLa cells treated with control or siRNA targeting CHMP6. n ≥ 45 cells, mean ± SD. (D) Quantification of CHMP6 levels at midbody in HeLa cells transfected with GFP-CHMP6 and treated with control or siRNA targeting PI3K-C2α, VPS36, or ALIX. n ≥ 50 cells, mean ± SD. (E) Quantification of VPS36 levels at midbody in HeLa cells treated with control or siRNA targeting CHMP6. n ≥ 40 cells. If not previously specified, all results are shown as mean or representative picture of at least three independent experiments. (n.s. = not significant; **P < 0.01; ***P < 0.001).
Figure 6
Figure 6. PI(3,4)P2 is required for VPS36 recruitment to the midbody.
(A and B) (Left) Immunofluorescence and (right) quantification by using Imaris software of the colocalization between GFP-VPS36 WT or GFP-VPS36-yMut with either (A) PI(3)P or (B) PI(3,4)P2. (C) Lipid sedimentation assay showing binding of WT and yMut VPS36 to PI(3,4)P2 and PI(3)P. (D) Pull-down experiment by using PI(3,4)P2–coated beads and lysates from cells expressing WT, yMut, or H0m VPS36. (E) Time-lapse of HeLa cells stably expressing RFP–a-tubulin, showing localization of WT, H0m, or yMut VPS36 enrichment at the midbody during abscission. Quantification reports the average fluorescence intensity observed in n ≥ 60 cells and normalized on total GFP fluorescence inside each cell (mean ± SD). If not previously specified, all results are shown as mean or representative picture of at least three independent experiments ± SEM. *P < 0.05; ***P < 0.001.
Figure 7
Figure 7. Loss of VPS36 impairs abscission and leads to senescence in vitro and in vivo.
(A) Confocal images of whole-mount immunofluorescence performed on 72-hpf embryos lens by using MKLP1 (red) and Aur-B (green) antibodies to stain midbody and TO-PRO-3 (gray) to stain nuclei. (B) Quantification of number of MKLP1 and Aur-B–positive midbody in 72-hpf embryos lens. (C) Measure of lens area in control and vps36 morphants. (D) Immunoblot analysis and quantification of p16INK4A in control and vps36 morphant 72-hpf embryos. n = 4 pools of 15 embryos each. (E) Quantification and representative images of SA-b-gal intensity on the lens of control and morphant (vps36) 72-hpf embryos. (F) During cytokinesis, PI3K-C2α produced PI(3,4)P2 (red) at the midbody by converting PI(4)P (light blue) synthetized by PI4KA. PI(3,4)P2 triggers the recruitment and the stabilization of the ESCRT-II subunits VPS36 (green), which in turn contributed to the accumulation of ESCRT-III CHMP4B at the midbody. When PI3K-C2α is lost, the secondary ingression where abscission occurs does not form properly, resulting in impaired abscission. This leads to defective cytokinesis and early onset of senescence, which is particularly evident in the lens epithelium. If not previously specified, all results are shown as mean or representative picture of at least three independent experiments ± SEM. ***P < 0.001.

Comment in

References

    1. Gulluni F, Martini M, Hirsch E. Cytokinetic abscission: Phosphoinositides and ESCRTs direct the final cut. J Cell Biochem. 2017;118:3561–3568. - PubMed
    1. Schmidt O, Teis D. The ESCRT machinery. Curr Biol. 2012;22:R116–R120. - PMC - PubMed
    1. Adell MAY, Teis D. Assembly and disassembly of the ESCRT-III membrane scission complex. FEBS Lett. 2011;585:3191–3196. - PMC - PubMed
    1. Carlton JG, Agromayor M, Martin-Serrano J. Differential requirements for Alix and ESCRT-III in cytokinesis and HIV-1 release. Proc Natl Acad Sci USA. 2008;105:10541–10546. - PMC - PubMed
    1. Bhutta MS, McInerny CJ, Gould GW. ESCRT function in cytokinesis: Location, dynamics and regulation by mitotic kinases. Int J Mol Sci. 2014;15:21723–21739. - PMC - PubMed

Publication types

MeSH terms