Randomized Controlled Trial
. 2022 Feb 1;132(3):e151239.
doi: 10.1172/JCI151239.

Randomized trial of neoadjuvant vaccination with tumor-cell lysate induces T cell response in low-grade gliomas

Affiliations
Randomized Controlled Trial

Randomized trial of neoadjuvant vaccination with tumor-cell lysate induces T cell response in low-grade gliomas

Hirokazu Ogino et al. J Clin Invest. .

Abstract

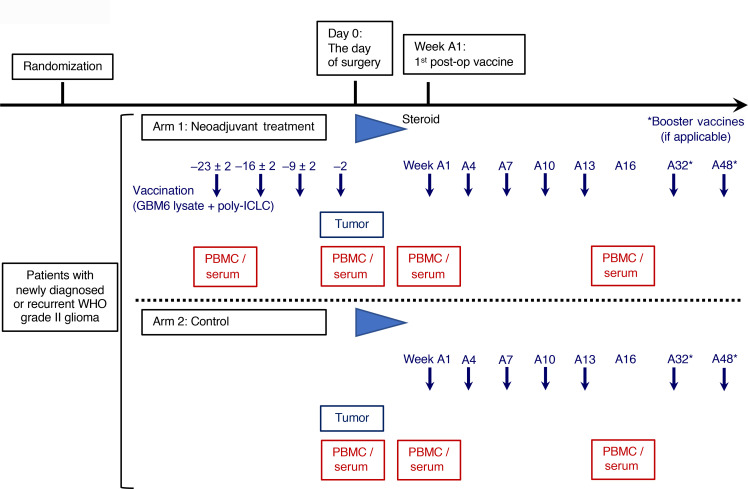
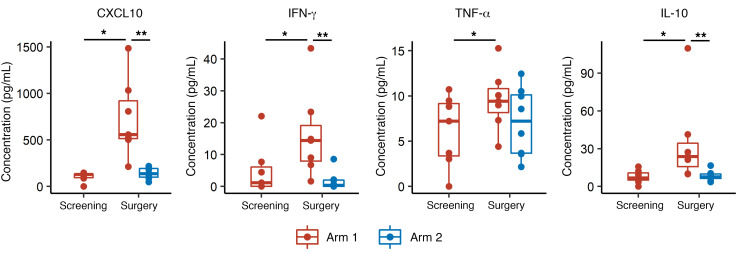
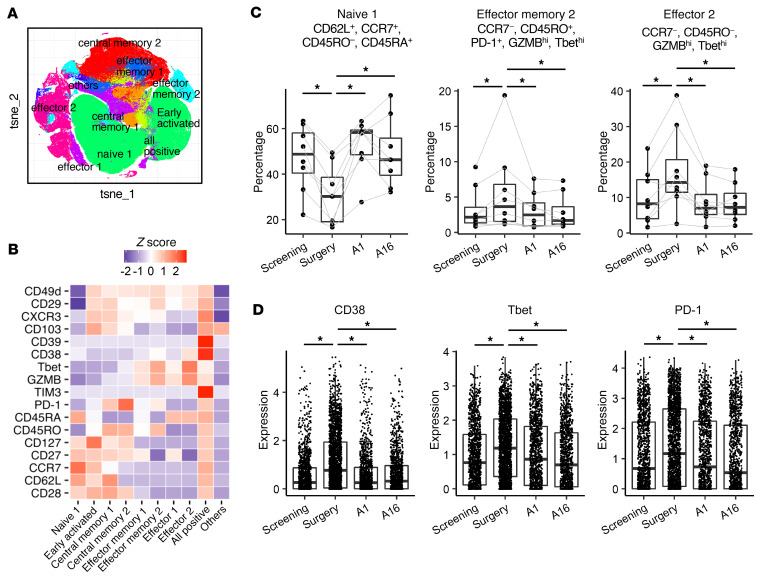
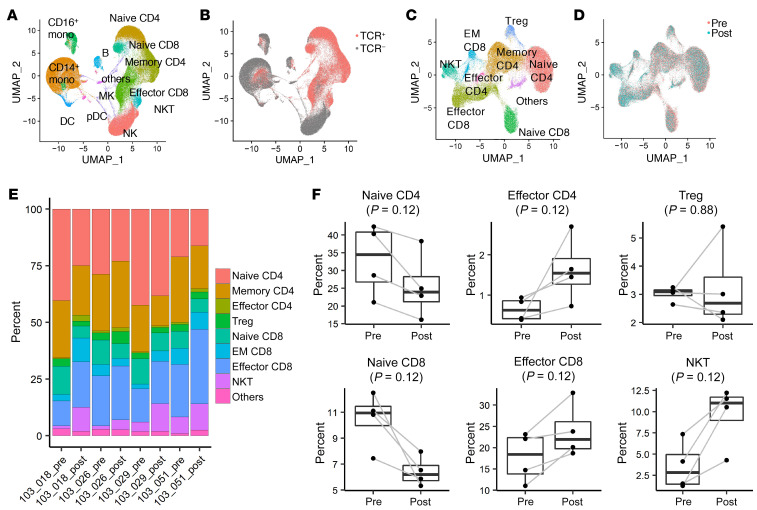
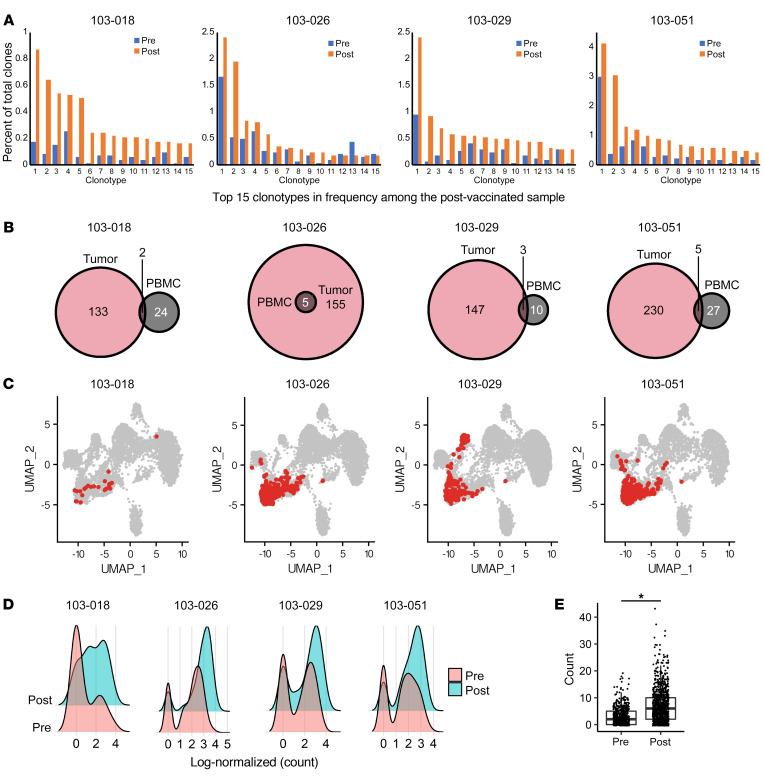
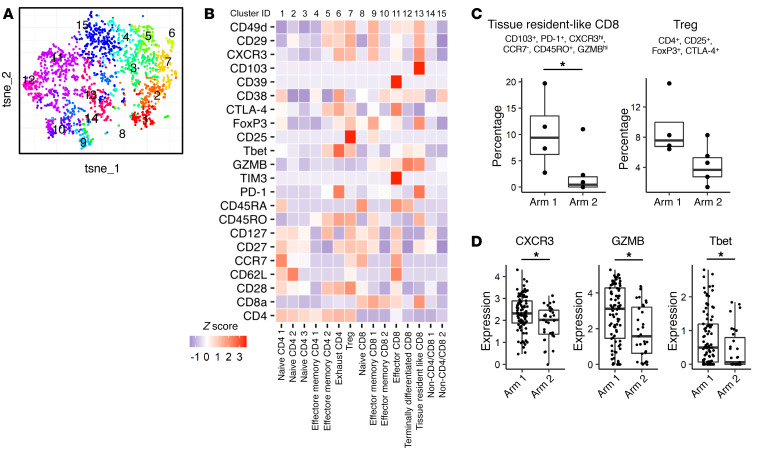
BACKGROUNDLong-term prognosis of WHO grade II low-grade gliomas (LGGs) is poor, with a high risk of recurrence and malignant transformation into high-grade gliomas. Given the relatively intact immune system of patients with LGGs and the slow tumor growth rate, vaccines are an attractive treatment strategy.METHODSWe conducted a pilot study to evaluate the safety and immunological effects of vaccination with GBM6-AD, lysate of an allogeneic glioblastoma stem cell line, with poly-ICLC in patients with LGGs. Patients were randomized to receive the vaccines before surgery (arm 1) or not (arm 2) and all patients received adjuvant vaccines. Coprimary outcomes were to evaluate safety and immune response in the tumor.RESULTSA total of 17 eligible patients were enrolled - 9 in arm 1 and 8 in arm 2. This regimen was well tolerated with no regimen-limiting toxicity. Neoadjuvant vaccination induced upregulation of type-1 cytokines and chemokines and increased activated CD8+ T cells in peripheral blood. Single-cell RNA/T cell receptor sequencing detected CD8+ T cell clones that expanded with effector phenotype and migrated into the tumor microenvironment (TME) in response to neoadjuvant vaccination. Mass cytometric analyses detected increased tissue resident-like CD8+ T cells with effector memory phenotype in the TME after the neoadjuvant vaccination.CONCLUSIONThe regimen induced effector CD8+ T cell response in peripheral blood and enabled vaccine-reactive CD8+ T cells to migrate into the TME. Further refinements of the regimen may have to be integrated into future strategies.TRIAL REGISTRATIONClinicalTrials.gov NCT02549833.FUNDINGNIH (1R35NS105068, 1R21CA233856), Dabbiere Foundation, Parker Institute for Cancer Immunotherapy, and Daiichi Sankyo Foundation of Life Science.

Keywords: Brain cancer; Cancer immunotherapy; Oncology; T cells; Vaccines.


Figures

Figure 1
Figure 1. Study schema.
Patients were randomized to arm 1 or 2. Patients in arm 1 received GBM6-AD lysate and poly-ICLC on days –23 ± 2, –16 ± 2, –9 ± 2, and –2 relative to the scheduled surgery. At least 2 weeks after the postoperative steroid was tapered, but within 10 weeks after surgery, patients in arm 1 and arm 2 started receiving the GBM6-AD/poly-ICLC vaccines every 3 weeks for 5 doses (weeks A1, A4, A7, A10, and A13; defined as the weeks from first adjuvant vaccine dose) followed by booster vaccines at weeks A32 and A48.
Figure 2
Figure 2. Neoadjuvant vaccinations with GBM6-AD lysate and poly-ICLC induced the upregulation of type-1 chemokines and cytokines in peripheral blood.
Serum concentrations of multiple chemokines and cytokines were measured by Luminex multiplex assay. The type-1 chemokine CXCL10 was elevated in arm 1 samples on the day of surgery, within 48 hours of the last neoadjuvant vaccination. Effector cytokines, such as IFN-γ, TNF-α, and IL-10, also demonstrated significant upregulation after the neoadjuvant vaccines. *P < 0.05 (calculated by paired Wilcoxon test) and **P < 0.05 (calculated by nonpaired Wilcoxon test).
Figure 3
Figure 3. Mass cytometric analyses detected increases of PD-1+GZMBhiTbethi effector memory and GZMBhiTbethi effector CD8+ T cells after the neoadjuvant vaccines.
(A) T-distributed stochastic neighbor embedding (t-SNE) plot of CD8+ T cells. To evaluate the vaccine-induced changes of phenotype in peripheral blood, mass cytometric analyses were conducted. CD8+ T cells were subjected to dimension reductional algorithm t-SNE for visualization in 2D space and clustered by FlowSOM based on the expression status of 7 differentiation markers (CD62L, CD27, CD127, CCR7, CD45RO, CD45RA, and PD-1). (B) Heatmap visualizing the relative expression (z score) of T cell–relevant markers in each subpopulation. Each cluster was annotated based on the expression status of differentiation markers as listed above. (C) The longitudinal analyses of proportions of each subpopulation in arm 1 patients. Neoadjuvant vaccination with GBM6-AD and poly-ICLC increased PD-1+GZMBhiTbethi effector memory and GZMBhiTbethi effector CD8+ T cells while decreasing naive CD8+ T cells. *P < 0.05 (paired Wilcoxon test). (D) The expression levels of activation markers, such as CD38, Tbet, and PD-1, on the PD-1+GZMBhiTbethi effector memory cells were enhanced in the samples obtained after the neoadjuvant vaccines. *P < 0.05 (nonpaired, 2-tailed t test).
Figure 4
Figure 4. scRNA-Seq analyses revealed the increases of effector CD4+ and CD8+ and decreases of naive CD4+ and CD8+ T cell populations after the neoadjuvant vaccinations.
ScRNA-Seq and scTCR-Seq analyses on the 10x Genomics platform were conducted in PBMCs obtained from the 4 immunological responders (patients 103-018, -26, -29, -51) at baseline and after neoadjuvant vaccines. (A) UMAP of pooled PBMCs from all 4 patients at baseline and after neoadjuvant vaccines. Clusters were annotated based on the expression of known marker genes. Mono, monocyte; pDC, plasmacytoid DC; MK, megakaryocyte; B, B cells. (B) UMAP was colored by TCR detection. TCRs were mainly detected in 5 clusters that represent T cell and NKT cell populations (pink). (C) UMAP of T cells and NKT cells. T cell and NKT cell populations were reclustered and grouped into 9 subpopulations. EM, effector memory. (D) UMAP of T cells and NKT cells was colored by treatment status (either pre- or post-vaccination). Cytotoxic T cells, such as effector CD8+ T cells and NKT cells, were enriched in postvaccinated samples (light blue). (E) The bar plot showing the proportion of each cell cluster in each sample. (F) Quantification of each cell cluster in prevaccinated and postvaccinated samples. The proportion of effector T cells showed a trend toward an increase in postvaccinated samples while that of naive T cells showed a trend toward a decrease. P values were calculated by paired Wilcoxon test.
Figure 5
Figure 5. Vaccine-reactive CD8+ T cell clones with an effector phenotype migrated into the tumor microenvironment.
(A) The top 15 frequent clonotypes in postvaccinated samples were extracted, and their frequencies were compared. Most of these clonotypes showed higher frequencies in postvaccinated samples than at baseline. (B) The TCR clonotypes that were enriched in postvaccinated PBMCs were extracted with an adjusted P value less than 0.15. Patients 103-018, -26, -29, and -51 were found to have 26, 5, 13, and 32 enriched TCR-b clonotypes, respectively, in their PBMCs. Some of these clonotypes were also found in the TCR repertoire of corresponding tumors (determined by bulk TCR-Seq). (C) The T cell clones that had these overlapped clonotypes mostly belonged to the effector CD8 cluster in PBMCs in all cases. (D and E) The expression of GZMB was upregulated by neoadjuvant vaccinations in these T cell clones. Log-normalized (count) on x axis was calculated as log (count/[total count of the cell] × 10,000 + 1). *P < 0.05 (nonpaired, 2-tailed t test).
Figure 6
Figure 6. The proportion of tissue resident–like CD8+ T cells with effector memory phenotype was significantly higher in the vaccinated tumor microenvironment.
Single-cell suspensions dissociated from tumor samples from arm 1 (4 cases) and arm 2 (6 cases) were analyzed by mass cytometry. (A) CD3+ T cells were subjected to dimension reductional algorithm t-SNE and clustered by FlowSOM based on the expression status of 10 differentiation markers (CD4, CD8a, CD62L, CD27, CD127, CCR7, CD45RO, CD45RA, CD25, and PD-1). (B) Heatmap visualizing the relative expression (z score) of T cell–relevant markers in each subpopulation. Each cluster was annotated based on the expression status of differentiation markers as listed above. (C) The proportion of tissue resident–like CD8+ T cells with effector memory phenotype (CD103+, PD-1+, CXCR3hi, CCR7, CD45RO+, GZMBhi) was significantly higher in arm 1 samples. *P < 0.05 (nonpaired Wilcoxon test). The proportion of Tregs in arm 1 showed a trend toward a higher percentage than arm 2 but without statistical significance. (D) TILs in this tissue resident–like CD8+ T cell cluster in arm 1 tumors demonstrated significantly higher expression levels for the CXCL10 receptor CXCR3, GZMB, and Tbet than those in arm 2 tumors.

References

    1. Ostrom QT, et al. CBTRUS statistical report: primary brain and other central nervous system tumors diagnosed in the United States in 2013-2017. Neuro Oncol. 2020;22(12 suppl 2):iv1–iv96. - PMC - PubMed
    1. Louis DN, et al. The 2016 World Health Organization classification of tumors of the central nervous system: a summary. Acta Neuropathol. 2016;131(6):803–820. doi: 10.1007/s00401-016-1545-1. - DOI - PubMed
    1. Sanai N, et al. Low-grade gliomas in adults. J Neurosurg. 2011;115(5):948–965. doi: 10.3171/2011.7.JNS101238. - DOI - PubMed
    1. Brown PD, et al. Clinical Radiation Oncology. Churchill-Livingstone; 2006:493–514.
    1. van den Bent MJ, et al. Long-term efficacy of early versus delayed radiotherapy for low-grade astrocytoma and oligodendroglioma in adults: the EORTC 22845 randomised trial. Lancet. 2005;366(9490):985–990. doi: 10.1016/S0140-6736(05)67070-5. - DOI - PubMed

Publication types

MeSH terms

Associated data

LinkOut - more resources