. 2021 Dec 9;15(12):e0009773.
doi: 10.1371/journal.pntd.0009773. eCollection 2021 Dec.

The impact of climate suitability, urbanisation, and connectivity on the expansion of dengue in 21st century Brazil

Affiliations

The impact of climate suitability, urbanisation, and connectivity on the expansion of dengue in 21st century Brazil

Sophie A Lee et al. PLoS Negl Trop Dis. .

Abstract

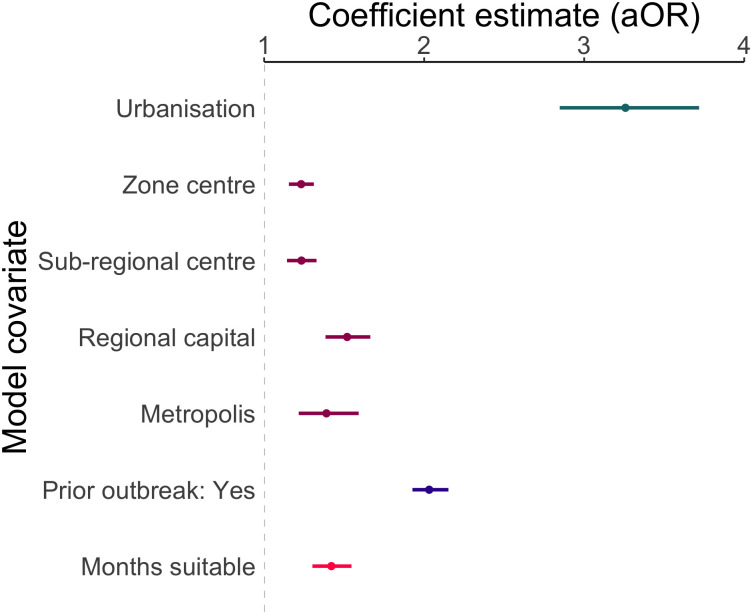
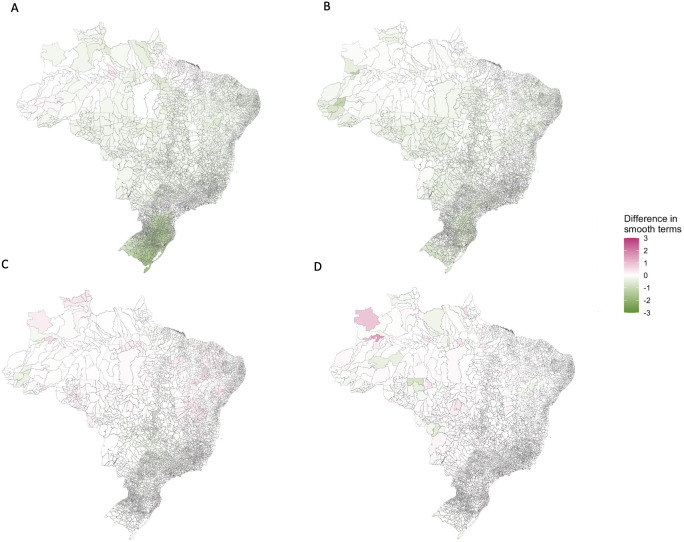
Dengue is hyperendemic in Brazil, with outbreaks affecting all regions. Previous studies identified geographical barriers to dengue transmission in Brazil, beyond which certain areas, such as South Brazil and the Amazon rainforest, were relatively protected from outbreaks. Recent data shows these barriers are being eroded. In this study, we explore the drivers of this expansion and identify the current limits to the dengue transmission zone. We used a spatio-temporal additive model to explore the associations between dengue outbreaks and temperature suitability, urbanisation, and connectivity to the Brazilian urban network. The model was applied to a binary outbreak indicator, assuming the official threshold value of 300 cases per 100,000 residents, for Brazil's municipalities between 2001 and 2020. We found a nonlinear relationship between higher levels of connectivity to the Brazilian urban network and the odds of an outbreak, with lower odds in metropoles compared to regional capitals. The number of months per year with suitable temperature conditions for Aedes mosquitoes was positively associated with the dengue outbreak occurrence. Temperature suitability explained most interannual and spatial variation in South Brazil, confirming this geographical barrier is influenced by lower seasonal temperatures. Municipalities that had experienced an outbreak previously had double the odds of subsequent outbreaks. We identified geographical barriers to dengue transmission in South Brazil, western Amazon, and along the northern coast of Brazil. Although a southern barrier still exists, it has shifted south, and the Amazon no longer has a clear boundary. Few areas of Brazil remain protected from dengue outbreaks. Communities living on the edge of previous barriers are particularly susceptible to future outbreaks as they lack immunity. Control strategies should target regions at risk of future outbreaks as well as those currently within the dengue transmission zone.


Conflict of interest statement

The authors have declared that no competing interests exist.

Figures

Fig 1
Fig 1. The difference between the average number of months with suitable temperatures for dengue transmission in 2001–2010 and 2011–2020.
The number of months with temperatures between 16.2°C and 34.5°C has increased on average (shown in pink) in parts of South and Southeast Brazil which were previously considered ‘protected’ from dengue transmission. Maps were produced in R using the geobr package [32,35] (https://ipeagit.github.io/geobr/).
Fig 2
Fig 2. The level of influence of cities within the Brazilian urban network from REGIC 2018.
The Amazon region is far less connected to the urban network than the rest of the country. As there is only one metropolis in North Brazil (Manaus), people often travel great distances, far greater than in other regions, to reach cities. Maps were produced in R using the geobr package [32,35] (https://ipeagit.github.io/geobr/).
Fig 3
Fig 3. Monthly incidence rate per 100,000 residents in regions of Brazil 2001–2020.
Incidence rates have increased in every region of the country between 2001–2020. The first regional outbreak occurred in 2010, outbreaks have occurred more frequently and in more regions since then. Maps were produced in R using the geobr package [32,35] (https://ipeagit.github.io/geobr/).
Fig 4
Fig 4. The first year each municipality experienced an outbreak for the first time in the period 2001–2010 and 2001–2020.
The year each municipality first recorded over 300 cases per 100,000 residents. Recent data shows the previous barriers to dengue outbreaks in the Amazon and South are being eroded. Maps were produced in R using the geobr package [32,35] (https://ipeagit.github.io/geobr/).
Fig 5
Fig 5. The number of years each municipality experienced an outbreak between 2001 and 2020.
Municipalities that experienced outbreaks earlier in the 21st century continued to experience outbreaks throughout the period. This suggests that once dengue is introduced to a region, it becomes established. Maps were produced in R using the geobr package [32,35] (https://ipeagit.github.io/geobr/).
Fig 6
Fig 6. The mean and 95% credible interval of the posterior distribution for each model covariate.
Results show that municipalities with a higher proportion of residents living in urban areas, in cities with a higher connectivity than local centres, with a higher number of month per year suitable for dengue transmission, which had previously experienced an outbreak have significantly higher odds of an outbreak.
Fig 7
Fig 7. Temporal (a) and spatial (b) smooth functions from the final model transformed to show the change in odds.
The odds of an outbreak has increased over the period due to unexplained factors not included in the model. The spatial random field highlights that more information is needed in the model to understand the explosive outbreaks that have taken place in Rio Branco, Acre and the Centre-West region as these hotspots are not fully explained by the model covariates. Pink (green) regions of the map represent areas where the odds of an outbreak was higher (lower) on average than estimated by the covariates. Maps were produced in R using the geobr package [32,35] (https://ipeagit.github.io/geobr/).
Fig 8
Fig 8. The median difference between absolute values of the smooth function estimates calculated from the full model and from a baseline model.
A reduction in the absolute smooth functions (shown in green) indicates that the estimates have shrunk towards zero when the covariates were added to the model and these covariates are explaining some of the variability in the data. Maps were produced in R using the geobr package [32,35] (https://ipeagit.github.io/geobr/).
Fig 9
Fig 9. The median difference between absolute values of the smooth function estimates calculated from the baseline model and models with a) the climate suitability covariate added, b) the prior outbreak indicator added, c) the proportion of urbanisation added, and d) the level of connectivity covariate added.
A reduction in the absolute estimates of the smooth functions (shown in green here) indicates that the functions have shrunk towards zero and the covariate has explained variation in the data. Maps were produced in R using the geobr package [32,35] (https://ipeagit.github.io/geobr/).
Fig 10
Fig 10. The average probability of an outbreak 2001–2010 and 2011–2020 in a) Brazil, b) Acre and Amazonas, and c) South Brazil.
The probability of an outbreak estimated using simulations from the posterior distribution of the response from the final model, averaged over the first and second decade of the time period. The probability of an outbreak has increased across most of Brazil. The Amazonian barrier has almost completely been eroded and the South Brazil border has moved further south. Maps were produced in R using the geobr package [32,35] (https://ipeagit.github.io/geobr/).
Fig 11
Fig 11. Geographical barriers to dengue transmission in a) 2001–2010 and b) 2011–2020.
Maps showing areas where the probability of an outbreak was less than 10% on average in each decade of the 21st century. Between 2011–2020, only the 2 most southern states and the northern coast were fully protected from dengue transmission. Maps were produced in R using the geobr package [32,35] (https://ipeagit.github.io/geobr/).

References

    1. Ten health issues WHO will tackle this year. [cited 10 Jun 2021]. https://www.who.int/news-room/spotlight/ten-threats-to-global-health-in-...
    1. Wilder-Smith A, Gubler DJ, Weaver SC, Monath TP, Heymann DL, Scott TW. Epidemic arboviral diseases: priorities for research and public health. Lancet Infect Dis. 2017;17: e101–e106. doi: 10.1016/S1473-3099(16)30518-7 - DOI - PubMed
    1. Stanaway JD, Shepard DS, Undurraga EA, Halasa YA, Coffeng LE, Brady OJ, et al. The global burden of dengue: an analysis from the Global Burden of Disease Study 2013. Lancet Infect Dis. 2016;16: 712–723. doi: 10.1016/S1473-3099(16)00026-8 - DOI - PMC - PubMed
    1. Gubler DJ. Dengue, Urbanization and Globalization: The Unholy Trinity of the 21st Century. Trop Med Health. 2011;39: 3–11. doi: 10.2149/tmh.2011-S05 - DOI - PMC - PubMed
    1. Fares RCG, Souza KPR, Añez G, Rios M. Epidemiological Scenario of Dengue in Brazil. BioMed Res Int. 2015;2015: e321873. doi: 10.1155/2015/321873 - DOI - PMC - PubMed