. 2021 Dec 9;16(12):e0260857.
doi: 10.1371/journal.pone.0260857. eCollection 2021.

Genome-wide host methylation profiling of anal and cervical carcinoma

Affiliations

Genome-wide host methylation profiling of anal and cervical carcinoma

Erin M Siegel et al. PLoS One. .

Abstract

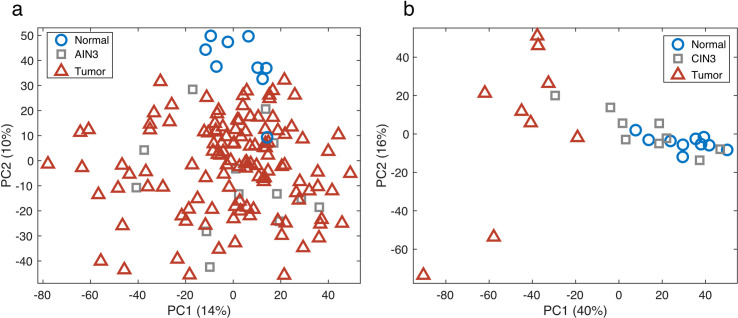
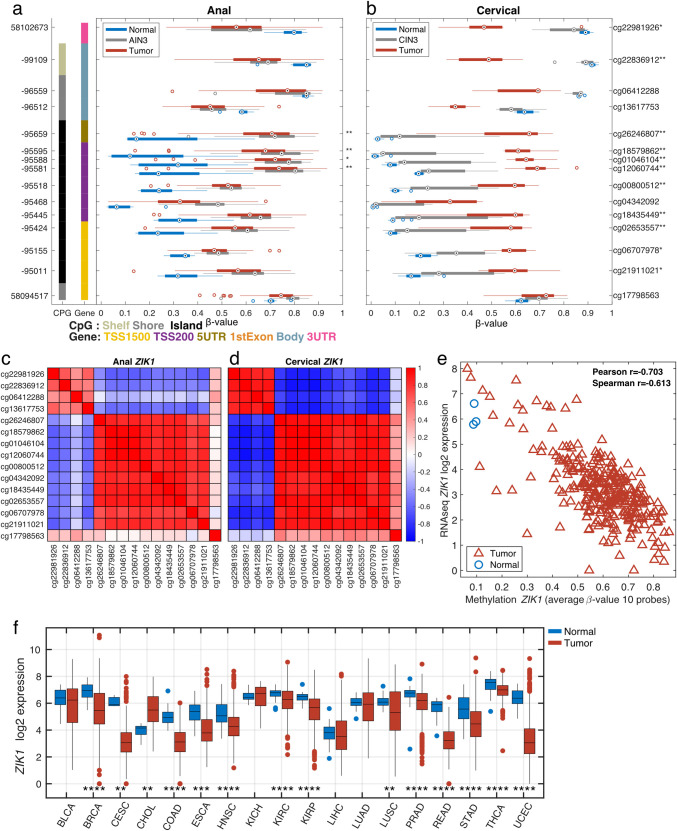
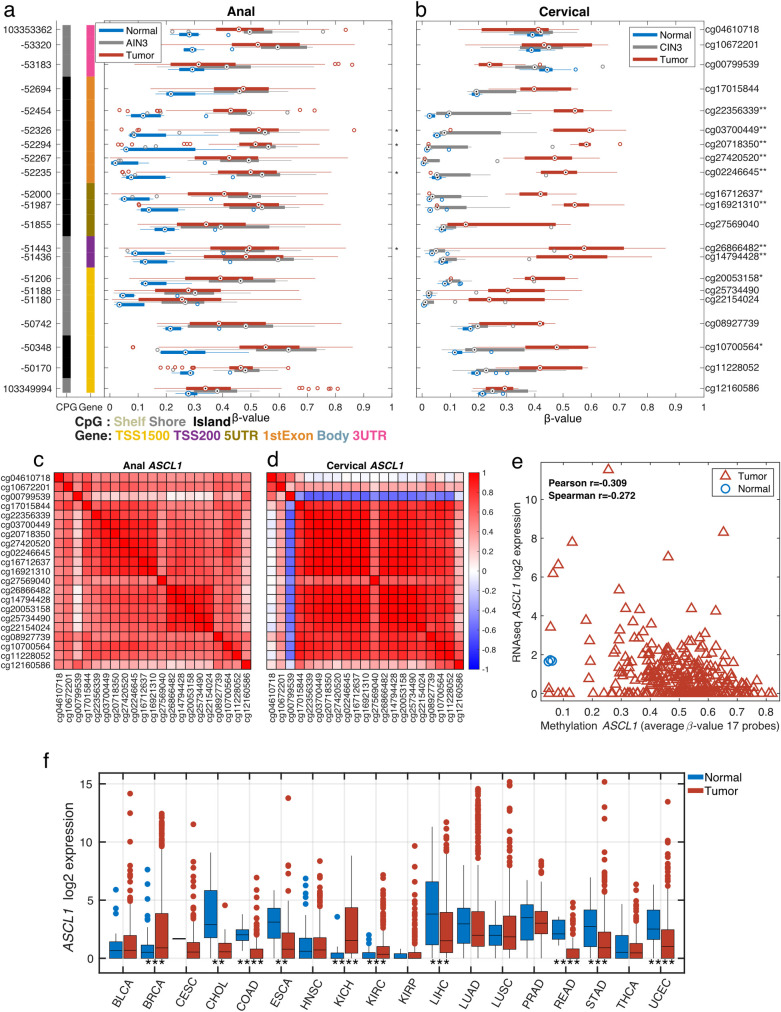
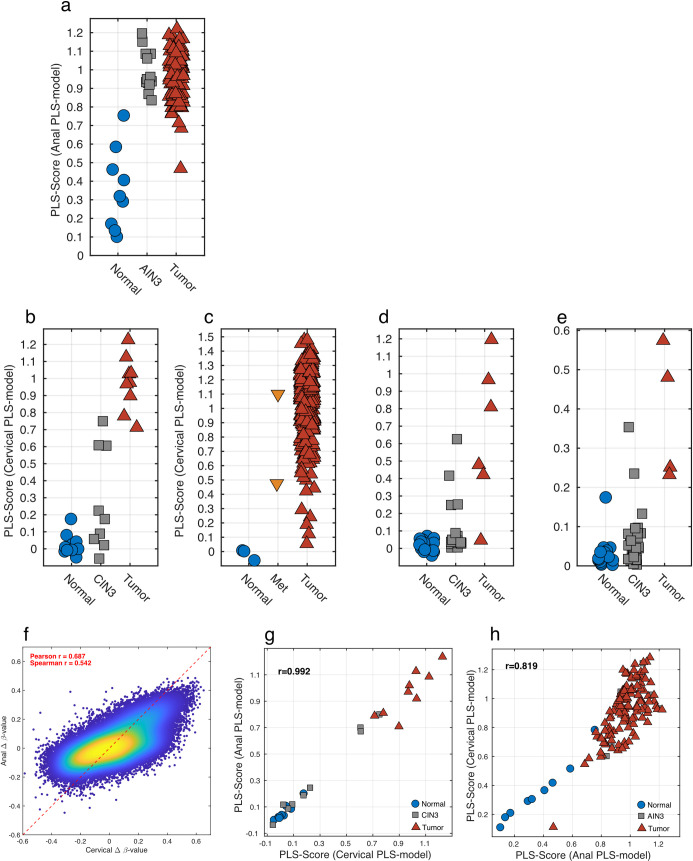
HPV infection results in changes in host gene methylation which, in turn, are thought to contribute to the neoplastic progression of HPV-associated cancers. The objective of this study was to identify joint and disease-specific genome-wide methylation changes in anal and cervical cancer as well as changes in high-grade pre-neoplastic lesions. Formalin-fixed paraffin-embedded (FFPE) anal tissues (n = 143; 99% HPV+) and fresh frozen cervical tissues (n = 28; 100% HPV+) underwent microdissection, DNA extraction, HPV genotyping, bisulfite modification, DNA restoration (FFPE) and analysis by the Illumina HumanMethylation450 Array. Differentially methylated regions (DMR; t test q<0.01, 3 consecutive significant CpG probes and mean Δβ methylation value>0.3) were compared between normal and cancer specimens in partial least squares (PLS) models and then used to classify anal or cervical intraepithelial neoplasia-3 (AIN3/CIN3). In AC, an 84-gene PLS signature (355 significant probes) differentiated normal anal mucosa (NM; n = 9) from AC (n = 121) while a 36-gene PLS signature (173 significant probes) differentiated normal cervical epithelium (n = 10) from CC (n = 9). The CC progression signature was validated using three independent publicly available datasets (n = 424 cases). The AC and CC progression PLS signatures were interchangeable in segregating normal, AIN3/CIN3 and AC and CC and were found to include 17 common overlapping hypermethylated genes. Moreover, these signatures segregated AIN3/CIN3 lesions similarly into cancer-like and normal-like categories. Distinct methylation changes occur across the genome during the progression of AC and CC with overall similar profiles and add to the evidence suggesting that HPV-driven oncogenesis may result in similar non-random methylomic events. Our findings may lead to identification of potential epigenetic drivers of HPV-associated cancers and also, of potential markers to identify higher risk pre-cancerous lesions.


Conflict of interest statement

I have read the journal’s policy and the authors of this manuscript have the following competing interests: Dr. Berglund discloses grants from NIH and from Florida Biomedical Research program, during the conduct of the study. Dr. Eschrich reports grants from the NCI, during the conduct of the study and other relevant financial activities with Cvergenx, Inc., outside the submitted work. Dr. Guha reports grants and personal fees from Johnson & Johnson, grants from Celldex, and other financial activities from Focused Ultrasound Foundation and Varian, outside the submitted work. Dr. Siegel reports grant from the NIH and from the Florida Biomedical Research Program, during the conduct of the study. This does not alter our adherence to PLOS ONE policies on sharing data and materials.

Figures

Fig 1
Fig 1. Principal Components Analysis (PCA) score plot.
The PCA model, using >300, 000 beta-values, separates normal tissues (blue circles) from tumor samples (red triangles) for both AC (a) and CC (b). AIN3 samples (a, grey squares) clustered more with the tumor samples, whereas CIN3 samples (b, grey squares) segregated into those similar to normal epithelium and others more similar to cancer.
Fig 2
Fig 2
Gene structure methylation plot of differentially methylated CpG loci within ZIK1 in anal (a) and cervical (b) tissues. Genomic coordinates are represented on the left vertical axis and methylation probe IDs (or CpG loci) on the right vertical axis. For each of the 15 CpG loci, boxplots illustrate the median (dot) and interquartile ranges [25th (low boundary of box) and 75th (upper boundary of box) percentiles] of β-values in tumor (red boxes), AIN3 or CIN3 (grey boxes) and normal (blue boxes). Significantly different median methylation at each CpG loci is noted as * for p<0.05 and ** for p<0.005. Among the 15 CpG sites presented, 4 CpG sites fall within the overlapping DMRs that were significantly hypermethylated in both anal (a) and cervical (b) cancers. For ZIK1, the anal in situ (AIN3) samples showed similar methylation levels to those of tumor samples whereas for CIN3, methylation levels were similar to normal cervical tissues. Corresponding correlation plots between all ZIK1 probes for anal (c) and cervical (d) cancers show a high degree of correlation for ten of the probes. The average methylation levels for the ten correlated probes show high correlation (r = -0.7) to RNAseq gene expression levels in the TCGA CESC dataset (e). The tumor vs. normal expression levels across multiple TCGA tumor types are shown (f, *p<0.05, **p<0.01, ***p<0.001 & ****p<0.0001).
Fig 3
Fig 3
Gene structure methylation plot of differentially methylated CpG loci within ASCL1 in anal (a) and cervical (b) tissues. Genomic coordinates are represented on the left vertical axis and methylation probe ID (or CpG loci) on the right vertical axis. For each of the 21 CpG loci, boxplots illustrate the median (dot) and interquartile ranges [25th (low boundary of box) and 75th (upper boundary of box) percentiles] of β-values in tumor (red boxes), AIN3 or CIN3 (blue boxes) and normal (green boxes). Significantly different median methylation at each CpG loci is noted as * for p<0.05 and ** for p<0.005. Among the 21 CpG sites presented, 4 CpG sites fall within the overlapping DMRs that were significantly hypermethylated in both anal (a) and cervical (b) cancers. For ASCL1, anal in situ (AIN3) showed similar methylation levels as tumors while, CIN3 methylation levels were similar to normal cervical tissues. Corresponding correlation plots between all ASCL1 probes for anal (c) and cervical (d) cancers show a high degree of correlation for all of the probes. The average methylation levels for 17 probes show low correlation (r = -0.3) to RNAseq gene expression level in the TCGA CESC dataset (e). The tumor vs. normal gene expression levels across multiple TCGA tumor types are shown (f, *p<0.05, **p<0.01, ***p<0.001 & ****p<0.0001).
Fig 4
Fig 4
Methylation models for Anal (a-b) and Cervical (c-f) Cancer progression and similarities between Anal and Cervical methylation (g-h). The AC progression PLS model applied to the Anal dataset showed a clear distinction of normal and tumor samples, with the AIN3 samples scoring as tumor like (a). The CC progression PLS model applied to the Cervical dataset differentiates normal and the tumor samples with 3 of the CIN3 samples scoring as tumor-like and 6 as normal-like (b). The CC progression PLS model was further validated on three additional datasets. The TCGA Cervical dataset where the normal (n = 3) samples scored low, the metastatic (Met, n = 2) samples scores as tumors and all but 5 tumor (n = 307) samples scored high (c). In the GSE46306 cervical dataset, all of the normal (n = 20) samples scored as “normal” and most of the tumor (n = 6) scored as tumors while most of the CIN3 (n = 18) scored as “normal-like” with several being classified as “tumor-like” (d). Finally, in GSE99511 all normal cases (n = 28) scored appropriately while tumors (n = 4) scored higher with the majority but not all CIN3 cases (n = 36) scoring as “normal-like” (e). Density scatter plot for Δ β-values for tumor versus normal for cervical tissues on the x-axis and anal tissues on the y-axis (f). The high correlation indicates that the Δ β-values are similar when comparing the progression of both cervical and anal cancers. This was further explored by applying the AC progression PLS model to the cervical dataset and comparing it with the CC progression PLS model (g). The high correlation implies that the methylation changes are similar in cervical between anal cancers. This was further corroborated, when the CC progression PLS model was applied to the anal dataset and a similar high correlation was observed (h).

References

    1. Senkomago V, Henley SJ, Thomas CC, Mix JM, Markowitz LE, Saraiya M. Human Papillomavirus-Attributable Cancers—United States, 2012–2016. MMWR Morb Mortal Wkly Rep. 2019;68(33):724–8. doi: 10.15585/mmwr.mm6833a3 - DOI - PMC - PubMed
    1. Hariri S, Unger ER, Schafer S, Niccolai LM, Park IU, Bloch KC, et al.. HPV type attribution in high-grade cervical lesions: assessing the potential benefits of vaccines in a population-based evaluation in the United States. Cancer Epidemiol Biomarkers Prev. 2015;24(2):393–9. doi: 10.1158/1055-9965.EPI-14-0649 - DOI - PubMed
    1. Shridhar R, Shibata D, Chan E, Thomas CR. Anal cancer: current standards in care and recent changes in practice. CA Cancer J Clin. 2015;65(2):139–62. doi: 10.3322/caac.21259 - DOI - PubMed
    1. Jemal A, Simard EP, Dorell C, Noone AM, Markowitz LE, Kohler B, et al.. Annual Report to the Nation on the Status of Cancer, 1975–2009, featuring the burden and trends in human papillomavirus(HPV)-associated cancers and HPV vaccination coverage levels. Journal of the National Cancer Institute. 2013;105(3):175–201. doi: 10.1093/jnci/djs491 - DOI - PMC - PubMed
    1. McCredie MR, Sharples KJ, Paul C, Baranyai J, Medley G, Jones RW, et al.. Natural history of cervical neoplasia and risk of invasive cancer in women with cervical intraepithelial neoplasia 3: a retrospective cohort study. Lancet Oncol. 2008;9(5):425–34. doi: 10.1016/S1470-2045(08)70103-7 - DOI - PubMed

Publication types

MeSH terms

Substances