

B1-type cyclins control microtubule organization during cell division in Arabidopsis
- PMID: 34882930
- PMCID: PMC8728612
- DOI: 10.15252/embr.202153995
B1-type cyclins control microtubule organization during cell division in Arabidopsis
Abstract
Flowering plants contain a large number of cyclin families, each containing multiple members, most of which have not been characterized to date. Here, we analyzed the role of the B1 subclass of mitotic cyclins in cell cycle control during Arabidopsis development. While we reveal CYCB1;5 to be a pseudogene, the remaining four members were found to be expressed in dividing cells. Mutant analyses showed a complex pattern of overlapping, development-specific requirements of B1-type cyclins with CYCB1;2 playing a central role. The double mutant cycb1;1 cycb1;2 is severely compromised in growth, yet viable beyond the seedling stage, hence representing a unique opportunity to study the function of B1-type cyclin activity at the organismic level. Immunolocalization of microtubules in cycb1;1 cycb1;2 and treating mutants with the microtubule drug oryzalin revealed a key role of B1-type cyclins in orchestrating mitotic microtubule networks. Subsequently, we identified the GAMMA-TUBULIN COMPLEX PROTEIN 3-INTERACTING PROTEIN 1 (GIP1/MOZART) as an in vitro substrate of B1-type cyclin complexes and further genetic analyses support a potential role in the regulation of GIP1 by CYCB1s.
Keywords: CDK; CYCB1; endosperm; microtubule nucleation; mitosis.
© 2021 The Authors. Published under the terms of the CC BY NC ND 4.0 license.
Conflict of interest statement
The authors declare that they have no conflict of interest.
Figures
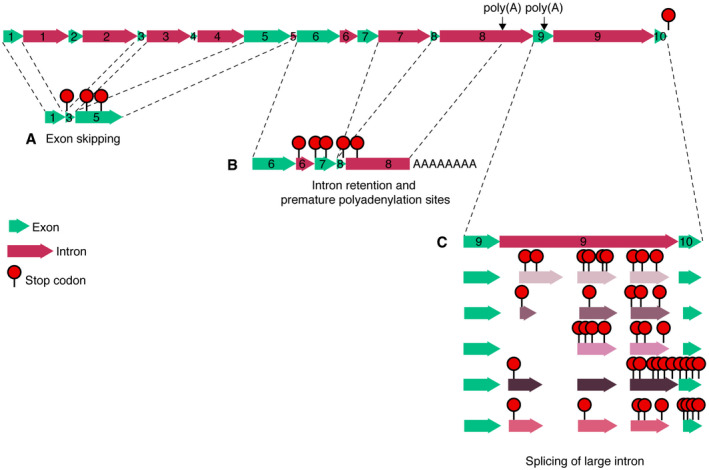
- A–C
The predicted gene structure of CYCB1;5, including the observed cDNAs with exon skipping (A), intron retention and premature polyadenylation sites (B), and alternative splicing of a large intron (C).
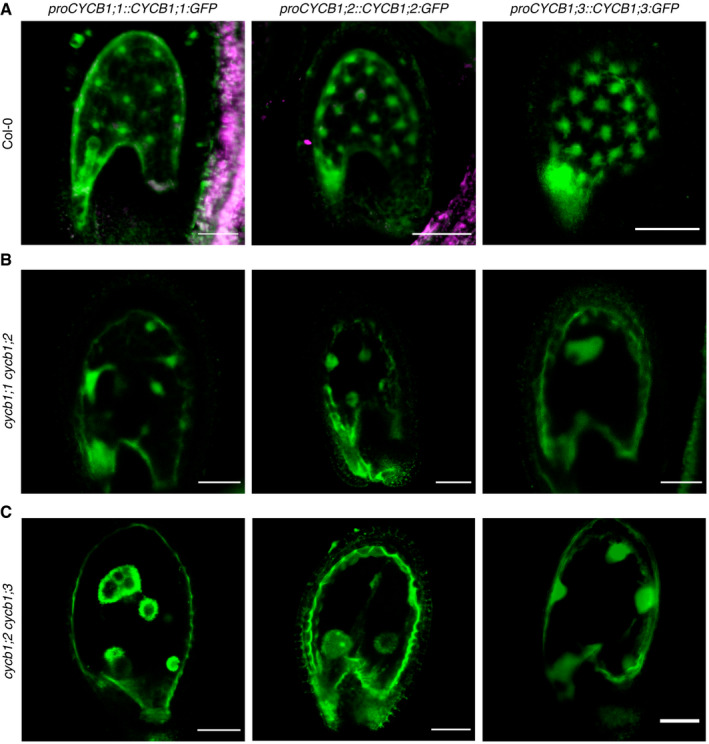
- A–C
Confocal microscope pictures of seeds expressing either proCYCB1;1:GFP, proCYCB1;2:GFP or proCYCB1;3:GFP in Col‐0 (A), cycb1;1 cycb1;2 (B), or cycb1;2 cycb1;3 (C). Scale bars: 30 μm.
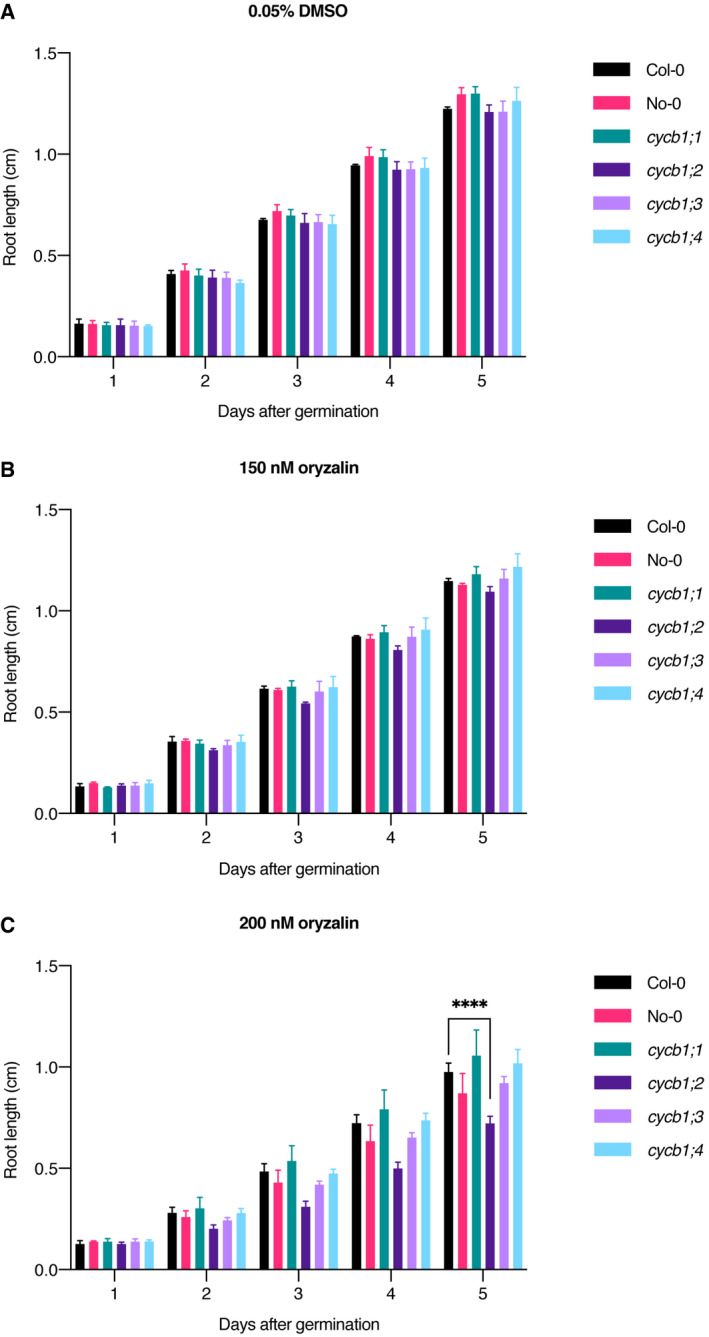
- A–C
Quantification of root length in a control condition (A), 150 nM oryzalin (B) and 200 nM oryzalin (C). Graphs show mean ± SD of three biological replicates with at least 10 plants per genotype per replicate. Asterisks indicate a significant difference in root length in a two‐way ANOVA followed by Tukey’s multiple comparisons test (****P < 0.0001).
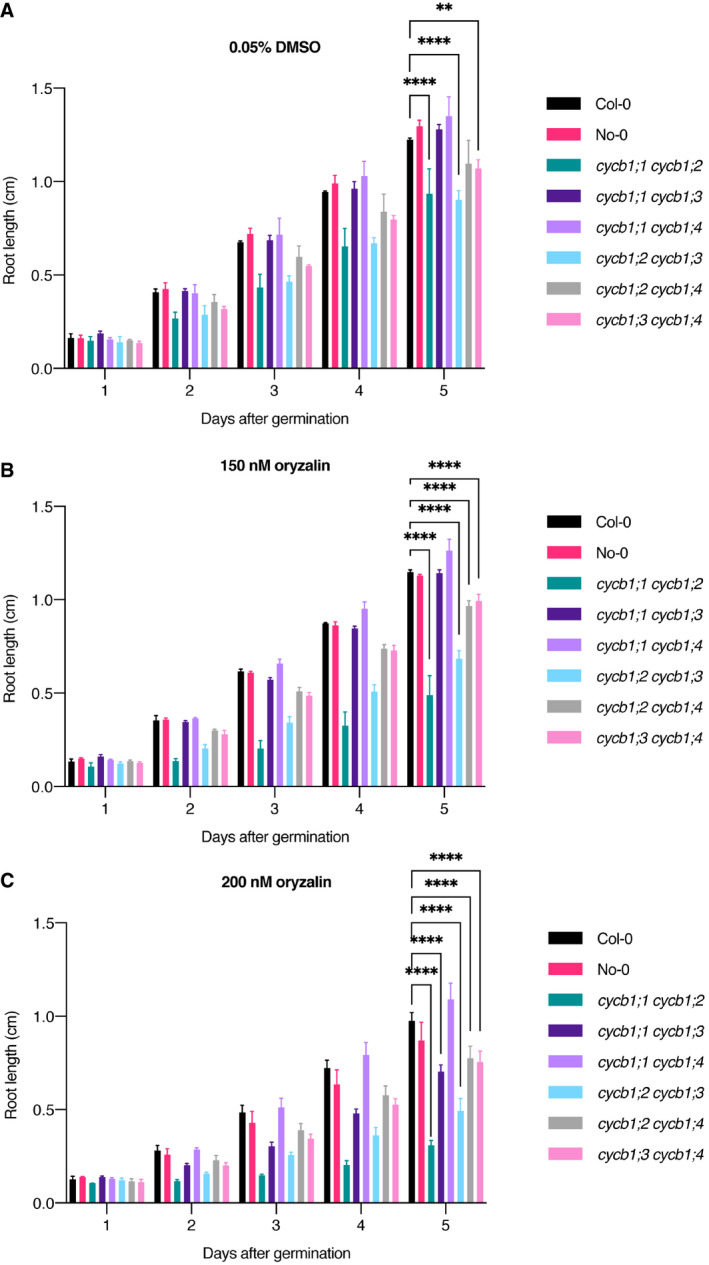
- A–C
Quantification of root length in a control condition (A), 150 nM oryzalin (B), and 200 nM oryzalin (C). Graphs show mean ± SD of three biological replicates with at least 10 plants per genotype per replicate. Asterisks indicate a significant difference in root length in a two‐way ANOVA followed by Tukey’s multiple comparisons test (**P < 0.01 and ****P < 0.0001).
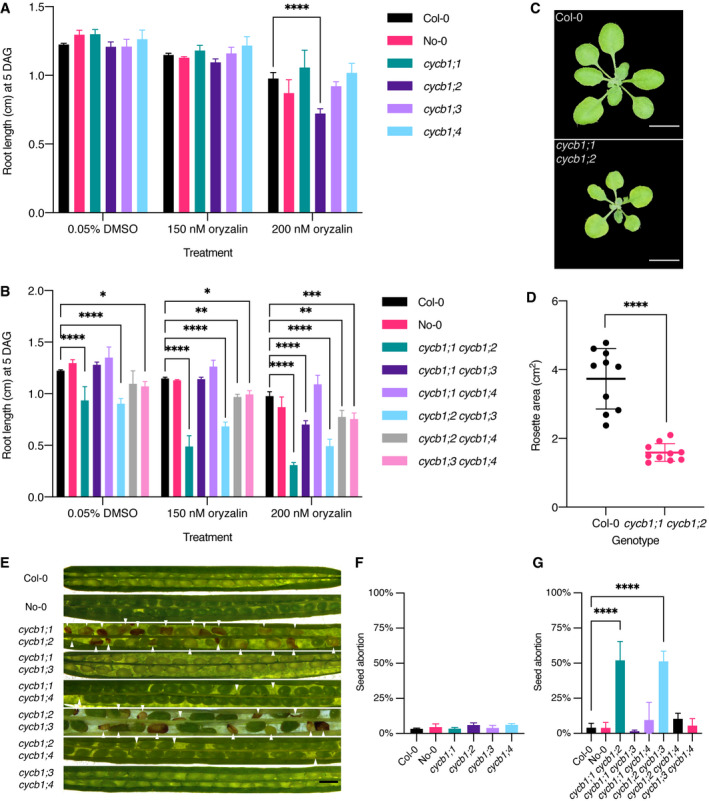
- A, B
Quantification of oryzalin root growth assays in single (A) and double (B) mutants. DAG, days after germination. Graphs show mean ± SD of three biological replicates with at least 10 plants per genotype per replicate. Asterisks indicate a significant difference in root length in a two‐way ANOVA followed by Tukey’s multiple comparisons test (*P < 0.05, **P < 0.01, ***P < 0.001 and ****P < 0.0001).
- C
Rosette pictures of 20‐day‐old Col‐0 and cycb1;1 cycb1;2. Scale bar: 1 cm.
- D
Quantification of the rosette area using total leaf surface in Col‐0 and cycb1;1 cycb1;2. Graph represents the single rosette area values and the horizontal lines indicate the mean value ± SD, n = 10 plants per genotype. Asterisks indicate a significant difference in rosette area using an unpaired t‐test, t = 7.421, df = 18 (****P < 0.0001).
- E
Silique pictures of cycb1 double mutant combinations. White arrowheads indicate aborted ovules and seeds. Scale bars: 500 μm.
- F, G
Quantification of aborted seeds in single (F) and double (G) mutants. Graphs represent the average seed abortion rate per plant ± SD of three biological replicates, n = 550–1,029 seeds analyzed per genotype. Asterisks indicate significant differences in seed abortion rate in an ordinary one‐way ANOVA test, followed by a Dunnett’s multiple comparisons test (****P < 0.0001).
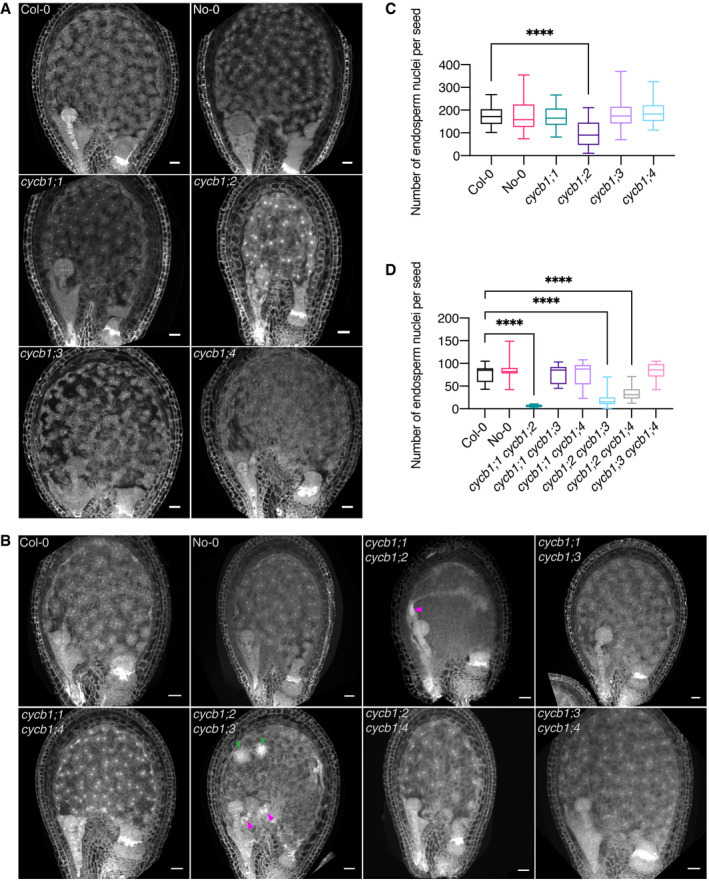
- A, B
Confocal microscopy images of seeds 3 DAP. Endosperm and embryo morphology in cycb1 single (A) and double (B) mutants. Magenta arrowheads indicate enlarged endosperm nuclei, while green arrowheads indicate atypical agglomerates of endosperm nuclei. Scale bars: 25 μm.
- C, D
Quantification of endosperm nuclei in cycb1 single (C) and double (D) mutants. Boxes and whiskers represent min to max values with the median indicated as a central horizontal line, n = 26–30 seeds per genotype. Asterisks show significant differences in the number of endosperm nuclei per seed in a Kruskal–Wallis test followed by Dunn’s multiple comparisons test (****P < 0.0001).
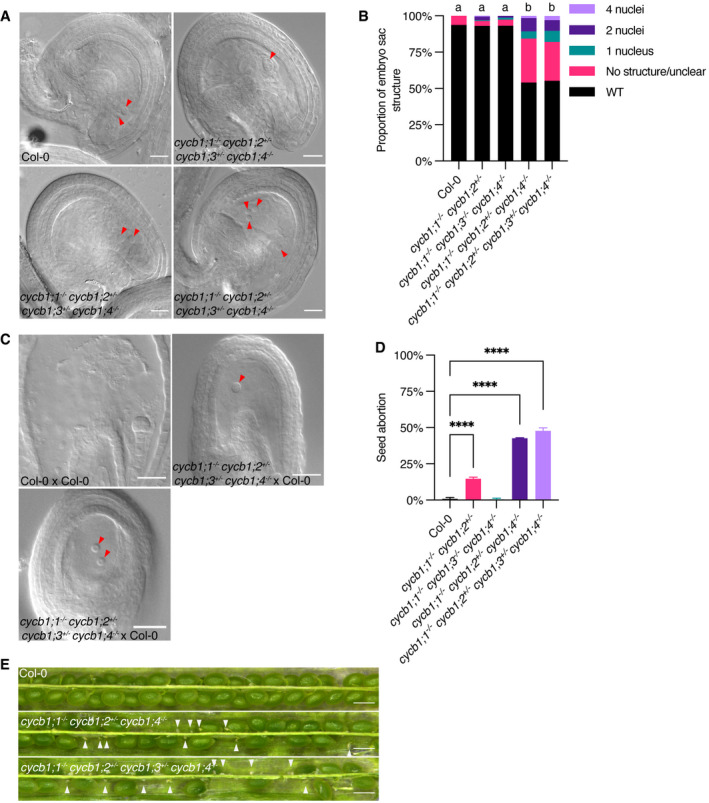
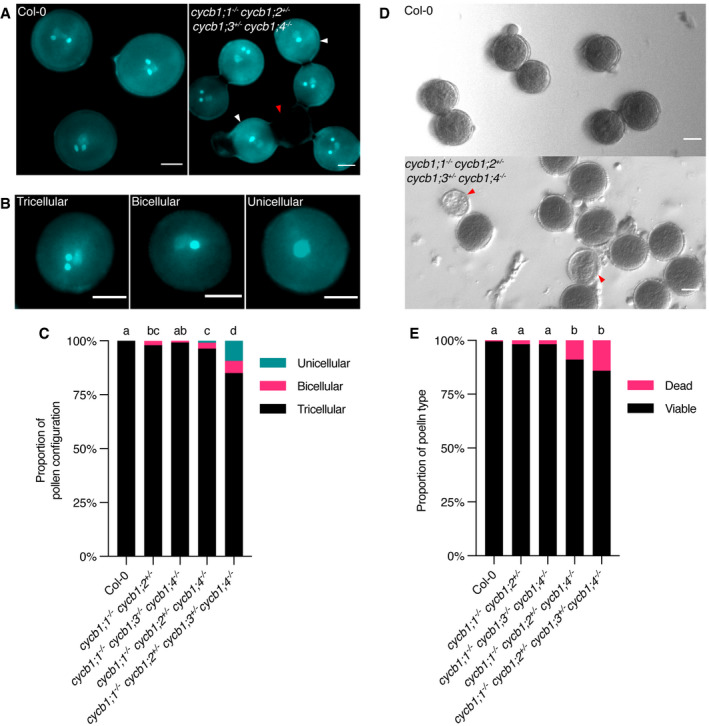
DIC images of abnormal embryo sacs in cycb1 mutant combinations. Red arrowheads indicate the visible nuclei in Col‐0 embryo sacs (central and egg cells) and the corresponding structures in the quadruple cycb1;1 −/− cycb1;2 +/− cycb1;3 +/− cycb1;4 −/− mutant. Scale bars: 20 μm.
Quantification of the different abnormal embryo sac structures in cycb1 mutant combinations (n = 202–459 embryo sacs per genotype). Different letters indicate significant differences in the proportion of abnormal embryo sacs in a Chi‐squared test followed by the Marascuilo procedure to identify significant pairwise comparisons. WT, wild type.
DIC images of embryo sacs 3 DAP with wild‐type pollen (female × male). Red arrowheads indicate the visible embryo sac nuclei in the crosses with the quadruple cycb1;1 −/− cycb1;2 +/− cycb1;3 +/− cycb1;4 −/− mutant as a female donor, while the control Col‐0 × Col‐0 cross exhibits a developing embryo. Scale bars: 20 μm.
Quantification of seed abortion in different cycb1 mutant combinations. Graph represents the average seed abortion rate per plant ± SD of three biological replicates, n = 463–579 seeds analyzed per genotype. Asterisks indicate significant differences in seed abortion rate in an ordinary one‐way ANOVA test, followed by a Dunnett’s multiple comparisons test (****P < 0.0001).
Silique pictures of cycb1 triple and quadruple mutants. White arrowheads indicate early aborted ovules. Scale bars: 500 μm.
- A, B
DAPI staining of pollen in cycb1 mutants, including pollen configurations found in cycb1;1 −/− cycb1;2 +/− cycb1;3 +/− cycb1;4 −/− mutants (B). Scale bars: 5 μm.
- C
Quantification of DAPI‐stained pollen configurations in different cycb1 mutant combinations, n = 420–616 pollen grains per genotype. Different letters indicate significant differences in the proportion of abnormal pollen (uni‐ and bicellular) in a Chi‐squared test followed by the Marascuilo procedure to identify significant pairwise comparisons.
- D
Alexander staining of mature pollen indicating pollen viability. Scale bars: 5 μm.
- E
Quantification of Alexander stained pollen viability, n = 403–498 pollen grains per genotype. Different letters indicate significant differences in the proportion of dead pollen in a Chi‐squared test followed by the Marascuilo procedure to identify significant pairwise comparisons.
- A–C
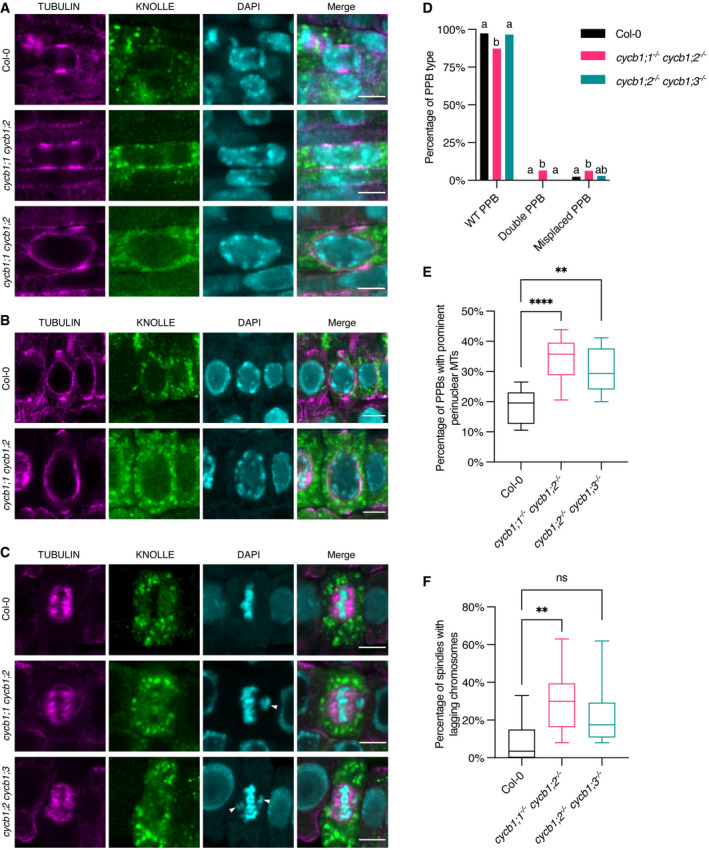
Co‐immunolocalization against tubulin (magenta) and KNOLLE (green) in root meristematic cells. Nuclei were counterstained with DAPI for the DNA (cyan). White arrowheads indicate laggards in the metaphase stage. Scale bars: 5 μm.
- D
Quantification of wild‐type (WT), double, and misplaced PPBs. Different letters indicate significant differences in the proportions of the different arrays per category in a Chi‐squared test followed by the Marascuilo procedure to identify significant pairwise comparisons. Ten roots were analyzed per genotype.
- E
Quantification of PPBs with prominent perinuclear microtubules (MTs). Boxes and whiskers represent min to max values with the median indicated as a central horizontal line, n = 10 roots per genotype. Asterisks show significant differences in the percentage of PPBs with prominent perinuclear microtubules per root in an ANOVA test followed by Dunnett’s multiple comparisons test (**P < 0.01 and ****P < 0.0001).
- F
Quantification of spindles with lagging chromosomes. Boxes and whiskers represent min to max values with the median indicated as a central horizontal line, n = 10 roots per genotype. Asterisks show significant differences in the percentage of spindles with lagging chromosomes per root in a Kruskal–Wallis test followed by Dunn’s multiple comparisons test (**P < 0.01 and ns, non‐significant).
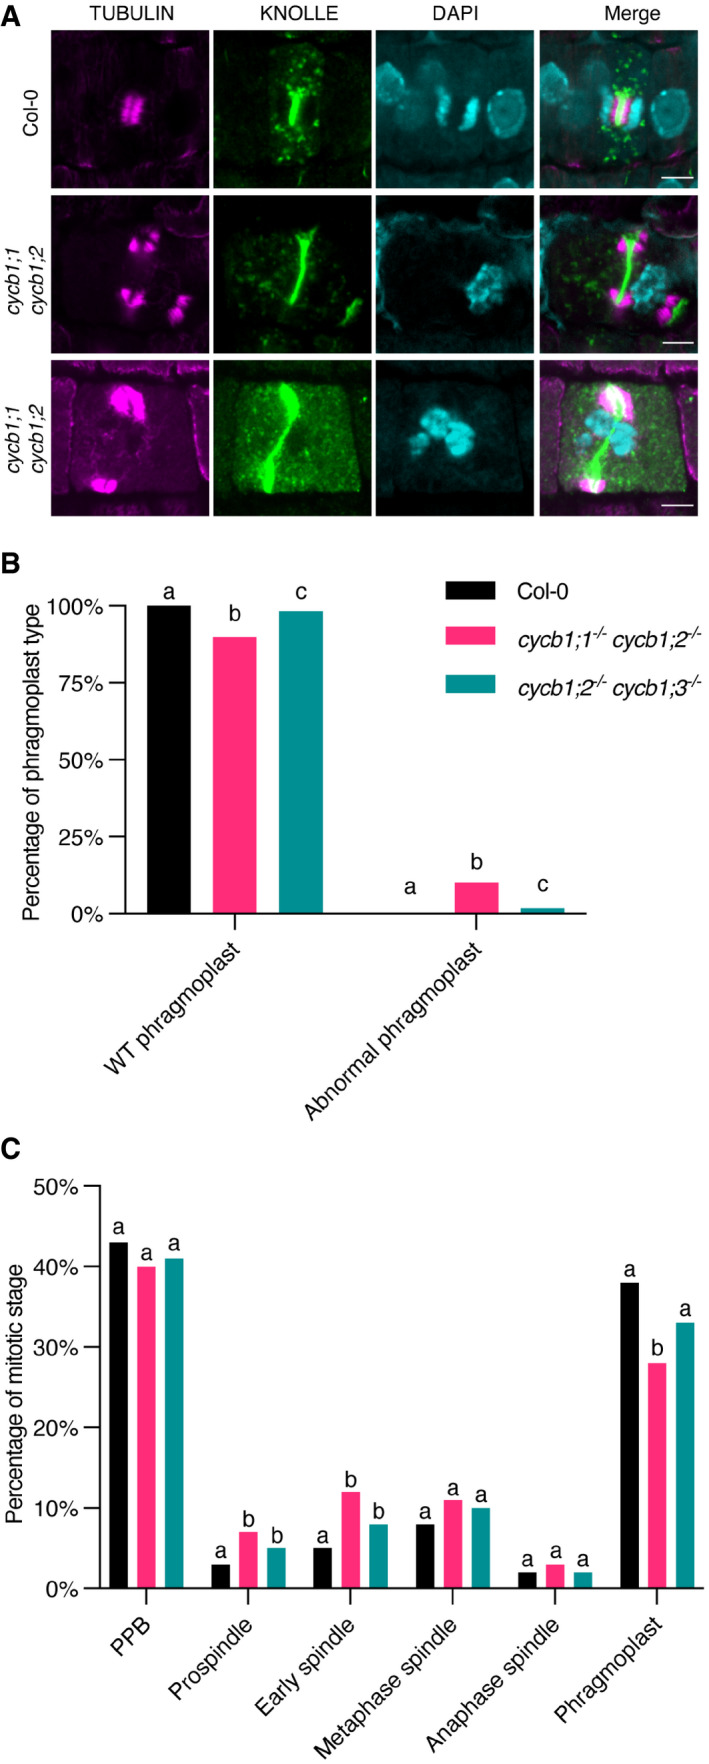
Co‐immunolocalization against tubulin (magenta) and KNOLLE (green) in root meristematic cells. Nuclei were counterstained with DAPI for the DNA (cyan). Scale bars: 5 μm.
Quantification of wild‐type (WT) and abnormal phragmoplasts. Different letters indicate significant differences in the proportions of the different arrays per category in a Chi‐squared test followed by the Marascuilo procedure to identify significant pairwise comparisons. Ten roots were analyzed per genotype.
Quantification of the different mitotic stages in roots of the different genotypes. Different letters indicate significant differences in the proportions of the different arrays per category in a Chi‐squared test followed by the Marascuilo procedure to identify significant pairwise comparisons. Ten roots were analyzed per genotype.
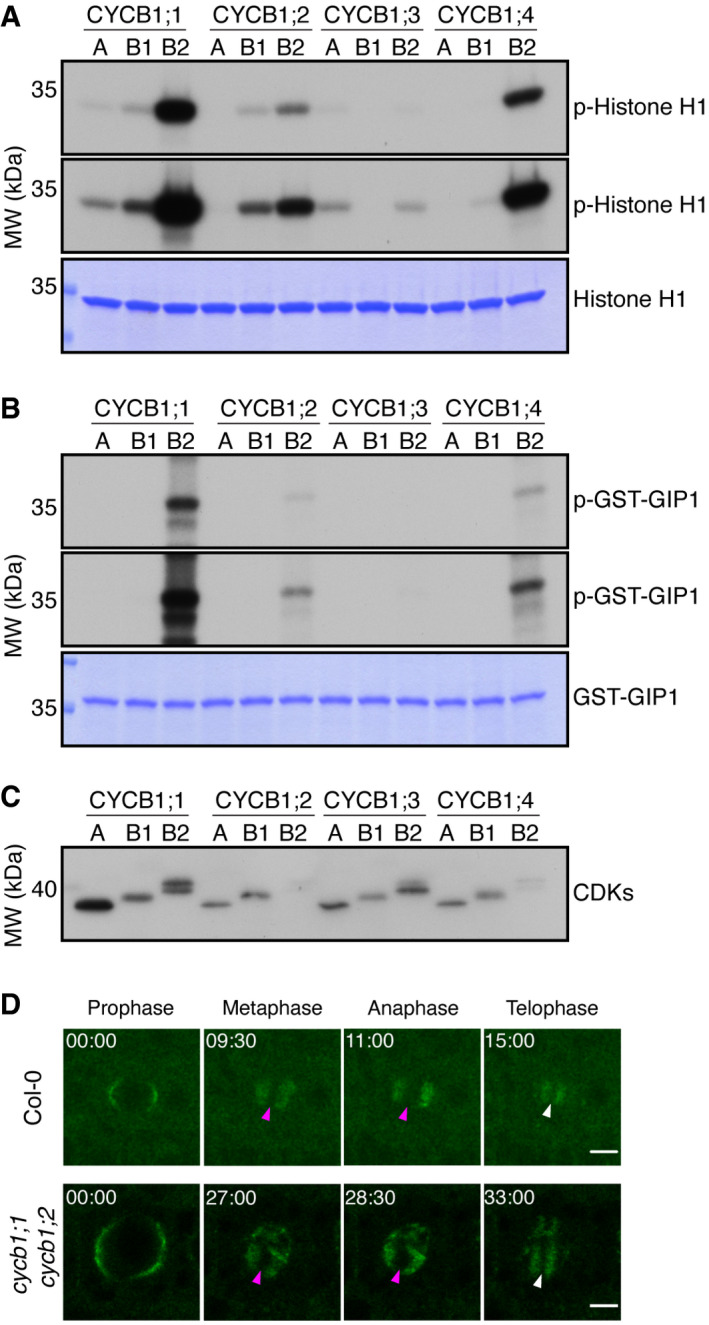
Kinase assays against Histone H1. Top and middle panels indicate shorter and longer exposures, respectively, of the same kinase assays. Bottom panel is a CBB staining of Histone H1 showing equal loading of the protein. A: CDKA;1, B1: CDKB1;1, B2: CDKB2;2.
Kinase assays against GIP1. Top and middle panels indicate shorter and longer exposures, respectively, of the same kinase assays. Bottom panel is a CBB staining of GIP1 showing equal loading of the protein. A: CDKA;1, B1: CDKB1;1, B2: CDKB2;2.
Western blot against StrepIII‐tagged proteins to show loaded amounts of the CDKs. A: CDKA;1, B1: CDKB1;1, B2: CDKB2;2. Double CDKB2;2 bands are likely due to a truncation of the expressed protein.
Time lapse of confocal microscope pictures of root meristematic cells tagged with GFP‐GIP1 in Col‐0 (top panel) and cycb1;1 cycb1;2 (bottom panel). GIP1 localizes at the nuclear polar caps, followed by co‐localization with microtubules at the spindle and phragmoplast arrays. In cycb1;1 cycb1;2 double mutants, GIP1 exhibited an abnormal localization, being found at the spindle (magenta arrowheads) and phragmoplast (white arrowheads) midzones, which are normally devoid of the protein. Scale bars: 5 μm.
References
Publication types
MeSH terms
Substances
LinkOut - more resources
Full Text Sources
Molecular Biology Databases
Research Materials
