. 2021 Dec 14;37(11):110114.
doi: 10.1016/j.celrep.2021.110114. Epub 2021 Nov 24.

Anti-SARS-CoV-2 antibodies elicited by COVID-19 mRNA vaccine exhibit a unique glycosylation pattern

Affiliations

Anti-SARS-CoV-2 antibodies elicited by COVID-19 mRNA vaccine exhibit a unique glycosylation pattern

Inbal Farkash et al. Cell Rep. .

Abstract

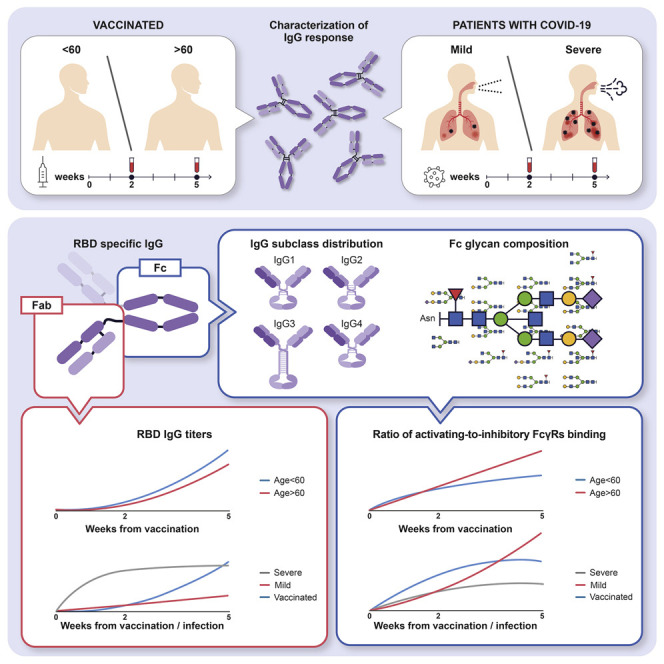
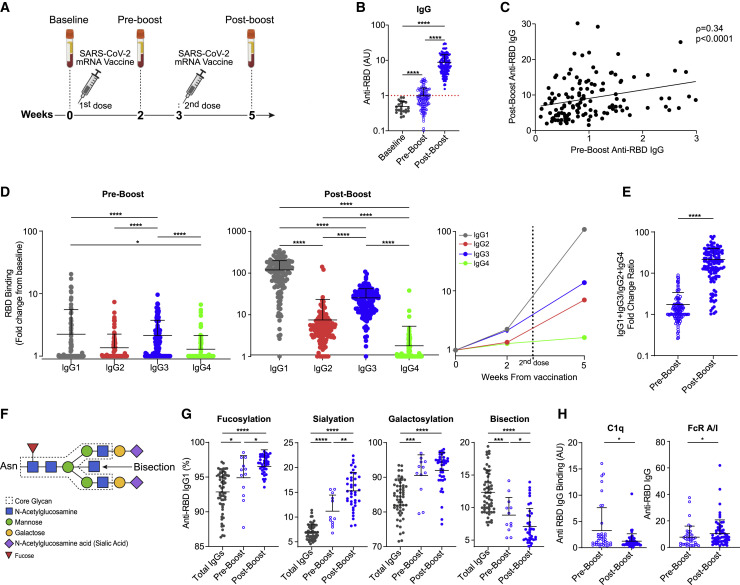
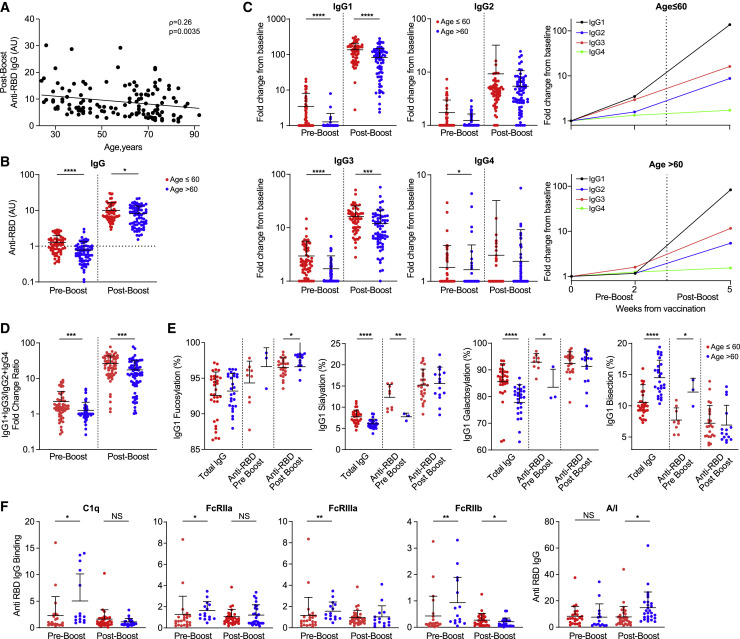
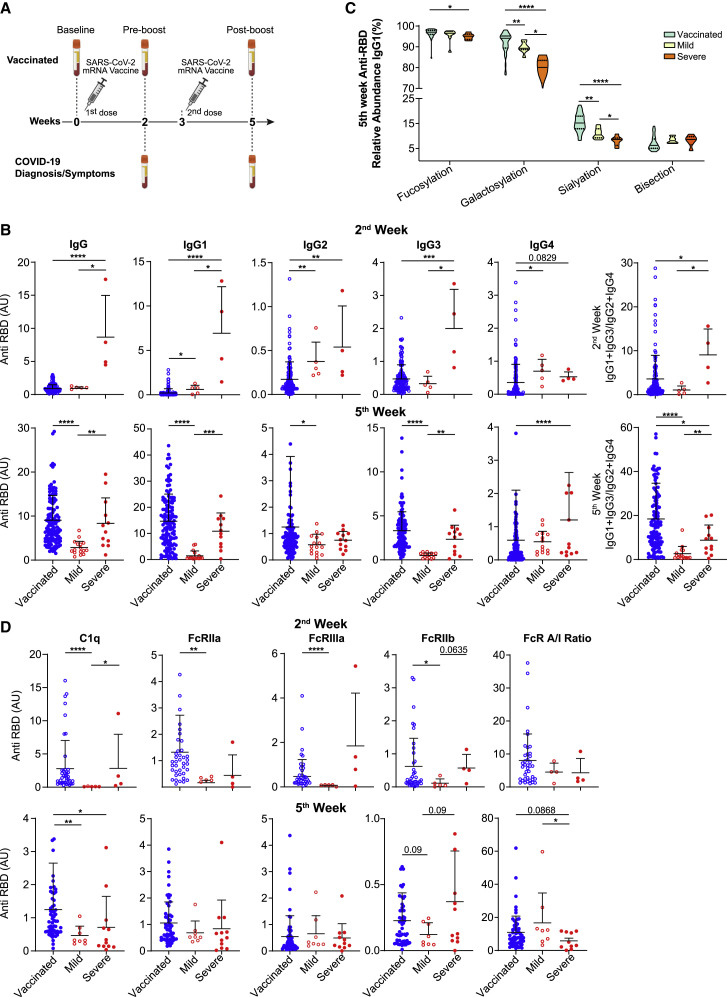
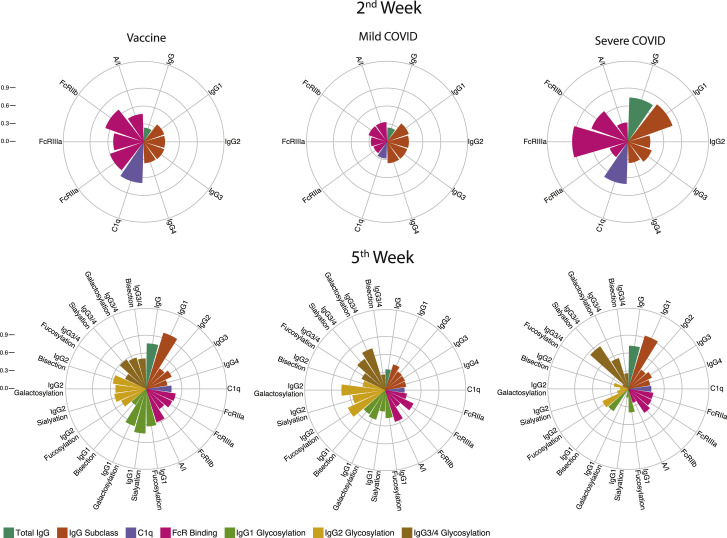
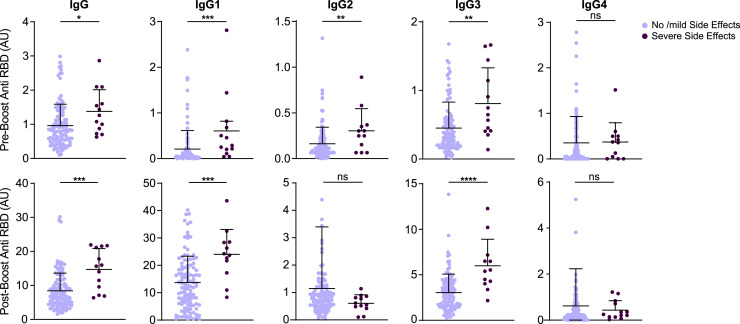
Messenger RNA-based vaccines against COVID-19 induce a robust anti-SARS-CoV-2 antibody response with potent viral neutralization activity. Antibody effector functions are determined by their constant region subclasses and by their glycosylation patterns, but their role in vaccine efficacy is unclear. Moreover, whether vaccination induces antibodies similar to those in patients with COVID-19 remains unknown. We analyze BNT162b2 vaccine-induced IgG subclass distribution and Fc glycosylation patterns and their potential to drive effector function via Fcγ receptors and complement pathways. We identify unique and dynamic pro-inflammatory Fc compositions that are distinct from those in patients with COVID-19 and convalescents. Vaccine-induced anti-Spike IgG is characterized by distinct Fab- and Fc-mediated functions between different age groups and in comparison to antibodies generated during natural viral infection. These data highlight the heterogeneity of Fc responses to SARS-CoV-2 infection and vaccination and suggest that they support long-lasting protection differently.

Keywords: BNT162b2 mRNA vaccine; Fc-Glycosylation; Fcγ receptors; IgG glycosylation; IgG-Fc; SARS-CoV-2; antibodies; complement; effector function; immunity.


Conflict of interest statement

Declaration of interests R.D. serves as a consultant for Teva Pharmaceutical Industries and NucleAi and receives research grant support from Teva Pharmaceutical Industries. The other authors declare no competing interests.

Figures

None
Graphical abstract
Figure 1
Figure 1
IgG Fab and Fc responses to BNT162b2 SARS-CoV-2 vaccine (A) Experimental scheme. Blood was collected before receiving any vaccine dose (baseline, n = 23), at 2 weeks after the first vaccine dose (pre-boost, n = 127), and at 5 weeks (post-boost, n = 127). (B) RBD-binding IgG levels at baseline, pre-boost, and post-boost. Dotted red line indicates threshold for positivity. (C) Correlation between anti-RBD IgG titers following the first vaccine dose and following the second dose (n = 127, non-parametric Spearman’s correlation). (D) Anti-RBD IgG subclass distribution at the pre-boost and post-boost time points. Kruskal-Wallis test was used with Dunn’s post hoc test to correct for multiple comparisons. (E) (IgG1 + IgG3):(IgG2 + IgG4) ratio of sera anti-RBD IgG subclasses. Pre-boost, n = 123; post-boost, n = 127. – (F) Scheme of the IgG Fc glycan structure. The N-glycan is attached at the Asn297 position of each IgG heavy chain. The dashed line indicates the conserved heptasaccharide core, which may have the indicated saccharide extensions. (G) Fc glycosylation patterns of IgG1 in vaccinated individuals, determined by mass spectrometry. Shown are the total IgGs produced at the pre-boost time point (n = 59) and anti-RBD IgGs of participants who had an IgG1 response at pre-boost (n = 12) and at post-boost (n = 39). Detected glycan structures are shown in Figure S2. (H) Ratios between RBD-specific IgGs binding to activating (FcγRIIa + FcγRIIIa) versus inhibitory (FcγRIIb) receptors at each time point (pre-boost, n = 39; post-boost, n = 59; also see Figure S1). Data are presented as scatterplots indicating individual measurements (dots); black line represents the mean; error bars represent standard deviations (SDs). Unless otherwise mentioned, unpaired 2-sided Mann-Whitney U test was used to evaluate the differences between groups. p < 0.05, ∗∗p < 0.01, ∗∗∗p < 0.001, ∗∗∗∗p < 0.0001.
Figure 2
Figure 2
Age affects the BNT162b2-induced IgG Fc structures and function (A) Correlation of post-boost anti-RBD IgG titers and age. Non-parametric Spearman’s correlation was used, n = 127. (B) Pre- and post-boost anti-RBD IgG titers when using a cutoff of 60 years of age (age ≤60, n = 60; age >60, n = 67). Dotted line depicts threshold for positivity. (C) Pre- and post-boost anti-RBD IgG subclass distributions by age. Fold change from baseline anti-RBD IgG levels were determined as described above (age ≤60, n = 60; age >60, n = 67). (D) Age-dependent pre- and post-boost (IgG1 + IgG3):(IgG2 + IgG4) ratios of anti-RBD IgG (age ≤60, n = 60, red; age >60, n = 67, blue). (E) Age-dependent Fc glycosylation patterns of IgG1 among vaccinated individuals. Levels are compared for the total IgGs produced at the pre-boost time point (age ≤60, n = 27; age >60, n = 32), for individuals who had an IgG1 response at pre-boost (age ≤60, n = 9; age >60, n = 3), and for individuals who had an IgG1 response at post-boost (age ≤60, n = 24; age >60, n = 15). (F) Age-dependent binding activity of RBD-specific IgGs to FcγRs and C1q. Binding to each receptor was determined at pre-boost (age ≤60, n = 22, red; age >60, n = 15, blue) and post-boost (age ≤60, n = 32, age >60, n = 27). Ratios between RBD-specific IgG binding to activating inhibitory receptors were determined as described above. See also Figure S3. Data are presented as scatterplots indicating individual measurements (dots); the black line represents the mean; error bars represent SDs. Unpaired 2-sided Mann-Whitney U test was used to evaluate differences between groups. p < 0.05, ∗∗p < 0.01, ∗∗∗p < 0.001, ∗∗∗∗p < 0.0001.
Figure 3
Figure 3
Structural and functional properties of anti-RBD IgG response are distinct in vaccinated individuals versus patients with COVID-19 (A) Experimental scheme of the COVID-19 and vaccine cohorts. (B) Anti-RBD total IgG and subclass responses 2 weeks (vaccinated, n = 127; mild, n = 5; severe, n = 4) and 5 weeks (vaccinated, n = 127; mild, n = 16; severe, n = 12) after vaccine or COVID-19 diagnosis. IgG levels were determined by ELISA. (C) Patterns of Fc glycosylation in anti-RBD IgGs produced at 5 weeks from vaccine or COVID-19 diagnosis. RBD-specific IgGs were isolated and Fc glycan structure was determined for each subclass by mass spectrometry as described above (vaccinated, n = 39; mild, n = 8; severe, n = 6). Data are presented as violin plots, with solid lines representing median and dotted lines representing upper and lower quartiles. (D) Dynamic of FcγR and C1q binding properties of anti-RBD IgGs from vaccinated individuals and patients with COVID-19. FcγR binding was determined at 2 weeks (vaccinated, n = 39; mild, n = 5; severe, n = 4) and 5 weeks (vaccinated, n = 59; mild, n = 8; severe, n = 12) from vaccine or diagnosis. See also Figure S5. Unless otherwise mentioned, data are presented as scatterplots indicating individual measurements (dots); the black line represents the mean; error bars represent SDs. Unpaired 2-sided Mann-Whitney U test was used to evaluate differences between groups. p < 0.05, ∗∗p < 0.01, ∗∗∗p < 0.001, ∗∗∗∗p < 0.0001.
Figure 4
Figure 4
Anti-RBD IgG response in vaccinated individuals versus patients with COVID-19 The circular bar plots depict the mean percentile of each feature ranging from 0 to 1.
Figure 5
Figure 5
Elevated anti-RBD IgG titers in individuals with severe side effects after the second vaccine dose Anti-RBD total IgG and subclass composition were determined for the indicated serum samples. Symptom severity was determined by the participants and was assigned as no/mild side effects and severe side effects groups. No side effects, n = 114; severe side effects, n = 13. See also Figure S6. Data are presented as scatterplots indicating individual measurements (dots); the black line represents the mean; error bars represent SDs. Unpaired 2-sided Mann-Whitney U test was used to evaluate differences between groups. p < 0.05, ∗∗p < 0.01, ∗∗∗p < 0.001, ∗∗∗∗p < 0.0001.

References

    1. Amanat F., Stadlbauer D., Strohmeier S., Nguyen T.H.O., Chromikova V., McMahon M., Jiang K., Arunkumar G.A., Jurczyszak D., Polanco J., et al. A serological assay to detect SARS-CoV-2 seroconversion in humans. Nat. Med. 2020;26:1033–1036. - PMC - PubMed
    1. Anthony R.M., Nimmerjahn F. The role of differential IgG glycosylation in the interaction of antibodies with FcγRs in vivo. Curr. Opin. Organ Transplant. 2011;16:7–14. - PubMed
    1. Baden L.R., El Sahly H.M., Essink B., Kotloff K., Frey S., Novak R., Diemert D., Spector S.A., Rouphael N., Creech C.B., et al. COVE Study Group Efficacy and Safety of the mRNA-1273 SARS-CoV-2 Vaccine. N. Engl. J. Med. 2021;384:403–416. - PMC - PubMed
    1. Bates T.A., Leier H.C., Lyski Z.L., Goodman J.R., Curlin M.E., Messer W.B., Tafesse F.G. Age-Dependent Neutralization of SARS-CoV-2 and P.1 Variant by Vaccine Immune Serum Samples. JAMA. 2021;326:868–869. - PMC - PubMed
    1. Bournazos S., Ravetch J.V. Diversification of IgG effector functions. Int. Immunol. 2017;29:303–310. - PMC - PubMed

Publication types

MeSH terms