. 2022 Mar;162(3):890-906.
doi: 10.1053/j.gastro.2021.11.037. Epub 2021 Dec 6.

The Origin and Contribution of Cancer-Associated Fibroblasts in Colorectal Carcinogenesis

Affiliations

The Origin and Contribution of Cancer-Associated Fibroblasts in Colorectal Carcinogenesis

Hiroki Kobayashi et al. Gastroenterology. 2022 Mar.

Abstract

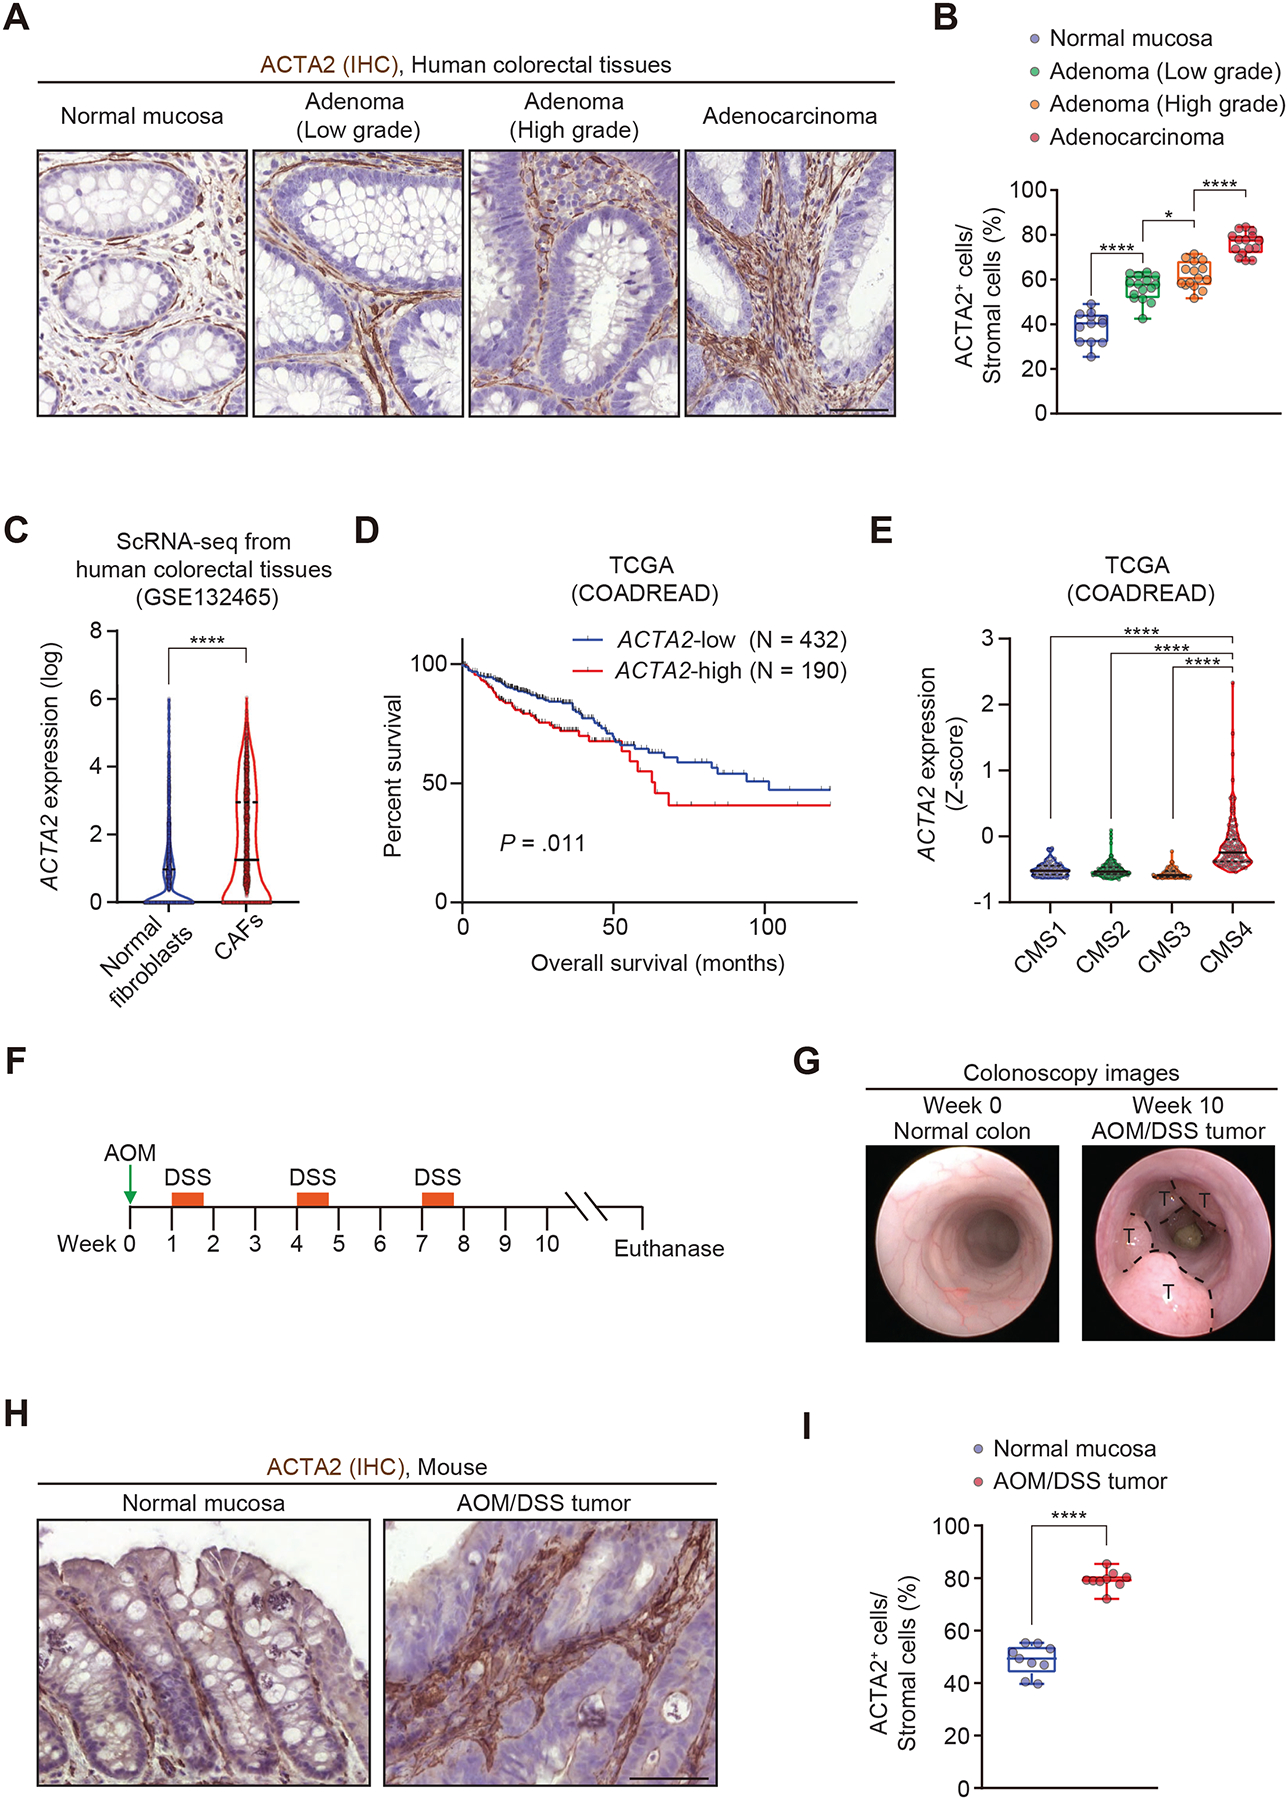
Background & aims: Cancer-associated fibroblasts (CAFs) play an important role in colorectal cancer (CRC) progression and predict poor prognosis in CRC patients. However, the cellular origins of CAFs remain unknown, making it challenging to therapeutically target these cells. Here, we aimed to identify the origins and contribution of colorectal CAFs associated with poor prognosis.

Methods: To elucidate CAF origins, we used a colitis-associated CRC mouse model in 5 different fate-mapping mouse lines with 5-bromodeoxyuridine dosing. RNA sequencing of fluorescence-activated cell sorting-purified CRC CAFs was performed to identify a potential therapeutic target in CAFs. To examine the prognostic significance of the stromal target, CRC patient RNA sequencing data and tissue microarray were used. CRC organoids were injected into the colons of knockout mice to assess the mechanism by which the stromal gene contributes to colorectal tumorigenesis.

Results: Our lineage-tracing studies revealed that in CRC, many ACTA2+ CAFs emerge through proliferation from intestinal pericryptal leptin receptor (Lepr)+ cells. These Lepr-lineage CAFs, in turn, express melanoma cell adhesion molecule (MCAM), a CRC stroma-specific marker that we identified with the use of RNA sequencing. High MCAM expression induced by transforming growth factor β was inversely associated with patient survival in human CRC. In mice, stromal Mcam knockout attenuated orthotopically injected colorectal tumoroid growth and improved survival through decreased tumor-associated macrophage recruitment. Mechanistically, fibroblast MCAM interacted with interleukin-1 receptor 1 to augment nuclear factor κB-IL34/CCL8 signaling that promotes macrophage chemotaxis.

Conclusions: In colorectal carcinogenesis, pericryptal Lepr-lineage cells proliferate to generate MCAM+ CAFs that shape the tumor-promoting immune microenvironment. Preventing the expansion/differentiation of Lepr-lineage CAFs or inhibiting MCAM activity could be effective therapeutic approaches for CRC.

Keywords: Alpha-Smooth Muscle Actin (αSMA); CD146; Colorectal Cancer; Tumor Microenvironment.


Conflict of interest statement

Disclosures

F.R. is a consultant to or on the advisory board of Agomab, Allergan, AbbVie, Boehringer-Ingelheim, Celgene/BMS, CDISC, Cowen, Genentech, Gilead, Gossamer, Guidepoint, Helmsley, Index Pharma, Jannsen, Koutif, Mestag, Metacrine, Morphic, Origo, Pfizer, Pliant, Prometheus Biosciences, Receptos, RedX, Roche, Samsung, Surrozen, Takeda, Techlab, Theravance, Thetis, and UCB. The remaining authors disclose no conflicts.

Figures

Figure 1:
Figure 1:. ACTA2 expression is increased during colorectal carcinogenesis in humans and mice.
(A, B) Immunohistochemistry (IHC) for ACTA2 in human colorectal samples. (A) Representative pictures. (B) ACTA2 positivity in total stromal cells (visualized by hematoxylin counterstaining). 3 high power fields (HPFs, 400x)/patient, 4–5 patients each. (C) Violin plots depict ACTA2 transcripts in normal fibroblasts (n = 2053 cells) and CRC CAFs (n = 1854 cells) assessed by single-cell RNA-sequencing (scRNA-seq) from human colorectal tissues. (D) Kaplan-Meier survival curves in The Cancer Genome Atlas (TCGA) dataset. (E) Violin plots showing ACTA2 expression level in four consensus molecular subtypes (CMS). n = 76, 220, 72, and 143 patients (CMS1-4). (F) Scheme for the experimental course of azoxymethane (AOM)/dextran sulfate sodium (DSS)-induced colorectal carcinogenesis. (G) Representative endoscopic images of the normal colon mucosa and AOM/DSS tumors. T, tumors. (H, I) Immunohistochemistry for ACTA2 in the normal mucosa and AOM/DSS tumors. (H) Representative pictures. (I) ACTA2 positivity in total stromal cells. 3 HPFs/mouse, 3 mice each. One-way ANOVA followed by Tukey’s post-hoc multiple comparison test (B), Wilcoxon rank-sum test (C), Log-rank test (D), Kruskal-Wallis test followed by Dunn’s multiple comparisons test (E), and two-tailed unpaired Student’s t-test (I). ****, P < 0.0001; **, P = 0.00299; *, P = 0.0451. Scale bars, 50 μm. In all figures, box plots have whiskers of maximum and minimum values; the boxes represent first, second (median), and third quartiles. In all violin plots, solid and dotted black lines denote median and quartiles, respectively.
Figure 2:
Figure 2:. A subset of ACTA2+ CAFs proliferate during colorectal carcinogenesis in humans and mice.
(A, B) Co-immunofluorescence for ACTA2 and Ki67 in human colorectal samples. (A) Representative pictures. Yellow arrowheads denote proliferating CAFs (ACTA2+Ki67+ cells). (B) Ki67 positivity in total ACTA2+ cells. 3 HPFs (400x)/patient, 4–5 patients each. (C) Scheme for the experimental course of AOM/DSS-induced colon carcinogenesis and 5-bromodeoxyuridine (BrdU) administration. After the end of the last DSS/water cycle, continuous BrdU administration was commenced once a visible tumor was observed via mouse colonoscopy. T, tumor. (D, E) Co-immunofluorescence for ACTA2, BrdU, and Ki67 in the normal colon mucosa and AOM/DSS tumors. (D) Representative images. Blue and yellow arrowheads denote ACTA2+BrdU and ACTA2+BrdU+ cells, respectively. (E) BrdU positivity (left) and Ki67 positivity (right) in total ACTA2+ cells. 3 HPFs/mouse, 3 mice each. ****, P < 0.0001; **, P = 0.0077; n.s., P = 0.0857. Kruskal-Wallis test followed by Dunn’s multiple comparisons test (B) and two-tailed unpaired Student’s t-test (E) Scale bars, 50 um.
Figure 3:
Figure 3:. Proliferating ACTA2+ fibroblasts in AOM/DSS tumors derive predominantly from Lepr-lineage cells.
(A) Immunofluorescence for ACTA2 and EPCAM in the normal colon mucosa and AOM/DSS tumors using fate-mapping mouse models. Yellow arrowheads denote lineage-marker+ACTA2+ cells. See Figure 3D for quantification. R26, Rosa26-loxP-stop-loxP; BM, bone marrow; BMT, bone marrow transplantation; TAM, tamoxifen. (B) Immunofluorescence for ACTA2 in the normal mucosa and AOM/DSS tumors using Krt19-Cre mice. (left). Immunofluorescence for ACTA2 and EPCAM in the normal mucosa and AOM/DSS tumor, using a wild-type recipient mouse transplanted with bone marrow cells from an Acta2-RFP mouse (right). (C) Immunofluorescence for ACTA2 and BrdU in AOM/DSS tumors using the BrdU-treated fate-mapping mouse models. Yellow arrowheads denote proliferating CAFs that were derived from each cellular lineage (lineage-marker+ACTA2+BrdU+ cells). (D) The ratio of lineage-marker+ cells in total ACTA2+ cells. 4 HPFs/mouse. 3 mice (Lepr-Cre, Grem1-CreERT2, Islr-CreERT2, Acta2-RFP) and 2 mice (Krt19-Cre). (E) The ratio of lineage marker+ cells in total proliferating CAFs. 4 HPFs/mouse. 3 mice each. (F, G) Cellular positions of Lepr-lineage stromal cells in the normal adult mouse colon. (F) Representative pictures. White arrowheads denote Lepr-lineage tdtomato+ cells. (G) Violin plots showing the positions of pericryptal Lepr-lineage stromal cells relative to the adjacent epithelial position. n = 81 Lepr-lineage cells from 3 mice. Scale bars, 50 μm. Two-tailed unpaired t-test with Welch’s correction (D) and Kruskal-Wallis test followed by Dunn’s multiple comparisons test (E). ****, P < 0.0001; **, P = 0.0030 (D); **, P = 0.0043 (E).
Figure 4:
Figure 4:. Identification of MCAM as a CRC mesenchyme-specific marker that represents a subset of Lepr-lineage proliferating cells.
(A) Experimental schematic for isolating colonic fibroblasts from the normal adult colon, AOM/DSS tumors, and postnatal day 14 colon. Gating strategy to isolate CD45Ter119CD31EPCAM fibroblasts by fluorescence-activated cell-sorting (FACS) is shown for one mouse adult normal colon. n = 4 mice each. (B) Strategy to identify a colonic stromal gene upregulated in development and carcinogenesis, which is associated with human CRC survival. (1) Venn diagram showing 342 genes upregulated in AOM/DSS tumors and postnatal day 14 colon, compared with the normal adult colon fibroblasts. (2) Survival analysis using TCGA dataset. (3) Using our RNA-seq data, genes upregulated in EPCAM CD31CD45Ter119 fibroblasts compared with EPCAM+ epithelial cells, both in the normal adult colon and AOM/DSS tumors, were selected. Mean ± s.e.m. (4) The Human protein atlas data were used to select genes whose protein expression was restricted to the CRC stroma. Mcam is highlighted in red. (C, D) Immunohistochemistry for MCAM. (C) Representative images. Blue, red, and green arrowheads denote MCAM expression in the normal adult colon, AOM/DSS tumor, and postnatal day 14 colon, respectively. (D) The ratio of MCAM+ cells in total stromal cells (visualized by hematoxylin counterstaining). 3 HPFs/mouse, 3 mice each. (E) Co-Immunofluorescence for MCAM and ACTA2 using AOM/DSS tumors from Lepr-Cre; Rosa26-tdtomato mice. Yellow arrowheads denote Lepr-lineage MCAM+ ACTA2+ CAFs. See Supplementary Figure 17C and D for quantification and separate channel images. (F, G) Co-immunofluorescence for MCAM and BrdU. (F) Representative images. Yellow arrowheads denote proliferating MCAM+ cells. (G) The ratio of MCAM+BrdU+ cells in total MCAM+ cells. 3 HPFs/mouse, 2–3 mice each. Scale bars, 50 μm. ****, P < 0.0001. Log-rank test (B(2)), one-way ANOVA followed by Tukey’s post-hoc multiple comparison test (B(3) and D), and two-tailed unpaired Student’s t-test (G)
Figure 5:
Figure 5:. High stromal MCAM expression driven, in part, by TGF-β, is associated with poor survival in patients with CRC.
(A, B) Immunohistochemistry for MCAM in human colorectal samples. (A) Representative pictures. (B) MCAM positivity in total stromal cells (visualized by hematoxylin counterstaining). 3 HPFs (400x)/patient, 4–5 patients each. (C) Violin plots showing MCAM expression levels in four CMSs. n = 76 (CMS1), 220 (CMS2), 72 (CMS3), and 143 patients (CMS4). (D) A mouse colonic fibroblast cell line, YH2, was incubated with vehicle, recombinant TGFβ1, or recombinant TGFβ1 + TGFβ1-receptor inhibitor (Galunisertib) for 24 hours, followed by quantitative reverse-transcription PCR (qRT-PCR). mean ± s.e.m. n = 3. (E) ScRNA-seq data show MCAM transcript levels are positively correlated with ACTA2 expression in colorectal CAFs. n = 1854 CAFs. Solid line, linear regression (F, G) MCAM immunohistochemistry in a CRC tissue microarray (F) Representative images and scoring system. (G) Kaplan-Meier survival curves. Scale bars, 50 μm. ****, P < 0.0001; *, P = 0.0124. Kruskal-Wallis test followed by Dunn’s multiple comparisons test (B and C), one-way ANOVA followed by Tukey’s post-hoc multiple comparison test (D), Spearman correlation (E), and Log-rank test (G).
Figure 6:
Figure 6:. Stromal MCAM promotes CRC progression via IL1R1-p65-IL34/CCL8 signaling-mediated macrophage recruitment.
(A) Experimental scheme showing orthotopic injection of ApcΔ/Δ, KrasG12D/ Δ, Trp53 Δ/Δ CRC organoids (AKP tumoroids) into the colon. WT, wild type; KO, knockout; IVIS, in vivo imaging system. (B) Kaplan-Meier survival curves. (C, D) Luciferase signals from AKP tumoroids were assessed by IVIS. 18 Mcam-WT and 16 KO mice. (E, F) Macroscopic evaluation of colon tumors. Mice were harvested 3 weeks after tumoroid injection. (E) Representative pictures. Dotted lines indicate tumors. (F) Quantification of tumor volumes. 2 injections/mouse, 8 Mcam-WT and 6 KO mice (G, H) Immunohistochemistry for CD68 and CD11b. (G) Representative pictures. M, macrophages as assessed by morphology. (H) 3,3’-Diaminobenzidine (DAB)-positive areas. A.U., arbitrary unit. (I) Venn diagram showing the overlap of 41 macrophage/monocyte chemoattractant genes identified by Gene Ontologies and 462 genes upregulated in MCAMhigh CAFs compared with MCAMlow CAFs (scRNA-seq data from GSE132465). (J, K, L) Lentivirus-mediated overexpression of MCAM augments IL-1β-p65-Il34/Ccl8 signaling in YH2 cells. MCAM-overexpressing or empty YH2 cells were stimulated with recombinant IL-1β, followed by Western blotting (WB; J, K) and qRT-PCR (L). mean ± s.e.m. n = 3 each. p-p65, phosphorylated p65. (M) Immunoprecipitation (IP) for MCAM-hemagglutinin (HA) tag with an anti-HA antibody, followed by western blotting. A green asterisk denotes the interaction of MCAM-HA with IL1R1. An anti-MYC antibody was used to detect IL1R1 protein tagged with MYC. Blue and red dotted boxes indicate mScarlet-HA and MCAM-HA proteins, respectively. (N, O) In situ hybridization (ISH) for Il34, Ccl8, and a negative control probe (bacterial DapB gene) (N) Representative pictures. Green dotted lines indicate borders between Stromal (S) and Epithelial (E) areas (visualized by hematoxylin counterstaining). Red arrowheads denote Il34+ or Ccl8+ stromal cells. (O) DAB+ areas in the tumor stroma. Scale bars, 200 μm (A), 2 mm (E), 50 μm (G and N) All histopathological analyses were performed using mice harvested 3 weeks after tumoroid injection. 3 HPFs (400x)/tumor, 1–2 tumors/mouse, 5 mice each group (H and O). Log-rank test (B), two-tailed unpaired t-test with Welch’s correction (D), Mann-Whitney U-test (F, H, and O), and two-way ANOVA followed by Tukey’s post-hoc multiple comparison test (K and L). ****, P ≤ 0.0001; ***, P ≤ 0.001; *, P ≤ 0.05; n.s., P > 0.05

Comment in

  • Origin of CAFs in colorectal cancer.
    Kotsiliti E. Kotsiliti E. Nat Rev Gastroenterol Hepatol. 2022 Feb;19(2):79. doi: 10.1038/s41575-021-00573-8. Nat Rev Gastroenterol Hepatol. 2022. PMID: 34983959 No abstract available.

References

    1. Kobayashi H, Enomoto A, Woods SL, et al. Cancer-associated fibroblasts in gastrointestinal cancer. Nat Rev Gastroenterol Hepatol 2019;16:282–295. - PubMed
    1. Lee HO, Hong Y, Etlioglu HE, et al. Lineage-dependent gene expression programs influence the immune landscape of colorectal cancer. Nat Genet 2020;52:594–603. - PubMed
    1. Kobayashi H, Gieniec KA, Wright JA, et al. The Balance of Stromal BMP Signaling Mediated by GREM1 and ISLR Drives Colorectal Carcinogenesis. Gastroenterology 2021;160:1224–1239 e30. - PMC - PubMed
    1. Ozdemir BC, Pentcheva-Hoang T, Carstens JL, et al. Depletion of carcinoma-associated fibroblasts and fibrosis induces immunosuppression and accelerates pancreas cancer with reduced survival. Cancer Cell 2014;25:719–34. - PMC - PubMed
    1. Bartoschek M, Oskolkov N, Bocci M, et al. Spatially and functionally distinct subclasses of breast cancer-associated fibroblasts revealed by single cell RNA sequencing. Nat Commun 2018;9:5150. - PMC - PubMed

Publication types

MeSH terms