. 2022 Feb;602(7895):106-111.
doi: 10.1038/s41586-021-04288-3. Epub 2021 Dec 9.

Malaria protection due to sickle haemoglobin depends on parasite genotype

Affiliations

Malaria protection due to sickle haemoglobin depends on parasite genotype

Gavin Band et al. Nature. 2022 Feb.

Abstract

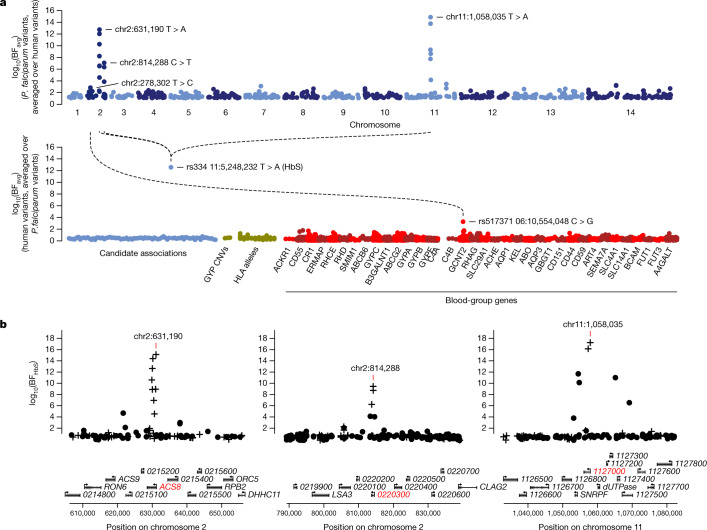
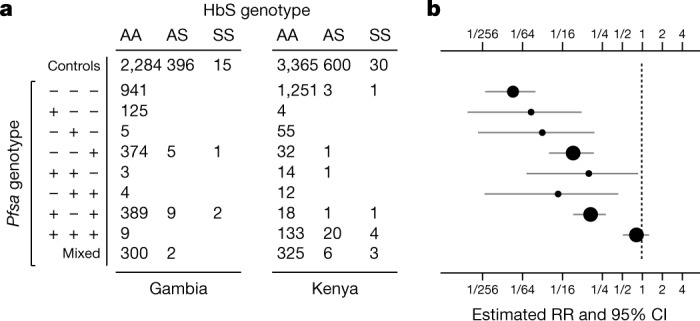
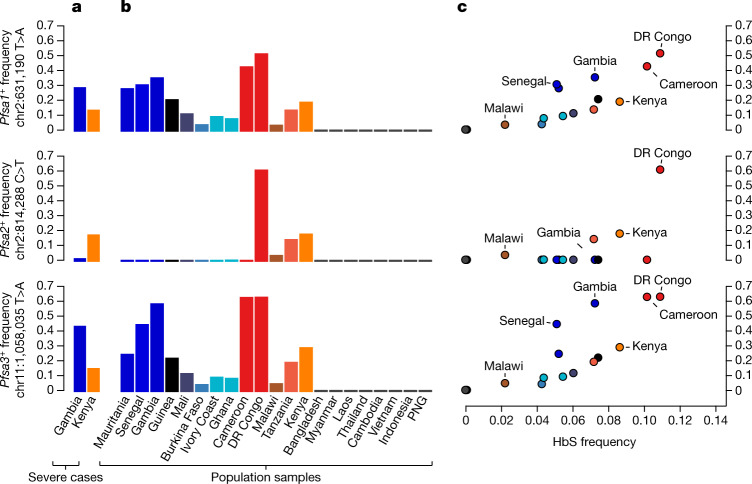
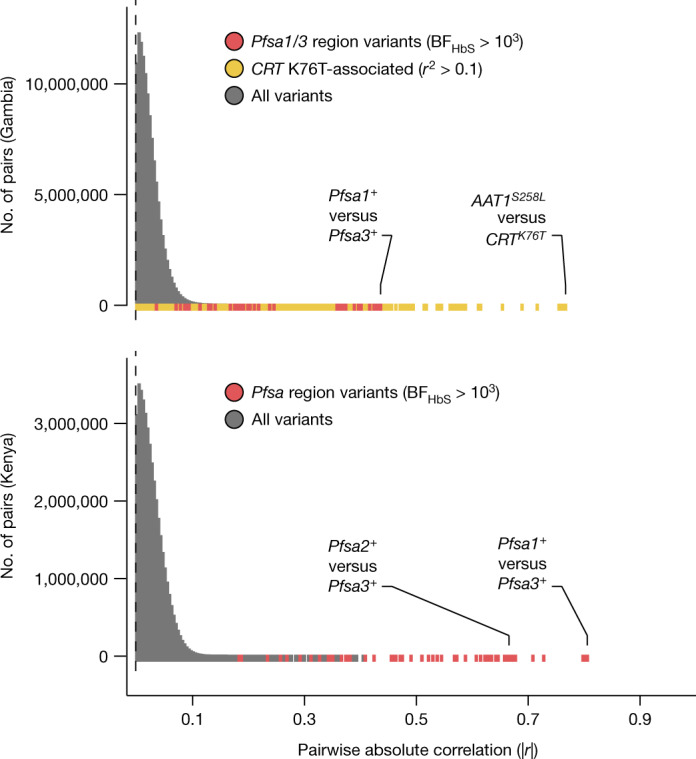
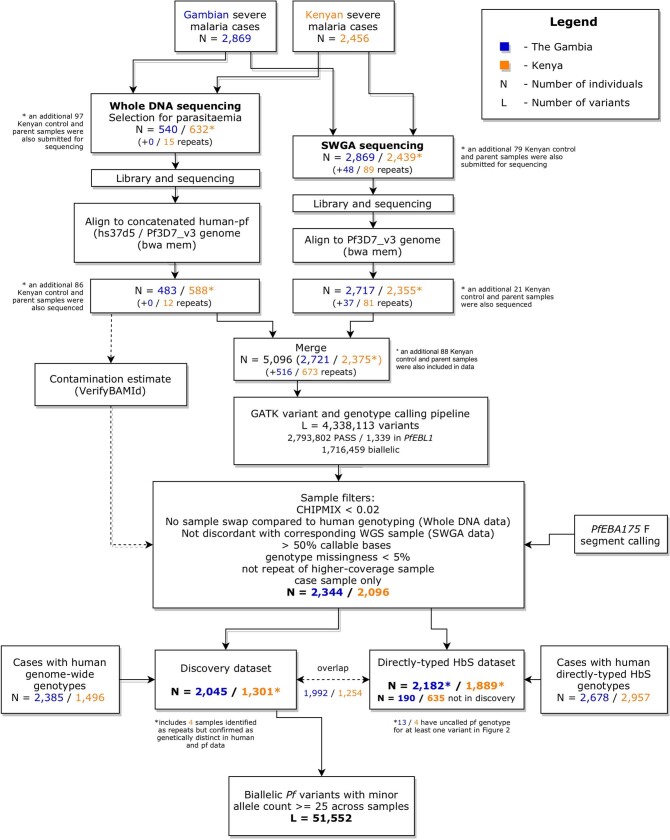
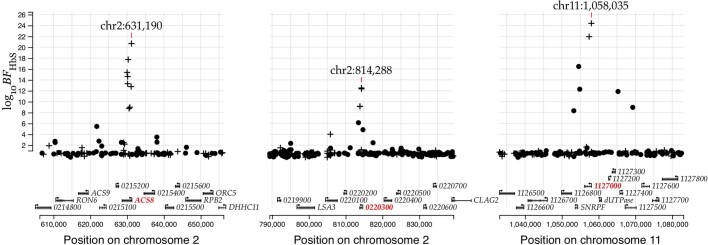
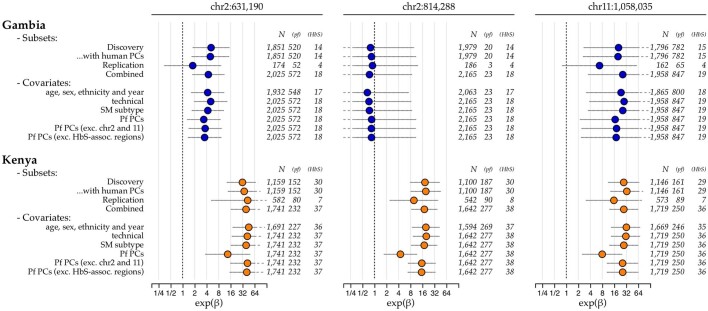
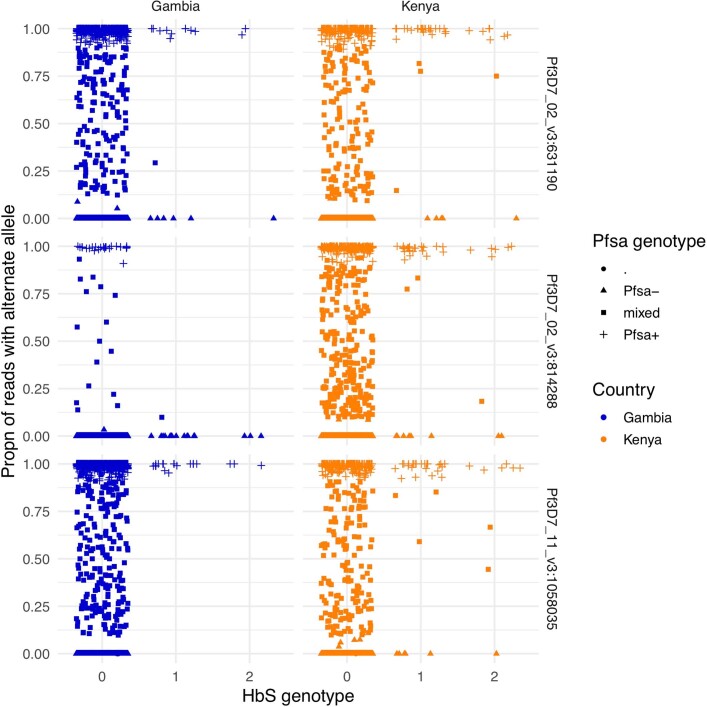
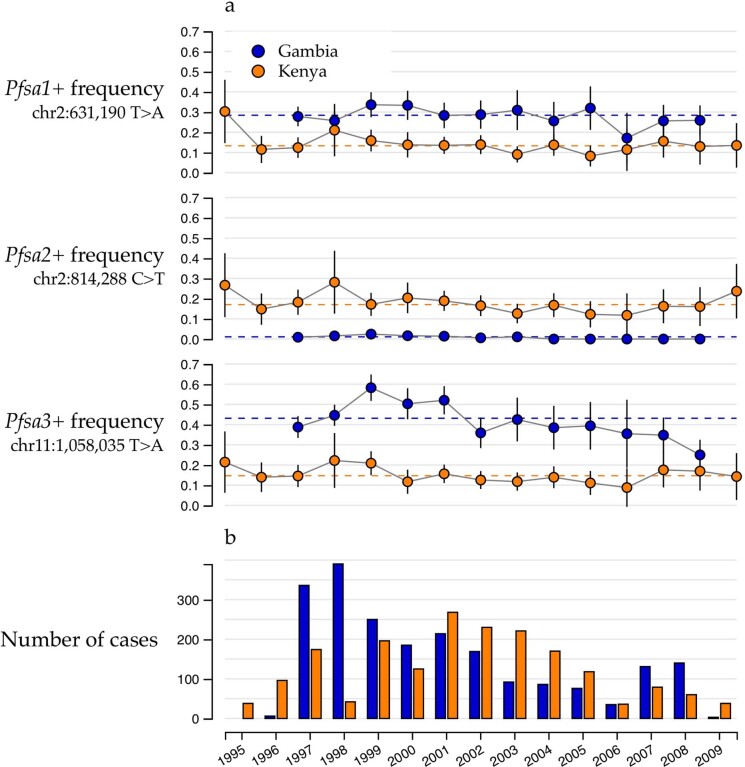
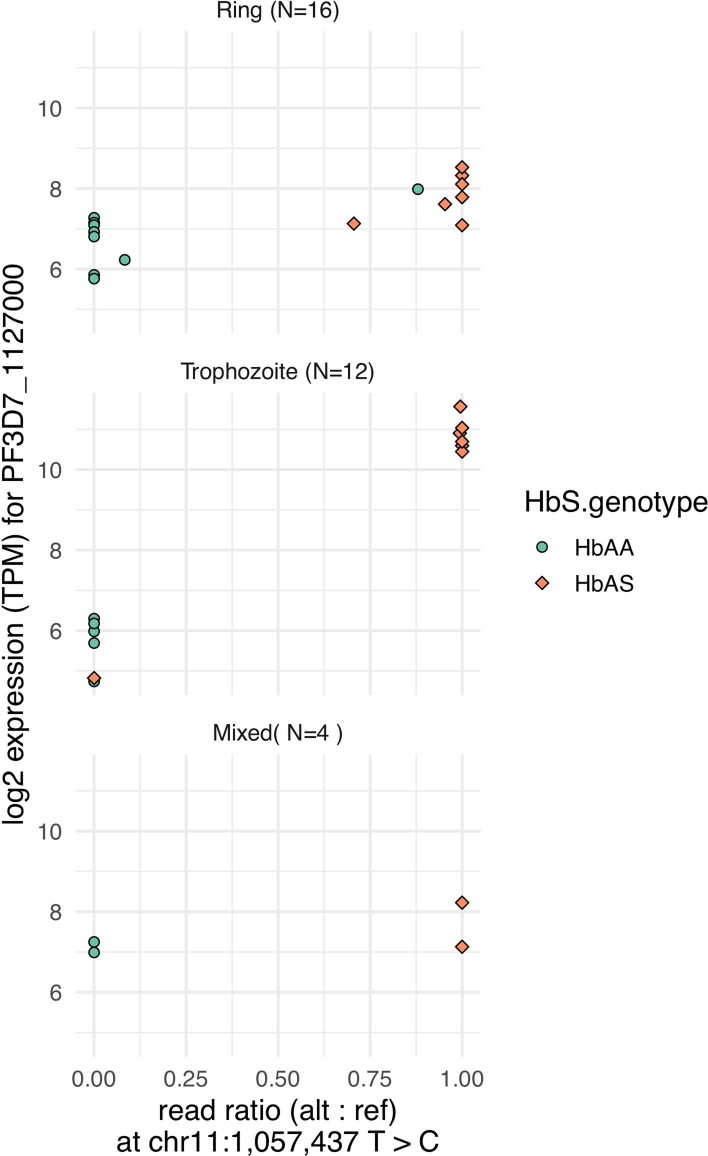
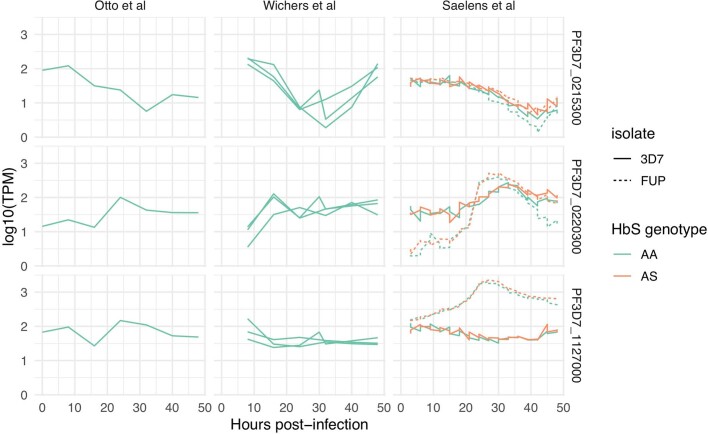
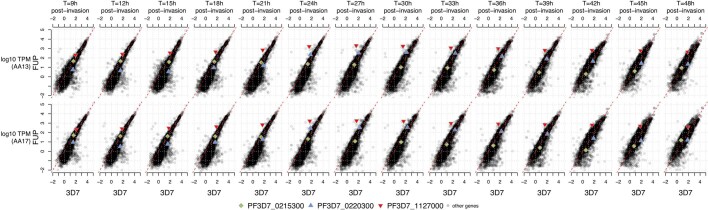
Host genetic factors can confer resistance against malaria1, raising the question of whether this has led to evolutionary adaptation of parasite populations. Here we searched for association between candidate host and parasite genetic variants in 3,346 Gambian and Kenyan children with severe malaria caused by Plasmodium falciparum. We identified a strong association between sickle haemoglobin (HbS) in the host and three regions of the parasite genome, which is not explained by population structure or other covariates, and which is replicated in additional samples. The HbS-associated alleles include nonsynonymous variants in the gene for the acyl-CoA synthetase family member2-4 PfACS8 on chromosome 2, in a second region of chromosome 2, and in a region containing structural variation on chromosome 11. The alleles are in strong linkage disequilibrium and have frequencies that covary with the frequency of HbS across populations, in particular being much more common in Africa than other parts of the world. The estimated protective effect of HbS against severe malaria, as determined by comparison of cases with population controls, varies greatly according to the parasite genotype at these three loci. These findings open up a new avenue of enquiry into the biological and epidemiological significance of the HbS-associated polymorphisms in the parasite genome and the evolutionary forces that have led to their high frequency and strong linkage disequilibrium in African P. falciparum populations.


Conflict of interest statement

The authors declare no competing interests.

Figures

Fig. 1
Fig. 1. Three regions of the P. falciparum genome are associated with HbS.
a, Points show the evidence for association between each P. falciparum variant and human genotypes (top row) or between each included human variant and P. falciparum genotypes (bottom row). Association evidence is summarized by averaging the evidence for pairwise association (Bayes factor (BF) for test in n = 3,346 samples) between each variant (points) and all variants in the other organism against which it was tested (log10 (BFavg)). P. falciparum variants are shown grouped by chromosome, and human variants are grouped by inclusion category as described in text and Methods. Dashed lines and variant annotations reflect pairwise tests with BF > 106; only the top signal in each association region pair is annotated (Methods). b, Detail of the association with HbS in the Pfsa1, Pfsa2 and Pfsa3 regions of the P. falciparum genome. Points show evidence for association with HbS (log10 (BFHbS)) for each regional variant. Variants that alter protein coding sequence are denoted by plus, and other variants are denoted by circles. Results are computed by logistic regression including an indicator of country as a covariate and assuming an additive model of association, with HbS genotypes based on imputation from genome-wide genotypes as previously described. Mixed and missing P. falciparum genotype calls were excluded from the computation. Below, regional genes are annotated, with gene symbols given where the gene has an ascribed name in the PlasmoDB annotation (after removing ‘PF3D7_’ from the name where relevant); the three genes containing the most-associated variants are shown in red. A corresponding plot using directly typed HbS genotypes is presented in Extended Data Fig. 2.
Fig. 2
Fig. 2. The estimated relative risk for HbS varies by Pfsa genotype.
a, Numbers of cases of severe malaria from the Gambia and Kenya with indicated HbS genotype (columns) and carrying the indicated alleles at the Pfsa1, Pfsa2 and Pfsa3 loci (rows; using n = 4,054 samples with directly typed HbS genotype and non-missing genotype at the three P. falciparum loci). Pfsa alleles positively associated with HbS are denoted + and those negatively associated with HbS are denoted − for the respective loci. Samples with mixed P. falciparum genotype calls for at least one of the loci are shown in the bottom row and further detailed in Extended Data Fig. 4. The first row indicates counts of HbS genotypes in population control samples from the same populations. b, The estimated relative risk of HbS for severe malaria with Pfsa genotypes (rows) as indicated in a. Relative risks were estimated using a multinomial logistic regression model with controls as the baseline outcome and assuming complete dominance (that is, that HbAS and HbSS genotypes have the same association with parasite genotype) as described in Supplementary Methods; an indicator of country was included as a covariate. Circles reflect posterior mean estimates and horizontal lines reflect the corresponding 95% credible intervals (CI). Estimates based on less than 5 individuals with HbAS or HbSS genotypes are represented by smaller circles. To reduce overfitting we used Stan to fit the model assuming a mild regularising Gaussian prior with mean zero and standard deviation of 2 on the log-odds scale (that is, with 95% of mass between 1/50 and 50 on the relative risk scale) for each parameter, and between-parameter correlations set to 0.5.
Fig. 3
Fig. 3. The relationship between Pfsa and HbS allele frequencies across populations.
a, Bars show the estimated frequency of each Pfsa+ allele in severe cases of malaria from each country. Details of allele frequencies and sample counts across years are presented in Extended Data Fig. 5. b, Estimated frequency of each Pfsa+ allele in worldwide populations from the MalariaGEN Pf6 resource, which contains samples collected during the period 2008–2015. Only countries with at least 50 samples are shown (this excludes Columbia, Peru, Benin, Nigeria, Ethiopia, Madagascar and Uganda). c, Estimated population-level Pfsa+ allele frequency (as in a, b) against HbS allele frequency in populations from MalariaGEN Pf6 (coloured as in b; selected populations are also labelled). Pfsa+ allele frequencies were computed from the relevant genotypes, after excluding mixed or missing genotype calls. HbS allele frequencies were computed from frequency estimates previously published by the Malaria Atlas Project for each country, by averaging over the locations of MalariaGEN Pf6 sampling sites weighted by the sample size. DR, Democratic Republic; PNG, Papua New Guinea.
Fig. 4
Fig. 4. HbS-associated variants show extreme between-chromosome correlation in severe P. falciparum infections.
Empirical distribution of absolute genotype correlation (|r|) between pairs of variants on different P. falciparum chromosomes in the Gambia (top) and Kenya (bottom). To avoid capturing direct effects of the HbS association, correlation values are computed after excluding HbS-carrying individuals. All pairs of biallelic variants with estimated minor allele frequency at least 5% and at least 75% of samples having non-missing and non-mixed genotype call are shown (totalling 16,487 variants in the Gambia and 13,766 variants in Kenya). Colours indicate the subset of comparisons between HbS-associated variants in Pfsa regions relevant for the population (red) and between variants in LD with the CRT K76T mutation. Labelled points denote the variant pairs showing the highest and second-highest pairwise correlation in each population after grouping correlated variants into regions; for this purpose regions were defined to include all nearby pairs of correlated variants with minor allele frequency ≥5% and r2 > 0.05, such that no other such pair of variants within 10 kb of the given region boundaries is present (Methods). A longer list of regions showing increased between-chromosome LD is presented in Supplementary Table 5.
Extended Data Fig. 1
Extended Data Fig. 1. Flowchart showing generation and processing of P.falciparum (Pf) sequence data from 5,096 severe malaria cases.
Flowchart shows sample processing from initial selection for whole DNA and Selective Whole genome Amplification (SWGA) pipelines (top) to the curated analysis datasets (bottom). Numbers in each box show counts of severe cases in The Gambia (blue) and Kenya (orange) with the number of individuals sequenced multiple times indicated in brackets. Following curation and QC of data (large box), available Pf data was intersected with two existing human genotype datasets to for the analyses described in main text. The combined pf/human imputed dataset has 3,346 samples and the combined pf/human direct typing dataset contains 4,071 individuals. These two datasets have substantial overlap; 825 individuals were represented in the directly-typed data but not the imputed data and were used for replication.
Extended Data Fig. 2
Extended Data Fig. 2. Evidence for association with HbS in three regions of the Pf genome using directly-typed HbS genotypes.
Points show evidence for association with HbS (log10 Bayes Factor for test in N = 4,071 samples, y axis) based on direct typing of HbS for variants in the Pfsa1, Pfsa2 and Pfsa3 regions of the Pf genome (panels). Variants which alter protein coding sequence are denoted by plusses, while other variants are denoted by circles. Results are computed by logistic regression including an indicator of country as a covariate and assuming an additive model of association; missing and mixed Pf genotype calls were excluded. A corresponding plot using imputed HbS genotypes can be found in Fig. 1. The variant with the strongest association in each region is annotated and the panels show regions of length 50kb centred at this variant. Below, regional genes are annotated, with gene symbols given where the gene has an ascribed name in the PlasmoDB annotation (after removing 'PF3D7_' from the name where relevant); the three genes containing the most-associated variants are shown in red.
Extended Data Fig. 3
Extended Data Fig. 3. Odds ratios for association of HbS with the Pfsa variants in severe malaria cases.
Plot shows parameter estimates (points) and 95% posterior credible intervals (horizontal line segments) for the association of HbS with Pf genotype at each of the three Pfsa lead variants (columns), using several combinations of sample subsets and covariates (rows) in The Gambia and Kenya. Estimates are computed separately for each SNP using logistic regression with the given covariates included as fixed-effect terms, and are based on directly-typed HbS genotypes assuming a dominance model of HbS on Pf genotype. Samples with mixed Pf genotype calls are excluded from the regression. All estimates are made using a weakly-informative log-F(2,2) prior (Supplementary Methods) on the genetic effect; a diffuse log-F(0.08,0.08) prior is also applied to covariate effects. Row names are as follows: "Discovery": samples with human genome-wide imputed data that were included in our initial scan (Fig. 1); "Replication": the 825 additional samples that are not closely related to discovery samples (as determined previously); "Combined": all samples with direct typing (as in Fig. 2 and Extended Data Fig. 2); "technical": indicators of sequencing performance including indicator of SWGA or whole DNA sequencing method for the sample, sequence read depth, insert size, and proportion of mixed genotype calls; "SM subtype": indicator of clinical presentation (cerebral malaria, severe malarial anaemia or other severe malaria) the individual was ascertained with; "Pf PCs": principal components (PCs) computed using all called biallelic SNPs having minor allele frequency at least 1% in each population and thinned to exclude variants closer than 1kb; additional rows are shown for PCs computed after excluding SNPs in chromosomes 2 and 11, or from the three regions of association shown in Fig. 1 plus a 25kb margin. Numbers to the right of each estimate show the total regression sample size, the number of samples having the non-reference allele at the given Pf SNP, and the number heterozygous or homozygous for HbS.
Extended Data Fig. 4
Extended Data Fig. 4. Allele read ratio versus HbS genotype at the three HbS-associated loci.
For each sample (points) and each of the three HbS-associated loci (rows), the figure shows the proportion of sequencing reads that carry the nonreference allele (y axis). Points are separated by country (columns) and HbS genotype (x axis); the x axis values are jittered to visually separate. The called Pf genotype of each sample is indicated by the shape, with mixed calls indicated by squares.
Extended Data Fig. 5
Extended Data Fig. 5. Pfsa+ allele frequency and sample size by year of ascertainment.
a) points show the sample allele frequency (y axis) for each Pfsa variant (rows) in severe malaria cases by year of ascertainment (x axis) and country (colour). Vertical line segments show the 95% confidence interval corresponding to each estimate. Horizontal dashed lines show the overall estimate across all years in our data, as in Fig. 3a. b) Bars show the total number of severe case samples in our dataset (y axis) in each country (colour) by year of ascertainment (x axis).
Extended Data Fig. 6
Extended Data Fig. 6. Pfsa3+ genotypes are correlated with PF3D7_1127000 transcript levels in trophozoite-stage infections.
Plot shows the ratio of RNA-seq reads carrying the non-reference allele at the chr11:1,057,437 T > C mutation (x axis) against the estimated transcript abundance of PF3D7_1127000 (log2 TPM, y axis), for 32 children from Mali ascertained with HbAA or HbAS genotype (colours, as detailed in the legend). Underlying data is as published by Saelens et al and is further detailed in Supplementary Table 6. The plot is separated by parasite stage (panel labels) as previously inferred. Among trophozoite-stage infections, we noted one infection of an HbAS individual (AS08) that has low expression of PF3D7_1127000 (TPM = 28.3); this sample appears to have Pfsa3- genotype although we caution that only two reads with reasonable mapping quality were observed. Conversely, one ring-stage infection of an HbAA genotype individual (AA01) has relatively high expression (TPM = 253.2) of PF3D7_1127000; this sample is likely mixed as it appears to express gene copies with both Pfsa3- and Pfsa3+ genotypes, with Pfsa3+ predominant.
Extended Data Fig. 7
Extended Data Fig. 7. Estimated abundance of Pfsa region gene transcripts from in vitro intraerythrocytic time course experiments.
Plot shows the estimated relative transcript abundance (log10 TPM, y axis) against hours post-infection of erythrocytes (x axis) for the three Pfsa region genes containing nonsynonymous sickle-associated polymorphisms (Supplementary Table 1). Data is from three studies which analysed the 3D7 isolate (Otto et al, Wichers et al and Saelens et al) as indicated by columns; the Saelens et al study also analysed the FUP/H isolate (dashed lines). Time points can be roughly interpreted as: ring stage (~0-16h post-invasion); trophozoite stage (16-40h post-invasion); schizont stage (40-48h post-invasion). Replicate experiments are indicated by multiple lines in each panel; colours indicate the HbS genotype of the erythrocytes used as noted in the legend. TPM values are estimated based on reads aligning to the 3D7 reference genome; for the Saelens et al study these were used as reported previously while for the other studies we recomputed TPM as described in Methods.
Extended Data Fig. 8
Extended Data Fig. 8. Estimated abundance of all transcripts in 3D7 and FUP/H parasites across the intraerythrocytic time course.
Plot shows the estimated relative transcript abundance (TPM) of P.falciparum genes measured in 3D7 (x axis) and in FUP/H (Uganda Palo Alto, y axis) parasites, using the data reported by Saelens et al. Transcript abundance is measured in vitro using erythrocytes from two HbAA genotype individuals (rows), and at multiple time points post-infection (columns). TPM is measured by alignment to the 3D7 genome followed transcript quantification as described by Saelens et al. The genes PF3D7_0215300 (PfACS8, Pfsa1 locus), PF3D7_0220300 (Pfsa2 locus), and PF3D7_1127000 (Pfsa3 locus) are denoted by coloured points as shown in the legend. Both PF3D7_1127000 and to a lesser extent PF3D7_0220300 show an increase in expression at trophozoite stage in FUP/H parasites. We determined the genotypes of FUP/H. We determined the Pfsa genotypes of FUP/H as + + + (using the notation of Fig. 2) by aligning available short-read sequencing reads (SRA accessions SRR530503, SRR629055, and SRR629078; Broad Institute 2014).
Extended Data Fig. 9
Extended Data Fig. 9. Structural variation at the Pfsa3 locus.
Plot shows all DNA segments of length 50 (50-mers) that are shared identically between the 3D7 genome assembly (x axis) and CD01 genome assembly (y axis) in the Pfsa3 region. Points near the diagonal indicate similar structure, while sequences of off-diagonal points indicate structural differences between genomes. Coloured regions indicate approximate regions of 3D7 that contain increased copy number (light blue) or deletions (light yellow) in CD01 relative to 3D7. Segment endpoints are determined by inspection of shared kmer locations and are: 1,053,925 - 1055024 (duplication); 1,055,395-1,055,784 (deletion); 1,058,765-1,059,087 (deletion); 1,059,675-1,059,777 (triplication). The CD01 assembly carries Pfsa1+, Pfsa2+ and Pfsa3+ alleles. Comparisons of 3D7 to other available assembled Pf genomes in Pfsa regions can be found in Supplementary Fig. 3.

Similar articles

Cited by

References

    1. Kariuki SN, Williams TN. Human genetics and malaria resistance. Hum. Genet. 2020;139:801–811. - PMC - PubMed
    1. Bethke LL, et al. Duplication, gene conversion, and genetic diversity in the species-specific acyl-CoA synthetase gene family of Plasmodium falciparum. Mol. Biochem. Parasitol. 2006;150:10–24. - PubMed
    1. Matesanz F, Téllez MA-D-M, Alcina A. The Plasmodium falciparum fatty acyl-CoA synthetase family (PfACS) and differential stage-specific expression in infected erythrocytes. Mol. Biochem. Parasitol. 2003;126:109–112. - PubMed
    1. Otto TD, et al. Genomes of all known members of a Plasmodium subgenus reveal paths to virulent human malaria. Nat. Microbiol. 2018;3:687–697. - PMC - PubMed
    1. Malaria Genomic Epidemiology Network. Reappraisal of known malaria resistance loci in a large multicenter study. Nat. Genet. 2014;46:1197–1204. - PMC - PubMed

Publication types

Substances