. 2021 Dec 16;49(22):13000-13018.
doi: 10.1093/nar/gkab1142.

TIN2 is an architectural protein that facilitates TRF2-mediated trans- and cis-interactions on telomeric DNA

Affiliations

TIN2 is an architectural protein that facilitates TRF2-mediated trans- and cis-interactions on telomeric DNA

Parminder Kaur et al. Nucleic Acids Res. .

Abstract

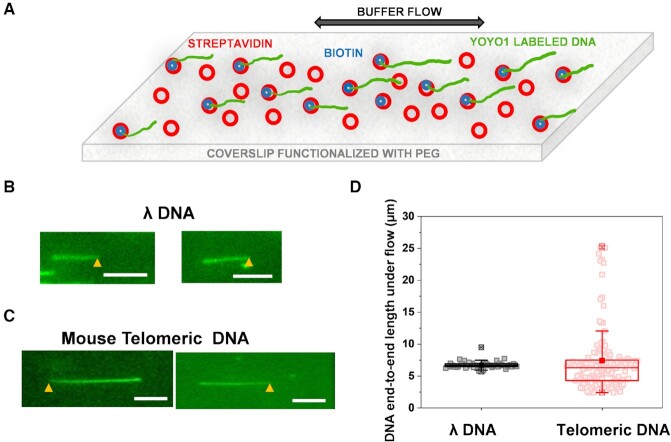
The telomere specific shelterin complex, which includes TRF1, TRF2, RAP1, TIN2, TPP1 and POT1, prevents spurious recognition of telomeres as double-strand DNA breaks and regulates telomerase and DNA repair activities at telomeres. TIN2 is a key component of the shelterin complex that directly interacts with TRF1, TRF2 and TPP1. In vivo, the large majority of TRF1 and TRF2 are in complex with TIN2 but without TPP1 and POT1. Since knockdown of TIN2 also removes TRF1 and TRF2 from telomeres, previous cell-based assays only provide information on downstream effects after the loss of TRF1/TRF2 and TIN2. Here, we investigated DNA structures promoted by TRF2-TIN2 using single-molecule imaging platforms, including tracking of compaction of long mouse telomeric DNA using fluorescence imaging, atomic force microscopy (AFM) imaging of protein-DNA structures, and monitoring of DNA-DNA and DNA-RNA bridging using the DNA tightrope assay. These techniques enabled us to uncover previously unknown unique activities of TIN2. TIN2S and TIN2L isoforms facilitate TRF2-mediated telomeric DNA compaction (cis-interactions), dsDNA-dsDNA, dsDNA-ssDNA and dsDNA-ssRNA bridging (trans-interactions). Furthermore, TIN2 facilitates TRF2-mediated T-loop formation. We propose a molecular model in which TIN2 functions as an architectural protein to promote TRF2-mediated trans and cis higher-order nucleic acid structures at telomeres.


Figures

Figure 1.
Figure 1.
Purification of long telomeric DNA from the mouse liver tissue using the region-specific extraction (RSE) method. (A) Schematics of the RSE method for purifying mouse telomeric DNA. (B) An AFM image of genomic DNA purified from the mouse liver tissue. XY scale bar = 1 μm. (C) Agarose gel electrophoresis showing purified mouse genomic DNA and genomic DNA digested with a cocktail of four restriction enzymes. (D) Dot-Blot assay validating the purity of mouse telomeric DNA obtained from the RSE method. Various amounts of undigested genomic DNA and the telomeric DNA purified using the RSE method were loaded on to a membrane that was hybridized with either a radiolabeled telomere (left panel) or Alu repeat DNA probe (right panel). Telomeric DNA preparations using 2×, 5× and 10 × molar excess of the complementary capture primers relative to the estimated telomeric fragments were tested.
Figure 2.
Figure 2.
Flow-stretching of λ DNA and mouse telomeric DNA purified using the RSE method. (A) Schematics of flow stretching of YOYO1-stained DNA that was anchored onto the surface at one end through biotin-streptavidin interactions. (B and C) Fluorescence images of flow stretched λ DNA anchored through the biotinylated primer annealed to the overhang (B), and RSE-purified mouse telomeric DNA anchored onto the surface through biotins on the primer annealed to the 3′ overhang (C); scale bar: 5 μm. The yellow arrows represent the DNA anchoring points. (D) Box plots (range 25–75 percentile) of the length of the flow-stretched λ and telomeric DNA purified using the RSE method. λ DNA: N = 52, 6.7 μm ± 0.6 μm (mean ± STD); telomeric DNA: N = 133, 7.4 μm ± 5.2 μm (mean ± STD). Mean formula image, max and min formula image, 99%, and 1% formula image are represented by these symbols in the box plot.
Figure 3.
Figure 3.
TRF2 loads TIN2 specifically at telomeric regions on LT270 DNA tightropes. (A) Schematics of the ligated T270 DNA (LT270) substrate for generating DNA tightropes. (B) QD-labeling scheme: HA-tagged TIN2 conjugated to HA antibody-coated QDs (HA-Ab-QDs). (C) TIN2-QDs do not bind to LT270 DNA tightropes in the absence of TRF2. DNA was stained with YOYO1 (left panel) after the introduction of TIN2L-QDs (right panel) into the flow cell. (D) QD-labeled TIN2 on LT270 DNA tightropes in the presence of unlabeled TRF2. Representative fluorescence images (top panels) and kymographs (bottom panels) of red (655 nm) HA-Ab-QD-labeled TIN2S (TIN2S-QD, left panel) and TIN2L (TIN2L-QD, right panel). (E) Histograms representing the distance between two adjacent TIN2S-QD or TIN2L-QD complexes on LT270 DNA tightropes. Fitting the data with Gaussian functions shows peaks centered at 1.5 μm ± 0.6 μm (mean ± STD) for TRF2-TIN2S-QD (N = 538, R2> 0.98), and 1.4 μm ± 0.5 μm for TRF2-TIN2L-QD (N = 288, R2> 0.98). (F) Co-localization of TRF2-QD and TIN2-QD on L270 DNA tightropes; N = 42 observations.
Figure 4.
Figure 4.
TIN2 facilitates TRF2-mediated compaction of long mouse telomeric DNA. (A) Model depicting the formation of compacted DNA structures on incubating end-anchored telomeric DNA with TRF2 and TIN2. YOYO1-stained mouse telomeric DNA was anchored at one end through the linkage between the biotin on the primer annealed to the 3′ overhang and streptavidin-coated glass coverslip surface. (BD) Examples of telomeric DNA compaction mediated by QD-labeled TRF2 (B), unlabeled TRF2–TIN2S and TRF2–TIN2L (C), and unlabeled TRF2 and QD-labeled TIN2S (D). (B) His-tagged TRF2 was labeled with the strep-QD through the BTTris-NTA linker. (D) HA–TIN2S was labeled with the HA–Ab–QD using the antibody sandwich method. White arrows: buffer flow directions. Black arrows: DNA anchoring points. Green-blue arrows: compacted beadlike structures. The numbers are total lengths of the video in seconds; scale bar: 5 μm. (E) Box plots (range 25–75 percentile) comparing compaction of λ DNA by TRF2 (N = 43, 2.3% ± 3.8%) and telomeric DNA by TRF2 (N = 91, 22.1% ± 25.3%), TRF2–TIN2S (N = 55, 56.3% ± 27.8%) and TRF2–TIN2L (N = 46, 65.0% ± 21.8%). % compaction is reported as mean ± STD. TRF2: 100 nM dimer; TIN2: 100 nM. Mean formula image, max and min formula image, 99% and 1% formula image are represented by these symbols in the box plot; P < 10–5 *, P < 10–11***.
Figure 5.
Figure 5.
Facilitation of TRF2-mediated telomeric DNA compaction by TIN2 revealed by AFM imaging. (A and B) Representative AFM images of pT270 fragment (1.6 kb) with (A) TRF2 alone (80 nM dimer), and (B) TRF2 and increasing concentrations of TIN2S and TIN2L. XY scale bar = 100 nm. (C) DNA contour lengths of the linear pT270 fragments alone, with TRF2 only, or with TRF2 and TIN2. DNA only: N = 75, 605 ± 2 nm; +TRF2: N = 119, 550 ± 10 nm; +TRF2 + TIN2S (80 nM): N = 138, 520 ± 12 nm; +TRF2 + TIN2S (120 nM): N = 261, 514 ± 10 nm; +TRF2 + TIN2S (200 nM): N = 168, 386 ± 18 nm; +TRF2 + TIN2L (80 nM): N = 118, 537 ± 12 nm; +TRF2 + TIN2L (120 nM): N = 141, 532 ± 11 nm; +TRF2 + TIN2L (200 nM): N = 140, 479 ± 16 nm. The error bars represent SEM from two independent data sets.
Figure 6.
Figure 6.
TIN2 enhances TRF2-mediated double-stranded telomeric DNA–DNA bridging. (A) Schematics depicting the strategy to monitor protein meditated double-stranded DNA–DNA bridging using the DNA tightrope assay. DNA tightropes were incubated with TRF2 (25 nM dimer) without or with TIN2 (10 nM) before introducing QD-labeled linear double-stranded pT270 fragment (QDpT270, 1.6 kb, 50 nM) and TRF2 (25 nM dimer) either without or with TIN2 (10 nM). (B) Representative fluorescence images (top panels) and kymographs (bottom panels) of the QDpT270 DNA bridged onto LT270 DNA tightropes by TRF2 alone, TRF2-TIN2S and TRF2-TIN2L. (C) Histograms and fitting using Gaussian function of the spacing between QDpT270 DNA fragments bridged on to the LT270 tightropes by TRF2 alone (N = 215, 1.43 μm ± 0.02 μm, R2= 0.93), TRF2-TIN2S (N = 229, 1.45 μm ± 0.04 μm, R2= 0.96) and TRF2-TIN2L (N = 212, 1.64 μm ± 0.02 μm, R2= 0.98) (Gaussian peak ± STD). (D) Intensities (arbitrary units: a.u.) of QDpT270 on LT270 DNA tightropes mediated by TRF2 (N = 183), TRF2-TIN2S (N = 148) and TRF2-TIN2L (N = 180) with their standard deviations from two independent data sets. P < 0.05 *, P < 10–36 ***.
Figure 7.
Figure 7.
TIN2 enhances TRF2-mediated bridging of telomeric ssDNA and ssRNA to LT270 dsDNA tightropes. LT270 DNA tightropes were incubated with TRF2 (25 nM dimer) without or with TIN2 (10 nM) before introducing QD-labeled single-stranded TTAGGG-12 (QDTTAGGG-12), or UUAGGG-12 (QDUUAGGG-12, 50 nM) along with TRF2 (25 nM dimer) either without or with TIN2 (10 nM). (A and B) Representative fluorescence images (top panels) and kymographs (bottom panels) of the QDTTAGGG-12 DNA (A) and QDUUAGGGG-12 RNA (B) bridged onto LT270 DNA tightropes by TRF2 alone, TRF2-TIN2S and TRF2-TIN2L. (C) Histograms and fitting using Gaussian function (R2> 0.94) of the spacing between QDTTAGGG-12 and QDUUAGGG-12 on LT270 tightropes, mediated by TRF2, TRF2-TIN2S and TRF2-TIN2L proteins. QDTTAGGG-12: TRF2 alone (N = 172, 1.72 ± 0.01 μm), TRF2-TIN2S (N = 202, 1.54 ± 0.01 μm), TRF2-TIN2L (N = 175, 1.38 ± 0.01 μm). QDUUAGGG-12: TRF2 alone (N = 223, 1.55 ± 0.01 μm), TRF2-TIN2S (N = 322, 1.35 ± 0.01 μm), TRF2-TIN2L (N = 227, 1.58 ± 0.03 μm). (D) Comparing intensities (arbitrary unit: a.u.) of QDTTAGGG-12 and QDUUAGGG-12 bridged onto LT270 DNA tightropes mediated by TRF2 (NTTAGGG= 153, NUUAGGG= 162), TRF2-TIN2S (NTTAGGG= 108, NUUAGGG= 137) and TRF2-TIN2L (NTTAGGG= 225, NUUAGGG= 76) with their standard deviations from two independent data sets; P < 10–12–10–24 ***.
Figure 8.
Figure 8.
TIN2 facilitates TRF2-mediated T-loop formation. (A) Blocking and marking of the 3′ overhang at the genomic DNA end on the linear T270 DNA substrate (5.4 kb). Position distribution of strep-QDs on the linear T270 DNA after treatment with T7 exonuclease and annealing of a biotinylated primer to the 3′ overhang at the genomic DNA end. Insert: an AFM image of T7 exonuclease-treated linear T270 DNA with a strep-QD at one DNA end; XY scale bar = 100 nm. (B) AFM images of T-loops formed on the linear T270 DNA with the nontelomeric end labeled with QDs in the presence of TRF2 (25 nM dimer); XY scale bar = 100 nm. (C) Percentages of T-loop formation on the linear T270 DNA with a 3′ overhang at different TRF2 concentrations. TRF2 dimer concentrations tested: 12.5 nM (N = 832, 3.1%), 18 nM (N = 1114, 3.5%), 20 nM (N = 445, 7.0%), 25 nM (N = 332, 10.2%), 30 nM (N = 276, 5.4%), 35.5 nM (N = 269, 6.7%), 40 nM (N = 88, 4.5%). (D) AFM images of T-loop formed in the presence of TRF2-TIN2L on the linear T270 DNA with a 3′ overhang; XY scale bar = 100 nm. (E) Percentages of T270 DNA molecules with loop formation at a fixed TRF2 concentration (25 nM dimer) and increasing concentrations of TIN2L. No overhang control DNA: T270 DNA without T7 exonuclease treatment. All other data sets: T270 DNA with T7 exonuclease treatment. The data were pooled from at least three independent experiments. N = 912–2463 DNA molecules for each condition.
Figure 9.
Figure 9.
TIN2 facilitates TRF2-mediated trans- and cis-interactions on telomeric DNA. Results from AFM imaging and the DNA tightrope assay demonstrate that TRF2 facilitates TRF2-mediated telomeric DNA compaction, T-loop formation, and bridging of dsDNA, ssDNA and ssRNA (TERRA) to duplex DNA. ssDNA is relevant in the context of the 3′ overhang.

Similar articles

Cited by

References

    1. Palm W., de Lange T.. How shelterin protects mammalian telomeres. Annu. Rev. Genet. 2008; 42:301–334. - PubMed
    1. Muraki K., Nyhan K., Han L., Murnane J.P.. Mechanisms of telomere loss and their consequences for chromosome instability. Front. Oncol. 2012; 2:135. - PMC - PubMed
    1. Wright W.E., Tesmer V.M., Huffman K.E., Levene S.D., Shay J.W.. Normal human chromosomes have long G-rich telomeric overhangs at one end. Genes Dev. 1997; 11:2801–2809. - PMC - PubMed
    1. Cech T.R. Beginning to understand the end of the chromosome. Cell. 2004; 116:273–279. - PubMed
    1. Songyang Z., Liu D. Inside the mammalian telomere interactome: regulation and regulatory activities of telomeres. Crit. Rev. Eukaryot. Gene Expr. 2006; 16:103–118. - PubMed

Publication types