

Improving Automatic Renal Segmentation in Clinically Normal and Abnormal Paediatric DCE-MRI via Contrast Maximisation and Convolutional Networks for Computing Markers of Kidney Function
- PMID: 34883946
- PMCID: PMC8659486
- DOI: 10.3390/s21237942
Improving Automatic Renal Segmentation in Clinically Normal and Abnormal Paediatric DCE-MRI via Contrast Maximisation and Convolutional Networks for Computing Markers of Kidney Function
Abstract
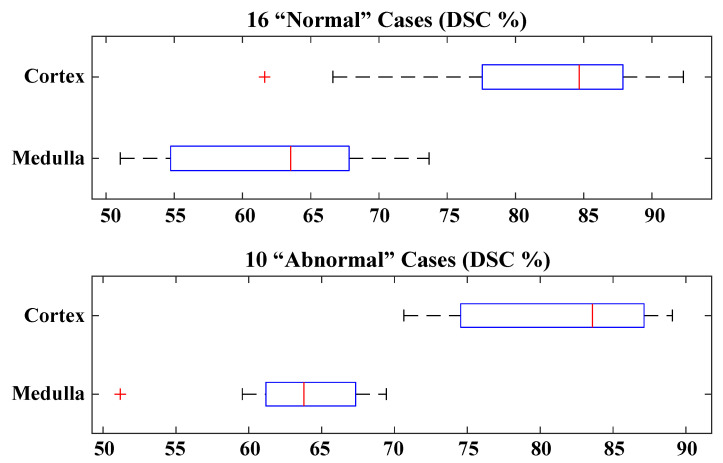
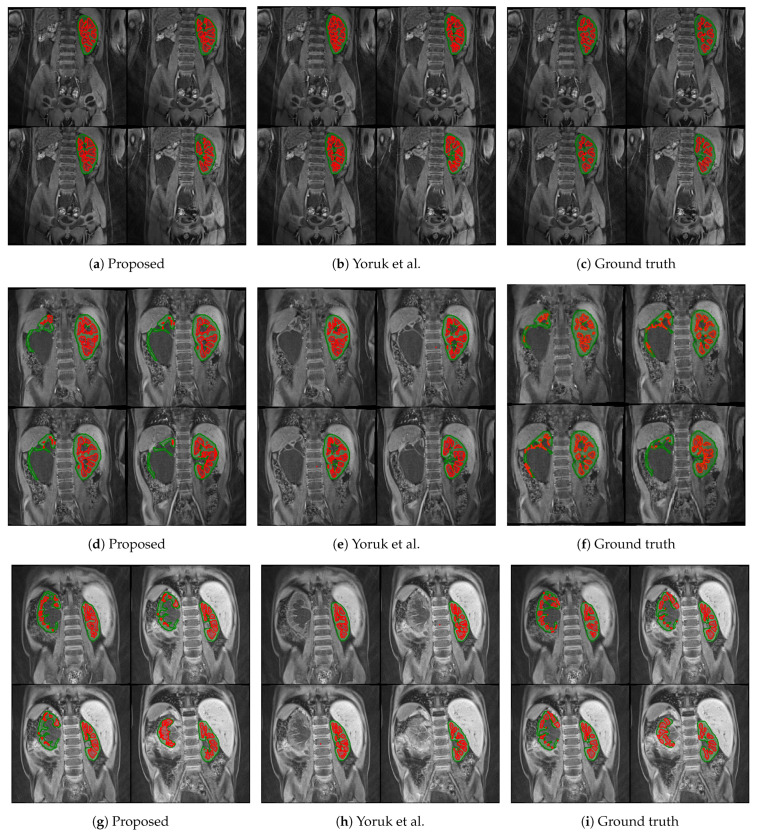
There is a growing demand for fast, accurate computation of clinical markers to improve renal function and anatomy assessment with a single study. However, conventional techniques have limitations leading to overestimations of kidney function or failure to provide sufficient spatial resolution to target the disease location. In contrast, the computer-aided analysis of dynamic contrast-enhanced (DCE) magnetic resonance imaging (MRI) could generate significant markers, including the glomerular filtration rate (GFR) and time-intensity curves of the cortex and medulla for determining obstruction in the urinary tract. This paper presents a dual-stage fully modular framework for automatic renal compartment segmentation in 4D DCE-MRI volumes. (1) Memory-efficient 3D deep learning is integrated to localise each kidney by harnessing residual convolutional neural networks for improved convergence; segmentation is performed by efficiently learning spatial-temporal information coupled with boundary-preserving fully convolutional dense nets. (2) Renal contextual information is enhanced via non-linear transformation to segment the cortex and medulla. The proposed framework is evaluated on a paediatric dataset containing 60 4D DCE-MRI volumes exhibiting varying conditions affecting kidney function. Our technique outperforms a state-of-the-art approach based on a GrabCut and support vector machine classifier in mean dice similarity (DSC) by 3.8% and demonstrates higher statistical stability with lower standard deviation by 12.4% and 15.7% for cortex and medulla segmentation, respectively.
Keywords: DCE-MRI; GFR; MR urography; cortex; kidney; medulla; renal compartment; segmentation; time–intensity curve.
Conflict of interest statement
The authors declare no conflict of interest.
Figures


Similar articles
-
Healthy Kidney Segmentation in the Dce-Mr Images Using a Convolutional Neural Network and Temporal Signal Characteristics.Sensors (Basel). 2021 Oct 9;21(20):6714. doi: 10.3390/s21206714. Sensors (Basel). 2021. PMID: 34695931 Free PMC article.
-
A self-supervised strategy for fully automatic segmentation of renal dynamic contrast-enhanced magnetic resonance images.Med Phys. 2019 Oct;46(10):4417-4430. doi: 10.1002/mp.13715. Epub 2019 Aug 16. Med Phys. 2019. PMID: 31306492
-
Automatic renal segmentation for MR urography using 3D-GrabCut and random forests.Magn Reson Med. 2018 Mar;79(3):1696-1707. doi: 10.1002/mrm.26806. Epub 2017 Jun 27. Magn Reson Med. 2018. PMID: 28656614 Free PMC article.
-
Image registration in dynamic renal MRI-current status and prospects.MAGMA. 2020 Feb;33(1):33-48. doi: 10.1007/s10334-019-00782-y. Epub 2019 Oct 9. MAGMA. 2020. PMID: 31598799 Free PMC article. Review.
-
MRI of kidney size matters.MAGMA. 2024 Aug;37(4):651-669. doi: 10.1007/s10334-024-01168-5. Epub 2024 Jul 3. MAGMA. 2024. PMID: 38960988 Free PMC article. Review.
Cited by
-
Kidney Segmentation from Dynamic Contrast-Enhanced Magnetic Resonance Imaging Integrating Deep Convolutional Neural Networks and Level Set Methods.Bioengineering (Basel). 2023 Jun 24;10(7):755. doi: 10.3390/bioengineering10070755. Bioengineering (Basel). 2023. PMID: 37508782 Free PMC article.
References
-
- Cohen S.D., Davison S.N., Kimmel P.L. Chronic Renal Disease. Elsevier; Amsterdam, The Netherlands: 2020. Pain and Chronic Kidney Disease; pp. 1279–1289.
-
- Gounden V., Jialal I. Renal Function Tests. StatPearls Publishing; Treasure Island, FL, USA: 2019. - PubMed
MeSH terms
Substances
Grants and funding
LinkOut - more resources
Full Text Sources
Medical
