Review
. 2021 Nov 28;21(23):7947.
doi: 10.3390/s21237947.

Advanced Ultrasound and Photoacoustic Imaging in Cardiology

Affiliations
Review

Advanced Ultrasound and Photoacoustic Imaging in Cardiology

Min Wu et al. Sensors (Basel). .

Abstract

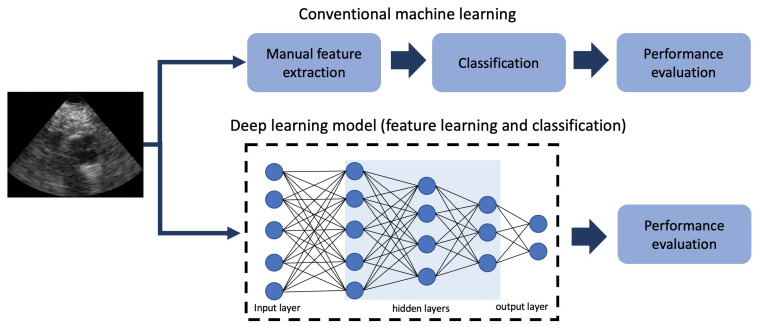
Cardiovascular diseases (CVDs) remain the leading cause of death worldwide. An effective management and treatment of CVDs highly relies on accurate diagnosis of the disease. As the most common imaging technique for clinical diagnosis of the CVDs, US imaging has been intensively explored. Especially with the introduction of deep learning (DL) techniques, US imaging has advanced tremendously in recent years. Photoacoustic imaging (PAI) is one of the most promising new imaging methods in addition to the existing clinical imaging methods. It can characterize different tissue compositions based on optical absorption contrast and thus can assess the functionality of the tissue. This paper reviews some major technological developments in both US (combined with deep learning techniques) and PA imaging in the application of diagnosis of CVDs.

Keywords: cardiovascular diseases; deep learning; photoacoustic imaging; segmentation; ultrasound imaging; vulnerable plaques.


Conflict of interest statement

The authors have no conflict of interest.

Figures

Figure 1
Figure 1
Conventional machine learning vs. DL for a classification task.
Figure 2
Figure 2
Echocardiographic apical views: (a) Apical 2 Chamber view (A2C), (b) Apical 4 Chamber view (A4C) and (c) Apical Long-Axis view (ALX). (Courtesy and copyrights: 123sonography.com) (Reprinted from [44] with permission).
Figure 3
Figure 3
Illustration of LV segmentation for four sample subjects. The results of the semi-supervised method and U-net are shown by blue and cyan colors, respectively. The red color indicates the ground truth. Reprint from [77] with permission.
Figure 4
Figure 4
Example results of detecting the lumen and media borders for images obtained at 20 MHz (first row) and 40 MHz (second row). The segmentation results for lumen and media are shown by cyan and red colors, respectively. The yellow dashed lines show manual annotations by experts [84]. Reprint from [81] with permission.
Figure 5
Figure 5
Schematic of different IVPA catheter designs. (a) Schematic of a collinear IVPA catheter design. (b) Schematic of an IVPA catheter with a longitudinal offset between optical and acoustic beams (red optical beam and green ultrasound beam). Reprinted from [114] with permission.
Figure 6
Figure 6
(a) IVUS, (b) IVPA, and (c) combined IVUS/IVPA images of an atherosclerotic rabbit aorta acquired in the presence of blood. (d) Combined IVUS/IVPA image of the same cross section of the aorta imaged in saline. IVUS and IVPA images are displayed at 35 dB and 20 dB, respectively. The scale bar is 1 mm. (e) H&E and (f) Oil red O stain of the tissue slice adjacent to the imaged tissue cross section indicate that the aorta has lipid-rich plaque. (Reprint from [122] with permission).
Figure 7
Figure 7
Ex vivo lipid differentiation result of an atherosclerotic human coronary artery. (a) Histology: Oil Red O staining of the IVPA/IVUS imaging cross section (lipids are in red). (b) Lipid differentiation map overlaid on a co-registered US image of the coronary artery. The lipids in plaques are in yellow whereas lipids in the peri-adventitial tissue are in red. The dynamic range of the US image is 45 dB. Reprint from [123] with permission.
Figure 8
Figure 8
HDP facilitates single-cell visualization with raster-scan optoacoustic mesoscopy (RSOM). Signals of HDP-laden primary macrophages are separated from hemoglobin in blood-agar phantoms and depicted in a volumetric scatter plot. Subcutaneous injection in the dorsal area of a FoxN1 nude mouse of the cells measured in (a). A catheter was used to determine the injection area and scans were recorded pre- (b,d) and post (c,e) cell injection showing the top view and a depth profile. The opening of the needle is seen on the right side of the images from which the macrophages emerge post injection as a dense line-up (arrows), 0.7–1 mm below the skin surface (–). Blood vessels are faintly detected at 630 nm and indicated by *. Scale bars are 500 µm in x, y, and z. Inset in panel (c) shows labeled macrophages in histological tissue sections with Schmorl’s staining. The outtake corresponds to an area near the needle tip. Scale bar is 50 µm. Reprinted from [129] with permission.
Figure 9
Figure 9
In vivo PA and US image of a human carotid artery with intraplaque hemorrhage; (A) US image; (B) overlaid PA/US image (808 nm, dynamic range 23 dB); (C) photo of the carotid plaque during the CEA surgery; (D) Masson’s trichrome staining of the artery. The area indicated in green is a lipid core filled with a large hemorrhage. The highlighted boxes show two regions of hemorrhages found in the plaque. Reprinted from [132] with permission.
Figure 10
Figure 10
PA image of the common carotid artery based on the MSOT system. (a) PA image at 800 nm shows increased vascularization of the skin, strap and sternocleidomastoid muscles, allowing for a clear identification of the common carotid artery and internal jugular vein. (b) US image revealing the common carotid artery and jugular vein as echo-free structures. (c) Map of the unmixed distribution of oxygenated hemoglobin (HbO2). (d) The corresponding map of the deoxygenated hemoglobin (Hb). CCA: common carotid artery; STM: sternocleidomastoid muscle; SM: strap muscle; IJV: internal jugular vein; L: thyroid lobe. Reprinted from [134] with permission.
Figure 11
Figure 11
Three-dimensional rendering (A) of TCM volume with clipping plane corresponding to tissue bisection (B). Matching top- (C) and side-view (D) gross pathology photographs with axes and FOVs indicated by arrows and boxes, respectively. Reprinted from [147] with permission.
Figure 12
Figure 12
Ablation monitoring in a beating heart. (a) 2λPA images before, during and after ablation, available as Movie 2. (b) I790 equivalents. 2λPA data confirm lesion formation. (c) Photograph of lesion made. (d) Video endoscopy frame confirming a lesion was made. (e) Sketch of instruments positions. Round inset: ICE-C and RFPA-C relative to the valve, oriented as in the images in (a,b). ICE catheter (ICE-C); PA-enabled ablation catheter (RFPA-C). Mitral valve (MV). Cyan arrows indicate indentation formed by ablation. Reprinted from [146] with permission.

Similar articles

Cited by

References

    1. World Health Organization . Integrated Management of Cardiovascular Risk. World Health Organization; Geneva, Switzerland: 2002. Cardiovascular Disease Programme; Noncommunicable Disease and Mental Health Cluster.
    1. Tarride J.E., Lim M., DesMeules M., Luo W., Burke N., O’Reilly D., Bowen J., Goeree R. A review of the cost of cardiovascular disease. Can. J. Cardiol. 2009;25:e195–e202. doi: 10.1016/S0828-282X(09)70098-4. - DOI - PMC - PubMed
    1. Karlas A., Fasoula N.A., Paul-Yuan K., Reber J., Kallmayer M., Bozhko D., Seeger M., Eckstein H.H., Wildgruber M., Ntziachristos V. Cardiovascular optoacoustics: From mice to men—A review. Photoacoustics. 2019;14:19–30. doi: 10.1016/j.pacs.2019.03.001. - DOI - PMC - PubMed
    1. Dave J.K., Mc Donald M.E., Mehrotra P., Kohut A.R., Eisenbrey J.R., Forsberg F. Recent technological advancements in cardiac ultrasound imaging. Ultrasonics. 2018;84:329–340. doi: 10.1016/j.ultras.2017.11.013. - DOI - PMC - PubMed
    1. Beard P. Biomedical photoacoustic imaging. Interface Focus. 2011;1:602–631. doi: 10.1098/rsfs.2011.0028. - DOI - PMC - PubMed