. 2021 Nov 30;21(23):8018.
doi: 10.3390/s21238018.

Design of 2D Planar Sparse Binned Arrays Based on the Coarray Analysis

Affiliations

Design of 2D Planar Sparse Binned Arrays Based on the Coarray Analysis

Óscar Martínez-Graullera et al. Sensors (Basel). .

Abstract

The analysis of the beampattern is the base of sparse arrays design process. However, in the case of bidimensional arrays, this analysis has a high computational cost, turning the design process into a long and complex task. If the imaging system development is considered a holistic process, the aperture is a sampling grid that must be considered in the spatial domain through the coarray structure. Here, we propose to guide the aperture design process using statistical parameters of the distribution of the weights in the coarray. We have studied three designs of sparse matrix binned arrays with different sparseness degrees. Our results prove that there is a relationship between these parameters and the beampattern, which is valuable and improves the array design process. The proposed methodology reduces the computational cost up to 58 times with respect to the conventional fitness function based on the beampattern analysis.

Keywords: beamforming; sparse arrays; ultrasonic imaging.


Conflict of interest statement

The authors declare no conflict of interest.

Figures

Figure 1
Figure 1
(a) Coordinate system used for beampattern simulation; (b) test scenario used to evaluate the imaging capabilities of the apertures.
Figure 2
Figure 2
Projection of the FMC(χ) when the reflector is located at (R=100mm,θ=0,ϕ=0). If χ=(R=100mm, θ=0,ϕ=0) is in the reflector: (a) coarray of a full array; (b) coarray of minimum redundancy array; (c) coarray of sparse array. If χ=(R=100mm,θ=12,ϕ=80) is out of the reflector: (d) coarray of a full array; (e) coarray of minimum redundancy array; (f) coarray of sparse array.
Figure 3
Figure 3
Sparse aperture solution to solve a minimum redundancy coarray. In the top, emission and reception apertures are presented with the resultant coarray. In the bottom-left, the beampattern in the x-axis (R = 100 mm, ϕ=0,) is presented at different steering angles ( 0 blue, 10 yellow, 20 green and 30 red). In the bottom-right the image generated by this array from the scenario presented in Figure 1b.
Figure 4
Figure 4
Elements used to evaluate the beampattern simulation. The beampattern is simulated in a semi-sphere (θ[90:Δα:+90], ϕ[0:Δα:180], Δα=12Δθ6dB). The three lateral profiles are composed of the semi-sphere by obtaining, at each elevation angle, the maximum, the mean and the minimum. The peak sidelobe (Apk) and the mainlobe width ΔθApk are identified. The mean value of the sidelobes is Amn. Furthermore, finally, the 0.5% percentile of the maximum sidelobes is identified and evaluated by its mean value (Am5).
Figure 5
Figure 5
Results of 100,000 random cases of configuration 100I. In the first row, the apertures are presented in a Am5 vs. Apk map, (a) population, (b) Sa, (c) σ2 and (d) Ku. In the second row, the apertures are presented in Am5 vs. Amn map, (e) population, (f) Sa, (g) σ2 and (h) ku. In the third row, the distribution of cases against the coarray parameters are presented, marking the proportion of cases that fulfill the THAm5 threshold, (i) Sa, (j) σ2 and (k) Ku.
Figure 6
Figure 6
Results of 100,000 random cases of configuration 100V. In the first row, the apertures are presented in Am5 vs. Apk map, (a) population, (b) Sa, (c) σ2 and (d) Ku. In the second row, the distribution of cases against the coarray parameters are presented, marking the proportion of case that fulfill the THAm5 threshold, (e) Sa, (f) σ2 and (g) Ku.
Figure 7
Figure 7
Results of 50,000 random cases of configuration 196I. In the first row, the apertures are presented in Am5 vs. Apk map, (a) population, (b) Sa, (c) σ2 and (d) Ku. In the second row, the distribution of cases against the coarray parameters are presented, marking the proportion of case that fulfill the THAm5 threshold, (e) Sa, (f) σ2 and (g) Ku.
Figure 8
Figure 8
In color, the values of Am5 reached by the candidates apertures in the search process. In gray, the values of Am5 obtained with 100,000 random apertures. Configuration 100I: (a), σ2×Ku, (b), Sa×Ku, and (c) Sa×σ2. Configuration 100V: (d), σ2×Ku, (e), Sa×Ku, and (f) Sa×σ2. Configuration 196I: (g), σ2×Ku, (h), Sa×Ku, and (i) Sa×σ2 for configuration 196I.
Figure 9
Figure 9
Coarray-based fitness function. Each row analyses the evolution of the dynamic range in one specific configuration. For 100I: (a) Am5, (d) Amn, (g) Apk. For 100V: (b) Am5, (e) Amn, (h) Apk. For 196I: (c) Am5, (f) Amn, (i) Apk. For each configuration three different evolution processes are presented (colors blue, orange and green). In the figures where Apk or Am5 are presented, the threshold line THAm5 has been indicated.
Figure 10
Figure 10
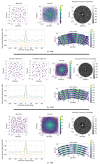
Optimization with coarray based fitness function. Best results for configurations (a) 100I, (b) 100V and (c) 196I. In each figure are presented: emission (and reception for 100V) apertures; coarray matrix representation; acoustic field in the semi-sphere; maximum (blue), mean (green) and minimum (red) lateral profile at each elevation angle; and image resulting from the test scenario.
Figure 11
Figure 11
Combined fitness function. Each row analyses the evolution of the dynamic range in one specific configuration. For 100I: (a) Am5, (d) Amn, (g) Apk. For 100V: (b) Am5, (e) Amn, (h) Apk. For 196I: (c) Am5, (f) Amn, (i) Apk. For each configuration three different evolution processes are presented (colors blue, orange and green). In the figures where Apk or Am5 are presented, the threshold line THAm5 has been indicated.
Figure 12
Figure 12
Optimization with combined fitness function. Best results for configurations (a) 100I, (b) 100V and (c) 196I. In each figure are presented: emission (and reception for 100V) apertures; coarray matrix representation; acoustic field in the semi-sphere; and, maximum (blue), mean (green) and minimum (red) lateral profile at each elevation angle; and image resulting from the test scenario.

References

    1. Park J.M., Shin D.S., Han J.S., Oh J.W., Park S., Kim Y., Jang J.M., Lee W., Park S.J. Design, fabrication of honeycomb-shaped 1–3 connectivity piezoelectric micropillar arrays for 2D ultrasound transducer application. Ceram. Int. 2020;46:12023–12030. doi: 10.1016/j.ceramint.2020.01.243. - DOI
    1. Patricio Rodrigues E., Francisco de Oliveira T., Yassunori Matuda M., Buiochi F. Development of a 2-D Array Ultrasonic Transducer for 3-D Imaging of Objects Immersed in Water. Sensors. 2021;21:3501. doi: 10.3390/s21103501. - DOI - PMC - PubMed
    1. Lok U.W., Li P.C. Microbeamforming With Error Compensation. IEEE Trans. Ultrason. Ferroelectr. Freq. Control. 2018;65:1153–1165. doi: 10.1109/TUFFC.2018.2834411. - DOI - PubMed
    1. Wang X.B., He L.M., Ma Y.C., Liu W.J., Xu W.J., Ren J.Y., Riaud A., Zhou J. Development of Broadband High-Frequency Piezoelectric Micromachined Ultrasonic Transducer Array. Sensors. 2021;21:1823. doi: 10.3390/s21051823. - DOI - PMC - PubMed
    1. Selim H., Trull J., Delgado Prieto M., Picó R., Romeral L., Cojocaru C. Fully Noncontact Hybrid NDT for 3D Defect Reconstruction Using SAFT Algorithm and 2D Apodization Window. Sensors. 2019;19:2138. doi: 10.3390/s19092138. - DOI - PMC - PubMed

LinkOut - more resources