. 2021 Nov 24;22(23):12694.
doi: 10.3390/ijms222312694.

Mutations That Affect the Surface Expression of TRPV6 Are Associated with the Upregulation of Serine Proteases in the Placenta of an Infant

Affiliations

Mutations That Affect the Surface Expression of TRPV6 Are Associated with the Upregulation of Serine Proteases in the Placenta of an Infant

Claudia Fecher-Trost et al. Int J Mol Sci. .

Abstract

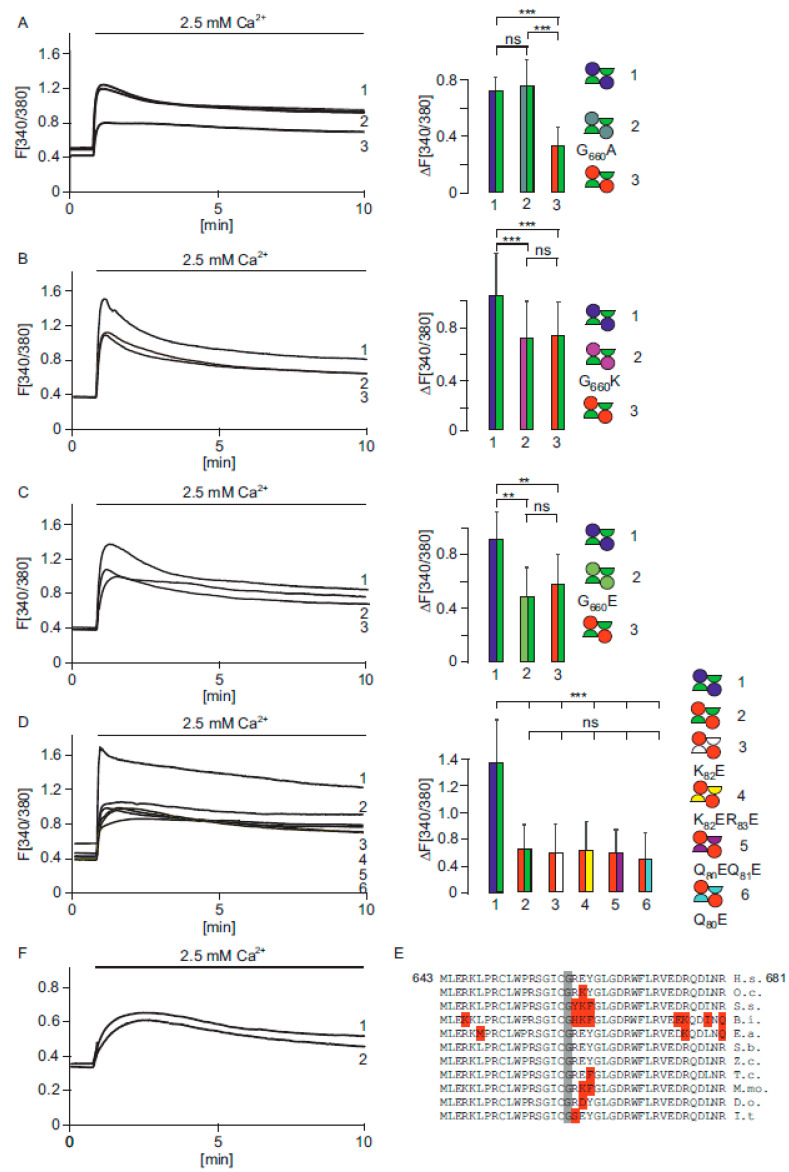
Recently, we reported a case of an infant with neonatal severe under-mineralizing skeletal dysplasia caused by mutations within both alleles of the TRPV6 gene. One mutation results in an in frame stop codon (R510stop) that leads to a truncated, nonfunctional TRPV6 channel, and the second in a point mutation (G660R) that, surprisingly, does not affect the Ca2+ permeability of TRPV6. We mimicked the subunit composition of the unaffected heterozygous parent and child by coexpressing the TRPV6 G660R and R510stop mutants and combinations with wild type TRPV6. We show that both the G660R and R510stop mutant subunits are expressed and result in decreased calcium uptake, which is the result of the reduced abundancy of functional TRPV6 channels within the plasma membrane. We compared the proteomic profiles of a healthy placenta with that of the diseased infant and detected, exclusively in the latter two proteases, HTRA1 and cathepsin G. Our results implicate that the combination of the two mutant TRPV6 subunits, which are expressed in the placenta of the diseased child, is responsible for the decreased calcium uptake, which could explain the skeletal dysplasia. In addition, placental calcium deficiency also appears to be associated with an increase in the expression of proteases.

Keywords: TRPV6; calcium transport; placenta; serine proteases; skeletal dysplasia; subunit assembly; transient receptor potential.


Conflict of interest statement

The authors declare no conflict of interest. The funders had no role in the design of the study; in the collection, analyses, or interpretation of data; in the writing of the manuscript, or in the decision to publish the results.

Figures

Figure 1
Figure 1
TRPV6 activity is reduced in HEK293 cells expressing mutant TRPV6 subunits present in the affected child. (A) TRPV6 constructs used for Ca2+ imaging and Western blots, TRPV6 WT (blue), TRPV6-G660R (red) and TRPV6 R510stop (green). Transmembrane domains (black bars), G660R mutation (*) and binding sites for TRPV6 specific antibodies 1271 and 429 are indicated. (B,C) Ca2+ imaging of TRPV6 WT (blue, n/N = 132/3) and TRPV6-G660R (red, n/N = 126/3) in HEK293 cells and statistical analysis of the peak values. Circles indicate TRPV6 subunits. (D,E) Coexpression of TRPV6 WT-I-GFP and TRPV6-G660R-I-RFP, which reflects the maternal TRPV6-genotype (1, blue/red, n/N = 117/3), coexpression of TRPV6 WT-I-RFP and TRPV6-R510stop mutant I-GFP, which reflects paternal genotype (2, blue/green, n/N = 72/3), coexpression of TRPV6-G660R-I-RFP and TRPV6-R510stop mutant I-GFP, which reflects the child (3, red/green, n/N = 87/3), vector control (4, white, n/N = 82/2) and statistical analysis of peak values. n/N = cells/experiments. Asterisks assign significance differences (*** p < 0.001, ns = not significant). (F) Western blots of cells expressing TRPV6 constructs in HEK293 cells: lane1 TRPV6-R510stop mutant (green semicircle), lane2 TRPV6-G660R mutant (red circle), lane 3 TRPV6 WT (blue circle), lane 4 coexpression of TRPV6-R510stop and G660R mutants, lane 5 coexpression of TRPV6 WT and G660R mutant, lane 6 coexpression TRPV6 WT and TRPV6-R510stop mutant. All TRPV6 variants were expressed as I-GFP constructs. Western blot was probed with antibody 429 (left) and antibody 1271 (right). GFP control below.
Figure 2
Figure 2
A TRPV6-G660A mutation rescues the G660R mutation. (A) Calcium imaging of cells coexpressing TRPV6 WT-I-GFP and TRPV6-R510stop-I-RFP (1, blue/green, paternal, n/N = 95/3), TRPV6-R510stop mutant I-RFP and TRPV6-G660A-I-GFP (2, red/grey, n/N = 97/3) and TRPV6-G660R I-GFP and TRPV6-R510stop mutant I-RFP (3, green/red, child, n/N = 91/3) n/N = cells/experiment. (B) Coexpression of TRPV6-R510stop mutant I-RFP and TRPV6-G660K-I-GFP (2, pink/green, n/N = 106/3) compared with the parental combination (1, blue/green, n/N = 79/3) and the child (3, red/green, n/N = 84/3). (C) Similar experiment as shown in (B), coexpression of TRPV6-R510stop mutant I-RFP and TRPV6 G660E-I-GFP (2, light green/green n/N = 55/3), compared with the parental combination (1, blue/green n/N = 65/3) and the child (3, red/green n/N = 44/3). (D) Coexpression of the TRPV6-G660R-I-RFP with several TRPV6-R510stop mutants cloned in I-GFP vectors, which, in addition, contain a second mutation within the N-terminal located sequence QQKR83. This sequence interacts with the C-terminal sequence in which the G660 residue is located. The following mutants were tested: K82E (3, red/white, n/N = 50/3), K82ER83E (4, red/yellow, n/N = 44/3), Q80EQ81E (5, red/magenta, n/N = 65/3), and Q80E (6, red/light blue, n/N = 45/3). The mutants were compared with the parental combination (1, blue/green, n/N = 52/3) and the child (2, red/green, n/N = 47/2). Here, n/N = cells/experiments. Asterisks assign significance differences (** p < 0.01, *** p < 0.001, ns = not significant). (E) Alignment of mammalian TRPV6 protein sequences from amino acid 643 to 681. G660 is strictly conserved (grey). H.s., Homo sapiens; O.c., Oryctolagus cuniculus; S.s., Sus scrofa; B.i., Bos indicus; E.a., Equus asinus; S.b., Saimiri boliviensis; Z.c., Zalophus californianus; T.c., Tupaia chinensis; M.mo., Monodon Monoceros; D.o., Dipodomys ordii; I.t., Ictidomys tridecemlineatus. (F) Expression of artificial TRPV6 construct which contains amino acids 510 to 765 (1, n/N = 117/3) and coexpression with the same construct and the TRPV6-R510stop mutant (2, n/N = 70/3).
Figure 3
Figure 3
(A) TRPV6 fused to GFP (TRPV6-GFP) and TRPV6-R510 fused to GFP (TRPV6-R510-GFP, stop codon removed) were cotransfected in HEK293 cells and immunoprecipitated with a C-terminal TRPV6 specific antibody 429 (directed against aa 753-765 of TRPV6). (B) Western blot of the input and eluate from co-immunoprecipitaion (COIP) with a GFP antibody. (C) TRPV6-G660R fused to mRFP (TRPV6-G660R-RFP) and TRPV6-R510 fused to GFP (TRPV6-R510-GFP) were cotransfected in HEK293 cells. TRPV6-G660R-RFP was immunoprecipitated with TRPV6 antibody 429. (D) Detection of fused RFP and GFP tagged TRPV6-G660R and TRPV6-R510 proteins in cell lysates from single transfections and in the eluate obtained after cotransfection/co-immunoprecipitation (COIP). (E) Mass spectrometrical identification of TRPV6-G660R-RFP and TRPV6-R510-GFP proteins in the eluate of the COIP (as presented in (C,D)). Location of tryptic peptides identified by MS/MS fragmentation; TRPV6 (blue), RFP (red) and GFP (green).
Figure 4
Figure 4
(A,B) Coexpression of TRPV6-G660R-I-RFP with several TRPV6-R510stop mutants which, in addition, contain W85 mutations. The tryptophan W85 was mutated to W85R (3, red/magenta, n/N = 47/3), W85A (4, red/light blue, n/N = 92/3), W85E (3 shown in B, red/white, n/N = 98/3) and compared with the TRPV6 combination present in the father (1, blue/green, n/n/N/N = 61/3, 55/3) and the child (2, red/green, n/n/N/N = 60/3, 120/3), respectively. (C) Expression of the TRPV6 combination of parental (1, blue/green, n/N = 48/3) and child (Red/green, n/N = 73/3) after loading FURA-2AM and incubation of the cells in the permanent presence of 2.5 mM Ca2+. n/N = cells/experiments. Asterisks assign significance differences (* p < 0.05, ** p <0.01, *** p < 0.001, ns = not significant).
Figure 5
Figure 5
Proteome analysis of paraformaldehyde fixed tissue of a healthy placenta and the placenta of the affected child. (A) Vulcano-blot of a semiquantitative analysis of differentially expressed proteins identified by mass spectrometry of pooled tissue sections of a healthy placenta and the placenta of the affected child (n = 3 samples/genotype). Fifteen proteins are upregulated and four proteins downregulated in the placenta of the affected child. Up- and downregulated proteins were identified based on at least 1.3-fold changes in the total spectrum counts, with p-values < 0.05 using unpaired two-tailed Student’s t-test. Cathepsin G (CATG) and serine protease HTRA1 (green) are only detectable in the affected child. (B) Heatmap of Z-scores calculated from the total peptide spectra counts of proteins (UniProt Identifier), which were more abundant in the child (green triangles and squares shown in (A)). (C) Heatmap of identified proteins on the basis of total spectrum count values (shown as Z-scores) from three independent mass spectrometry samples prepared from placentas from healthy control and affected child (n = 3). In total, 740 proteins were identified by a least two unique peptides/protein of the healthy placenta and the placenta of the affected child.
Figure 6
Figure 6
Proteome analysis of BeWo cells cultured in the presence of different Ca2+ concentrations. (A) Tryptic TRPV6 peptides identified by mass spectrometry after immunoprecipitation from BeWo cells (red) with TRPV6 ab 429. (B) BeWo cells were cultured in the presence of 0.65 mM (high) or 0.35 mM Ca2+ (low). Cells were fixed and stained with eosin/azur, scale bar: 200 µm. (C) Total protein identifications in BeWo cells cultured in the presence of high or low Ca2+. (D) Vulcano blot shows semi quantitative analysis of differentially detected proteins identified in BeWo cell lysates. Proteome analysis of the abundance of peptide spectra detected in BeWo cells in the presence of high or low Ca2+. Up- and downregulated proteins were identified based on at least 2-fold changes in the total peptide spectra abundance detected in three independent experiments with a p-value < 0.01, calculated using the unpaired two-tailed Student’s t test. Serine protease HTRA4 is more abundant in BeWo lysates cultured in 0.35 mM Ca2+.
Figure 7
Figure 7
Putative assembly of TRPV6 subunits. (A) Crystal structure of rat TRPV6 (PDB ID: 5IWK, Saotome et al., 2016). View from the top. G660 is located at the border of the TRPV6 subunits (arrows). The pore of the channel is shown in the middle, a Ca2+ ion is indicated (blue). (B) Assembly of TRPV6 wild type subunits (blue). (C) Assembly of wild type and R510stop TRPV6 subunits, as present in the father (blue/green). (D) Assembly of wild type and the G660R TRPV6 subunit, as present in the mother (blue/red). (E) Assembly of truncated R510stop and G660R TRPV6 subunits, as present in the affected child (red/green). Ca2+ uptake is only decreased in the child because the abundance of functional TRPV6 channels in the plasma membrane is greatly reduced (indicated by grey arrow).

References

    1. Wissenbach U., Niemeyer B.A., Fixemer T., Schneidewind A., Trost C., Cavalie A., Reus K., Meese E., Bonkhoff H., Flockerzi V. Expression of CaT-like, a novel calcium-selective channel, correlates with the malignancy of prostate cancer. J. Biol. Chem. 2001;276:19461–19468. doi: 10.1074/jbc.M009895200. - DOI - PubMed
    1. Peng J.B., Zhuang L., Berger U.V., Adam R.M., Williams B.J., Brown E.M., Hediger M.A., Freeman M.R. CaT1 expression correlates with tumor grade in prostate cancer. Biochem. Biophys. Res. Commun. 2001;282:729–734. doi: 10.1006/bbrc.2001.4638. - DOI - PubMed
    1. Bödding M., Wissenbach U., Flockerzi V. Characterisation of TRPM8 as a pharmacophore receptor. Cell Calcium. 2007;42:618–628. doi: 10.1016/j.ceca.2007.03.005. - DOI - PubMed
    1. Fixemer T., Wissenbach U., Flockerzi V., Bonkhoff H. Expression of the Ca2+-selective cation channel TRPV6 in human prostate cancer: A novel prognostic marker for tumor progression. Oncogene. 2003;22:7858–7861. doi: 10.1038/sj.onc.1206895. - DOI - PubMed
    1. Wissenbach U., Niemeyer B., Himmerkus N., Fixemer T., Bonkhoff H., Flockerzi V. TRPV6 and prostate cancer: Cancer growth beyond the prostate correlates with increased TRPV6 Ca2+ channel expression. Biochem. Biophys. Res. Commun. 2004;322:1359–1363. doi: 10.1016/j.bbrc.2004.08.042. - DOI - PubMed

MeSH terms

LinkOut - more resources