Review
. 2021 Nov 25;22(23):12735.
doi: 10.3390/ijms222312735.

The Roles of Luteinizing Hormone, Follicle-Stimulating Hormone and Testosterone in Spermatogenesis and Folliculogenesis Revisited

Affiliations
Review

The Roles of Luteinizing Hormone, Follicle-Stimulating Hormone and Testosterone in Spermatogenesis and Folliculogenesis Revisited

Olayiwola O Oduwole et al. Int J Mol Sci. .

Abstract

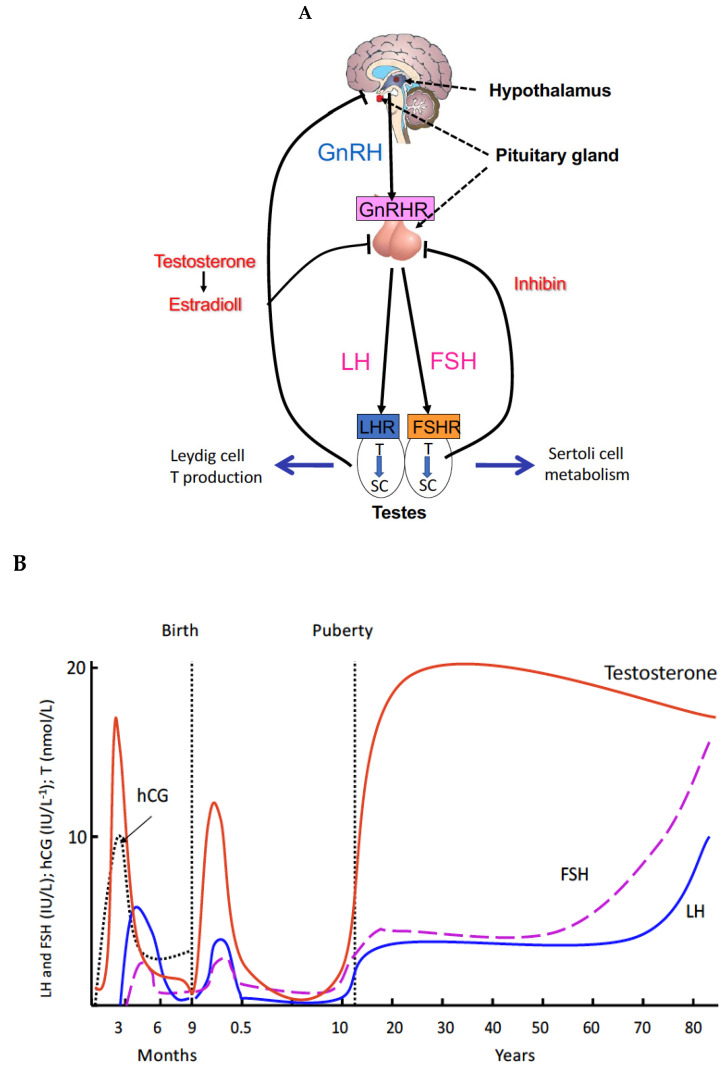
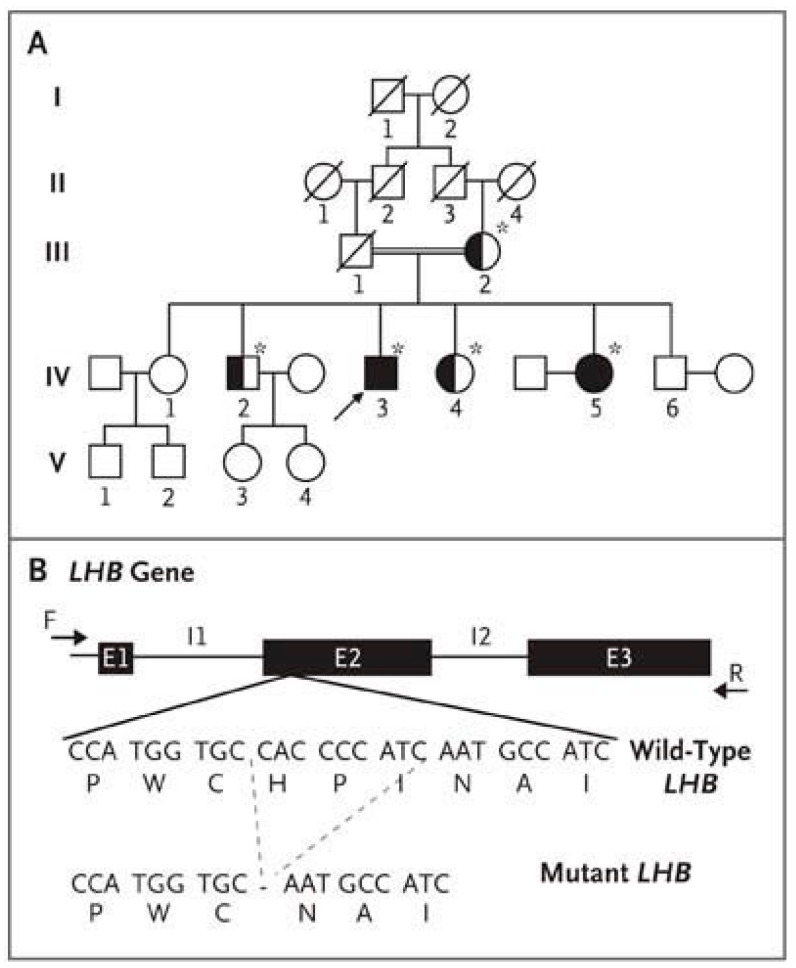
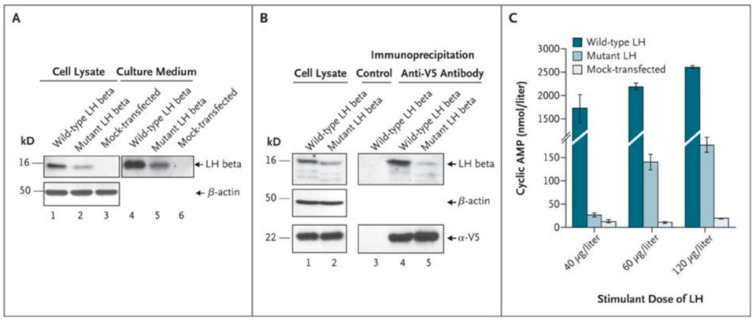
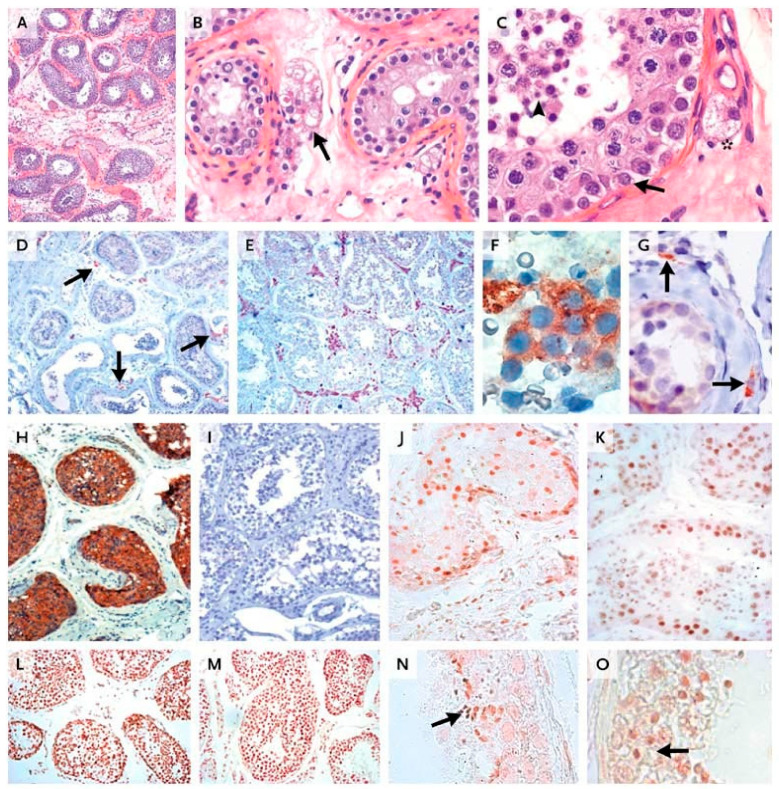
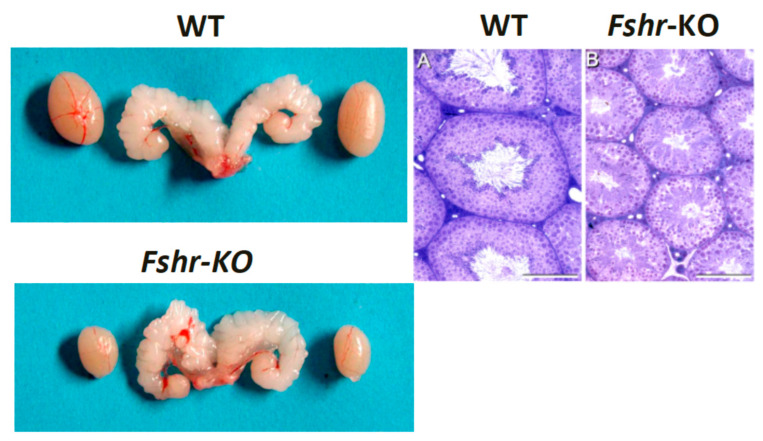
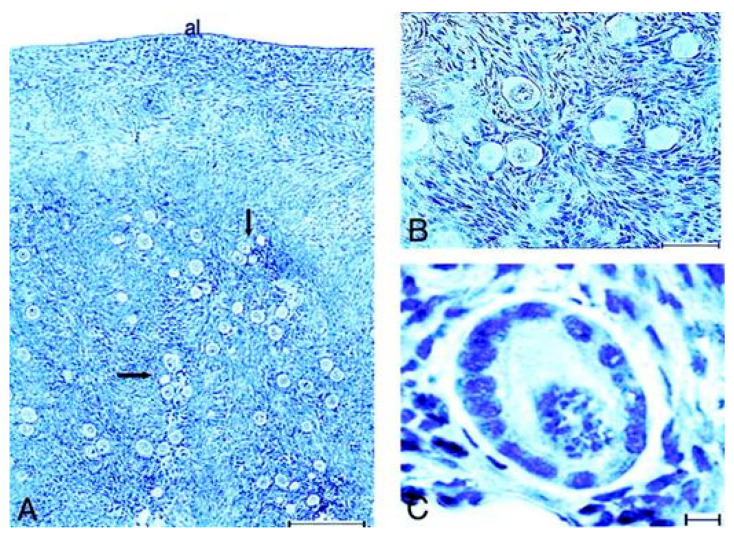
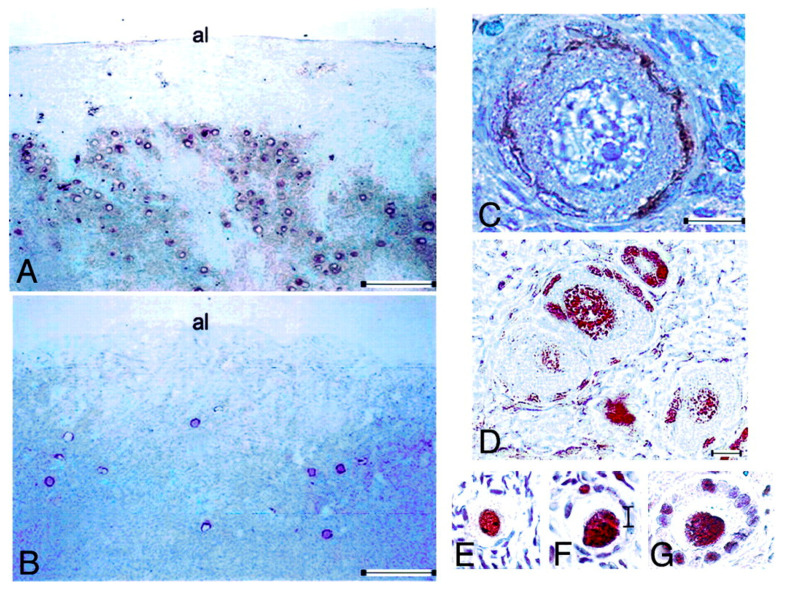
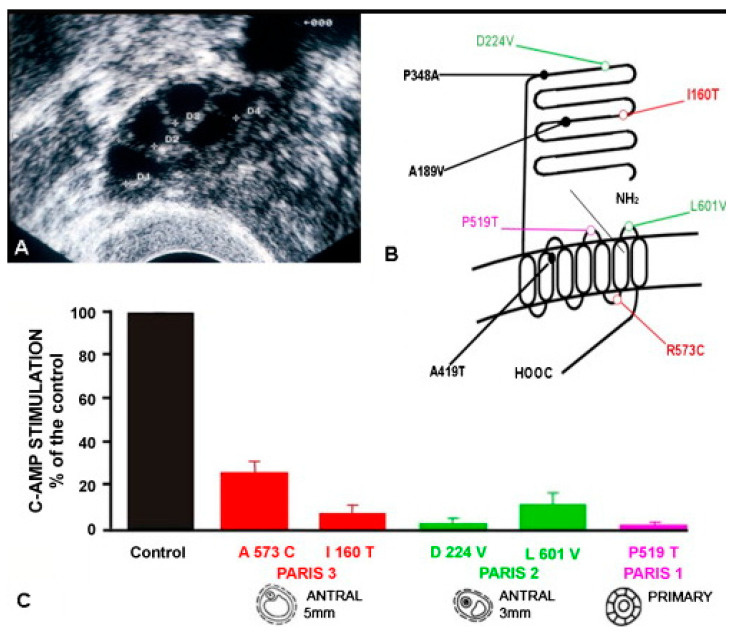
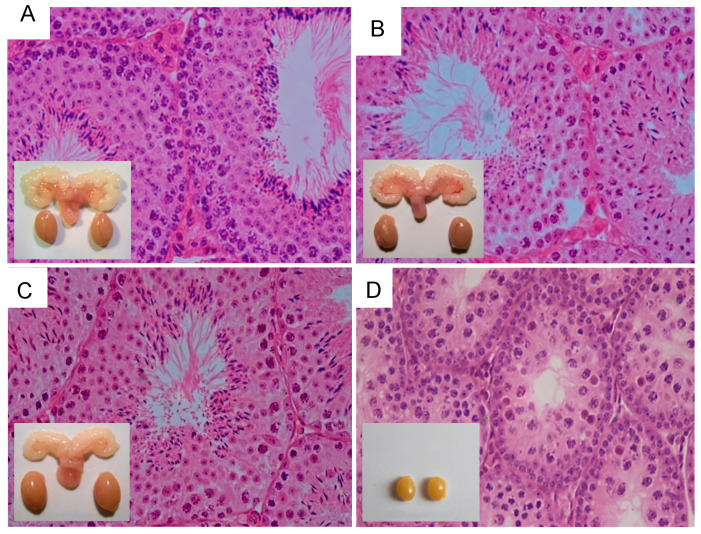
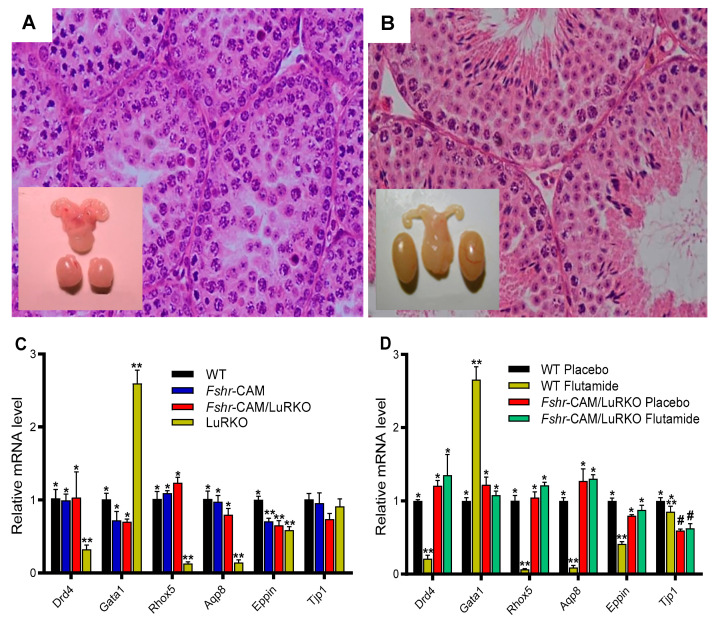
Spermatogenesis and folliculogenesis involve cell-cell interactions and gene expression orchestrated by luteinizing hormone (LH) and follicle-stimulating hormone (FSH). FSH regulates the proliferation and maturation of germ cells independently and in combination with LH. In humans, the requirement for high intratesticular testosterone (T) concentration in spermatogenesis remains both a dogma and an enigma, as it greatly exceeds the requirement for androgen receptor (AR) activation. Several data have challenged this dogma. Here we report our findings on a man with mutant LH beta subunit (LHβ) that markedly reduced T production to 1-2% of normal., but despite this minimal LH stimulation, T production by scarce mature Leydig cells was sufficient to initiate and maintain complete spermatogenesis. Also, in the LH receptor (LHR) knockout (LuRKO) mice, low-dose T supplementation was able to maintain spermatogenesis. In addition, in antiandrogen-treated LuRKO mice, devoid of T action, the transgenic expression of a constitutively activating follicle stimulating hormone receptor (FSHR) mutant was able to rescue spermatogenesis and fertility. Based on rodent models, it is believed that gonadotropin-dependent follicular growth begins at the antral stage, but models of FSHR inactivation in women contradict this claim. The complete loss of FSHR function results in the complete early blockage of folliculogenesis at the primary stage, with a high density of follicles of the prepubertal type. These results should prompt the reassessment of the role of gonadotropins in spermatogenesis, folliculogenesis and therapeutic applications in human hypogonadism and infertility.

Keywords: FSH; LH; Leydig cell; Sertoli cell; azoospermia; folliculogenesis; intratesticular testosterone; knock-out mice; minipuberty; mutation; spermatogenesis; testosterone.


Conflict of interest statement

The authors declare no conflict of interest.

Figures

Figure 1
Figure 1
Control of spermatogenesis. (A) Hormonal control. Gonadotropin-releasing hormone (GnRH) produced by the hypothalamus stimulates, by activating its receptors (GnRHR), the synthesis and release of the gonadotropins LH and FSH in the anterior pituitary gland. LH induces the proliferation and maturation of interstitial Leydig cells which will secrete T. FSH acts on the Sertoli cells (SC) of the seminiferous tubules by stimulating the production of signaling molecules and metabolites necessary for spermatogenesis. In conjunction with T and FSH the Sertoli cells indirectly stimulate the proliferation and maturation of germ cells in the seminiferous tubules from which mature sperm are released to the seminiferous tubular fluid and transported to the epididymis for storage and final maturation. (B) The three waves of Leydig cell proliferation in humans. Each of them is characterized by the production of T. The first wave is antenatal, occurring after 10 weeks of fetal life and is hCG-dependent. Fetal T secretion peaks at 14–15 weeks, and induces the differentiation of the internal genitalia and masculinization of the external genitalia. The other two waves of Leydig cell proliferation are postnatal, regulated by pituitary LH. At the end of the second month of life, in the postnatal period, the HPG axis is transiently activated. The increased secretion of LH and FSH causes the development of a second wave of Leydig cells, and the appearance of a peak of T at levels close in magnitude to those observed at puberty. This event, called “mini-puberty”, is short-lived, and its role is poorly understood. The third wave starts at puberty and lasts for the rest of a man’s life.
Figure 2
Figure 2
Pedigree of the patient with hypogonadism and LHβ Mutation. (A) The pedigree of the proband (Subject IV-3, arrow). The double line indicates consanguinity. For the family members who underwent genetic testing (denoted with an asterisk), solid symbols indicate homozygosity for the LHβ mutation, and half-solid symbols heterozygosity. (B) The complete coding region of the LHβ gene, including exons E1 through E3 and introns I1 and I2. The nine-base deletion in exon E2 results in the deletion of three amino acids from the protein. (For wild-type and mutant LHβ, the three-base codons are listed above the corresponding amino acid, represented by its single-letter symbol). From [46] with permission.
Figure 3
Figure 3
Production and heterodimerization in mutant and wild-type luteinizing hormone (LH) β and bioactivity of mutant and wild-type LH. Panel (A) shows low intracellular and secreted levels of mutant LH beta subunit in transfected cells. Western blot analysis was performed on cell lysate (lanes 1 through 3) and culture medium (lanes 4 to 6) of human embryonic kidney (HEK) 293T cells: cells producing the LHα subunit and the wild-type LH beta subunit (lanes 1 and 4), cells producing the LH alpha subunit and the mutant LHβ subunit (lanes 2 and 5), and mock-transfected cells (lanes 3 and 6). An anti–β-actin antibody was used as a loading control (lanes 1 through 3). Identical volumes of culture medium, concentrated by a factor of about 20 for wild-type LHβ (lane 4) and about 400 for mutant LHβ (lane 5), were loaded. Wild-type LHβ and mutant LHβ were immunodetected with an anti–hCGβ antibody (Abcam) displaying strong cross-reactivity. Panel (B) shows low levels of dimerization of the alpha subunit and mutant beta subunit of LH. Coimmunoprecipitation experiments were performed on cell lysates from COS-7 cells producing the α-V5 construct and either wild-type or mutant LHβ. Immunoprecipitation was performed with the use of anti-V5 antibody (lanes 4 and 5) or with a nonimmune immunoglobulin as a control (lane 3). This was followed by immunodetection of wild-type LHβ and mutant LHβ, with the use of a polyclonal anti–hCGβ antibody (Abcam), or of the α-V5 construct, with an anti-V5 antibody. An anti–β-actin antibody was used as a loading control (lanes 1 and 2). Panel (C) shows markedly lower levels of mutant LH bioactivity in HEK 293 cells expressing the human LH receptor. The secreted levels of wild-type LH were quantified by means of immunofluorometric assay and used to generate a dose–response curve. Comparative quantification of secretion of wild-type and mutant LHβ was carried out through Western blot analysis (Panel (A), reflecting one representative experiment). HEK 293 cells expressing the human LH receptor were stimulated with concentrated culture medium containing a similar amount of either wild-type LH or mutant LH beta. Concentrated culture medium from mock-transfected cells were used as a negative control. The mean results are shown for three independent experiments using each of three doses of mutant or wild-type LH to stimulate cyclic AMP production. I bar indicates standard deviations. From [46], with permission.
Figure 4
Figure 4
Histologic and immunocytochemical studies of the patient’s testis. (A) Seminiferous tubules separated by a fibrous interstitium. In Panel (B), a few vacuolated Leydig cells are visible (arrow). (C) shows all stages of germ-cell differentiation, from spermatogonia (arrow) to spermatozoids (arrowhead); there is also an isolated, mature Leydig cell in the interstitium (asterisk). In Panels (AC), staining was performed with hematoxylin and eosin. In Panel (D), only a few interstitial androgen-producing cells positive for cytochrome P-450 (CYP) 17α-hydroxylase are visible (arrows), whereas such cells are abundant in a sample from an age-matched control (Panel (E)). We detected 3β-hydroxysteroid dehydrogenase expression in both the few interstitial mature Leydig cells also expressing CYP 17α-hydroxylase (Panel (F)) and in the fibroblast-like precursors, adjacent to the tubular basement membrane and lacking CYP 17α-hydroxylase (Panel (G), arrows). Panel (H) shows Sertoli cells strongly expressing anti-Müllerian hormone, whereas no such expression is observed in the control sample (Panel (I)). In Panels (D) through (I), staining was performed with hematoxylin. The expression pattern of the androgen receptor was identical in interstitial and intratubular cells from the patient (Panel (J)) and from the control (Panel (K)). A similar pattern of expression of histone H1, a marker of germ-cell maturation, was observed in maturing germ cells obtained from the patient (Panel (L)) and the control (Panel (M)). Proacrosin was detected in spermatids and spermatozoids from both the patient (Panel (N), arrow) and the control (Panel (O), arrow), indicating their advanced degree of maturation. Panels (D,E,HM) are at the same magnification; Panel (A) is at a slightly lower magnification; Panels (B,G,N,O) are at twice the magnification; and Panels (C,F) are at four times the magnification. From [46], with permission.
Figure 5
Figure 5
Testes and seminal vesicles of adult wild-type (WT) and FshrKO mice (left panels), and testicular histology of the same genotypes (right panels). No difference was observed in seminal vesicle sizes between the two genotypes, but the size of the FshrKO testes is about half that of the WT. Furthermore, while full spermatogenesis is visible in the histology of both testes, the tubular diameter is clearly narrower in the knockout testis. From Dr. Harry Charlton (University of Oxford), with permission.
Figure 6
Figure 6
Top: Histology of the ovaries of the patient. (A,B), primordial and intermediary follicles in the deep cortical region (arrows). Magnification, ×40 and ×400, respectively. Albuginea. Bar, 200 (A) and 50 (B) μm. (C), primary follicle of normal histology, constituted of cubic granulosa cells surrounding an oocyte. Bar, 10 μm. From [110]. Below: Immunocytochemical study of the ovaries of the patient. Low magnification (×40) of the cortical region of the ovaries of the patient (A) and of a normal woman of comparable age (B), immunolabeled with an anti-c-Kit antibody. Note the difference in the follicular density and in the distribution of small follicles. Bars, 200 μm. (C), expression of c-Kit at the surface of the oocyte of an intermediary follicle in the patient’s ovary. Bar, 10 μm. (D), immunolabeling with anti-PCNA antibody. PCNA expression is detected in the granulosa cells and in oocytes of primordial and intermediary follicles in the patient’s ovary. The value, al, denotes Albuginea. Bar, 10 μm. (EG), primordial, intermediary and primary follicles of the control ovary labeled with anti-PCNA antibody. The oocytes and some granulosa cells are immunolabeled. The follicles were not grouped in nests, but isolated in the cortical stroma. Bar, 10 μm. From [110], with permission.
Figure 6
Figure 6
Top: Histology of the ovaries of the patient. (A,B), primordial and intermediary follicles in the deep cortical region (arrows). Magnification, ×40 and ×400, respectively. Albuginea. Bar, 200 (A) and 50 (B) μm. (C), primary follicle of normal histology, constituted of cubic granulosa cells surrounding an oocyte. Bar, 10 μm. From [110]. Below: Immunocytochemical study of the ovaries of the patient. Low magnification (×40) of the cortical region of the ovaries of the patient (A) and of a normal woman of comparable age (B), immunolabeled with an anti-c-Kit antibody. Note the difference in the follicular density and in the distribution of small follicles. Bars, 200 μm. (C), expression of c-Kit at the surface of the oocyte of an intermediary follicle in the patient’s ovary. Bar, 10 μm. (D), immunolabeling with anti-PCNA antibody. PCNA expression is detected in the granulosa cells and in oocytes of primordial and intermediary follicles in the patient’s ovary. The value, al, denotes Albuginea. Bar, 10 μm. (EG), primordial, intermediary and primary follicles of the control ovary labeled with anti-PCNA antibody. The oocytes and some granulosa cells are immunolabeled. The follicles were not grouped in nests, but isolated in the cortical stroma. Bar, 10 μm. From [110], with permission.
Figure 7
Figure 7
Loss-of-function mutations of the FSHR. (A) Ultrasonography of patient Paris 3 showing several antral follicles up to 5 mm diameter. (B) Localization of natural loss-of-function mutations of the FSH receptor. See text for references. (C) Comparative functional studies of loss-of-function mutations of the FSHR. The maximal stage of follicular maturation is illustrated below. From [36], with permission.
Figure 8
Figure 8
Testicular histology and macroscopic views of testes and urogenital blocks of different mouse genotypes: (A) WT, (B) Fshr-CAM, (C) Fshr-CAM/LuRKO, and (D) LuRKO mice. (AC) show normal spermatogenesis and testis and seminal vesicle (SV) sizes. In (D), spermatogenesis is arrested at the round spermatid (RS) stage, with small testes and rudimentary seminal vesicle (not visible). Scale bars: 50 μm; 10 mm (insets). From [133], with permission.
Figure 9
Figure 9
Effect of anti-androgen flutamide treatment on wild-type (WT) and genetically modified mice. (A,B): testicular histology and macroscopic views of the testes and urogenital blocks of WT and Fshr-CAM/LuRKO mice (A): the treatment arrested spermatogenesis at round spermatid stage in WT mice and reduced their testis and seminal vesicle sizes. (B) identical treatment of Fshr-CAM/LuRKO mice had no apparent effect on their spermatogenesis and testis size but reduced seminal vesicle size (arrows in (B)). (C,D): expression of selected target genes in untreated (A) and flutamide-treated (B) mice. (A): expression of androgen-regulated (Drd5, Rhox5, Eppin, and Tjp1), postmeiotic germ cell–specific (Aqp8), and germ cell–regulated (Gata1) genes in WT, Fshr-CAM, Fshr-CAM/LuRKO and LuRKO testes. (B): effect of flutamide treatment on expression of the same androgen-regulated genes in WT and Fshr-CAM/LuRKO mice. Data represent mean ± SEM. n = 3 samples/group. Bars with different symbols (*, **, #) differ significantly from each other (p < 0.05; ANOVA/Newman-Keuls). The remarkable finding is that while flutamide treatment suppressed the expression of strictly androgen-dependent genes in WT mice, the same effect was not observed in the testis of Fshr-CAM/LuRKO mice. Scale bars: 50 μm. From [133] with permission.

References

    1. Huhtaniemi I., Hovatta O., La Marca A., Livera G., Monniaux D., Persani L., Heddar A., Jarzabek K., Laisk-Podar T., Salumets A., et al. Advances in the Molecular Pathophysiology, Genetics, and Treatment of Primary Ovarian Insufficiency. Trends Endocrinol. Metab. 2018;29:400–419. doi: 10.1016/j.tem.2018.03.010. - DOI - PubMed
    1. Krausz C., Riera-Escamilla A. Genetics of Male Infertility. Nat. Rev. Urol. 2018;15:369–384. doi: 10.1038/s41585-018-0003-3. - DOI - PubMed
    1. Levine H., Jørgensen N., Martino-Andrade A., Mendiola J., Weksler-Derri D., Mindlis I., Pinotti R., Swan S.H. Temporal Trends in Sperm Count: A Systematic Review and Meta-Regression Analysis. Hum. Reprod. Update. 2017;23:646–659. doi: 10.1093/humupd/dmx022. - DOI - PMC - PubMed
    1. Anderson R.A., Baird D.T. Male Contraception. Endocr. Rev. 2002;23:735–762. doi: 10.1210/er.2002-0002. - DOI - PubMed
    1. McLachlan R.I., O’Donnell L., Meachem S.J., Stanton P.G., de Kretser D.M., Pratis K., Robertson D.M. Identification of Specific Sites of Hormonal Regulation in Spermatogenesis in Rats, Monkeys, and Man. Recent Prog. Horm. Res. 2002;57:149–179. doi: 10.1210/rp.57.1.149. - DOI - PubMed