. 2021 Nov 29;22(23):12937.
doi: 10.3390/ijms222312937.

EGFR Transgene Stimulates Spontaneous Formation of MCF7 Breast Cancer Cells Spheroids with Partly Loss of HER3 Receptor

Affiliations

EGFR Transgene Stimulates Spontaneous Formation of MCF7 Breast Cancer Cells Spheroids with Partly Loss of HER3 Receptor

Olga Troitskaya et al. Int J Mol Sci. .

Abstract

Multicellular spheroids with 3D cell-cell interactions are a useful model to simulate the growth conditions of cancer. There is evidence that in tumor spheroids, the expression of various essential molecules is changed compared to the adherent form of cell cultures. These changes include growth factor receptors and ABC transporters and result in the enhanced invasiveness of the cells and drug resistance. It is known that breast adenocarcinoma MCF7 cells can spontaneously form 3D spheroids and such spheroids are characterized by high expression of EGFR/HER2, while the natural phenotype of MCF7 cells is EGFRlow/HER2low. Therefore, it was interesting to reveal if high epidermal growth factor receptor (EGFR) expression is sufficient for the conversion of adherent MCF7 to spheroids. In this study, an MCF7 cell line with high expression of EGFR was engineered using the retroviral transduction method. These MCF7-EGFR cells assembled in spheroids very quickly and grew predominantly as a 3D suspension culture with no special plates, scaffolds, growth supplements, or exogenous matrixes. These spheroids were characterized by a rounded shape with a well-defined external border and 100 µM median diameter. The sphere-forming ability of MCF7-EGFR cells was up to 5 times stronger than in MCF7wt cells. Thus, high EGFR expression was the initiation factor of conversion of adherent MCF7wt cells to spheroids. MCF7-EGFR spheroids were enriched by the cells with a cancer stem cell (CSC) phenotype CD24-/low/CD44- in comparison with parental MCF7wt cells and MCF7-EGFR adhesive cells. We suppose that these properties of MCF7-EGFR spheroids originate from the typical features of parental MCF7 cells. We showed the decreasing of HER3 receptors in MCF7-EGFR spheroids compared to that in MCFwt and in adherent MCF7-EGFR cells, and the same decrease was observed in the MCF7wt spheroids growing under the growth factors stimulation. To summarize, the expression of EGFR transgene in MCF7 cells stimulates rapid spheroids formation; these spheroids are enriched by CSC-like CD24-/CD44- cells, they partly lose HER3 receptors, and are characterized by a lower potency in drug resistance pomp activation compared to MCF7wt. These MCF7-EGFR spheroids are a useful cancer model for the development of anticancer drugs, including EGFR-targeted therapeutics.

Keywords: 3D cell culture; EGFR; HER3; MCF7; cancer stem cells; drug resistance; spheroids.


Conflict of interest statement

The authors declare no conflict of interest.

Figures

Figure 1
Figure 1
Characterization of MCF7-derived MCF7-EGFR cells. (A) Flow cytometry analysis of surface EGFR expression. Cells from gate P1 were sorted and cultivated as MCF7-EGFR cells. (B) Western blot of total cellular EGFR (typical image). Tubulin was used as a loading control.
Figure 2
Figure 2
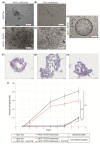
The measuring of sphere-forming ability of MCFwt and MCF7-EGFR cells. (AE) Typical images of spheroids (phase contrast). Images of MCF7-EGFR cells were made on days 11 and 14 after the FACS sorting; (FH) Typical images of microstructure of spheroids. Hematoxylin and eosin staining of histological sections. The red asterisk indicates the necrotic core of the spheroid; the green asterisk indicates the proliferative zone of the spheroid; (I) Growth kinetics of spheroids in adhesive and non-adhesive plates. Cells were counted in the individual wells of 96-well plates, and the amount of spheroid per well is indicated. The final concentration of AG1478 in wells was 10 µM. Data presented as mean value ± SD of three independent experiments; * p < 0.05 and ** p < 0.01.
Figure 3
Figure 3
Schematic representation of MCF7-EGFR spheroids generation and stages of cultivation.
Figure 4
Figure 4
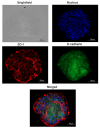
Tight junction proteins distribution in spheroids. A typical image of a spheroid. The presence of junction markers zona occludens-1 (ZO-1) and E-cadherin were confirmed via immunofluorescent staining: red, ZO-1; green, E-cadherin; blue, nuclei (DAPI).
Figure 5
Figure 5
Flow cytometry analysis of CD44 and CD24 markers in MCF7 and MCF7-derived cells. The initial gating (P1) was made to exclude cell debris. Analysis was made on day 4 of cultivation. (A) Typical images of analysis. (B) Relative contribution of the CD44+/CD24 and CD44+/CD24+ subpopulations in cell cultures. Bar graph showing the percentage of cells with indicated phenotype detected by flow cytometry. Statistical analysis included the results of three independent experiments (mean ± SD). The difference between the two groups was statistically significant at p < 0.05 (*) and at p < 0.01 (**).
Figure 6
Figure 6
Flow cytometry analysis of HER3 and HER2 receptors in MCF7 and MCF7-derived cells. The growth factors cocktail is described in the Materials and Methods Section. (A) Typical images of analysis of HER3 receptor. (B) Quantification of the HER2-positive populations that were identified by flow cytometry with anti-HER2 monoclonal antibodies. Data presented as mean % of HER2-positive cells ± SD of three independent experiments. The differences with MCF7wt were significant with * p < 0.05 (ANOVA test).
Figure 7
Figure 7
Analysis of drug resistance in MCF7wt and MCF7-derived cells. (A) Kinetic of rhodamine 123 efflux in MCF7wt and MCF7-derived cells. (B) Data presented as percent of Rh123-positive cells, that based on mean MFI of Rh123 signal. SD was calculated in four independent experiments. Verapamil (10 µM) was added to the samples for the efflux specificity control. (C) IC50 values for cisplatin were calculated using MTT data (48 h after the treatment). The differences between the two groups were significant with * p < 0.05 or ns, non-significant (Student’s t-test).

References

    1. Kaprin A.D., Starinsky V.V., Shahzadova A.O. The State of Cancer Care for the Population of Russia in 2019. National Medical Research Radiological Centre of the Ministry of Health of the Russian Federation; Moscow, Russia: 2020.
    1. Białkowska K., Komorowski P., Bryszewska M., Miłowska K. Spheroids as a Type of Three-Dimensional Cell Cultures—Examples of Methods of Preparation and the Most Important Application. Int. J. Mol. Sci. 2020;21:6225. doi: 10.3390/ijms21176225. - DOI - PMC - PubMed
    1. Lohberger B., Glaenzer D., Eck N., Steinecker-Frohnwieser B., Leithner A., Rinner B., Kerschbaum-Gruber S., Georg D., Lohberger B., Glaenzer D., et al. Effects of a Combined Therapy of Bortezomib and Ionizing Radiation on Chondrosarcoma Three-Dimensional Spheroid Cultures. Oncol. Lett. 2021;21:1–10. doi: 10.3892/ol.2021.12689. - DOI - PMC - PubMed
    1. Edmondson R., Broglie J.J., Adcock A.F., Yang L. Three-Dimensional Cell Culture Systems and Their Applications in Drug Discovery and Cell-Based Biosensors. ASSAY Drug Dev. Technol. 2014;12:207–218. doi: 10.1089/adt.2014.573. - DOI - PMC - PubMed
    1. Lee J., Lilly G.D., Doty R.C., Podsiadlo P., Kotov N.A. In Vitro Toxicity Testing of Nanoparticles in 3D Cell Culture. Small. 2009;5:1213–1221. doi: 10.1002/smll.200801788. - DOI - PubMed

Publication types