. 2021 Nov 30;22(23):12974.
doi: 10.3390/ijms222312974.

Opposing Effects of Chelidonine on Tyrosine and Serine Phosphorylation of STAT3 in Human Uveal Melanoma Cells

Affiliations

Opposing Effects of Chelidonine on Tyrosine and Serine Phosphorylation of STAT3 in Human Uveal Melanoma Cells

István Csomós et al. Int J Mol Sci. .

Abstract

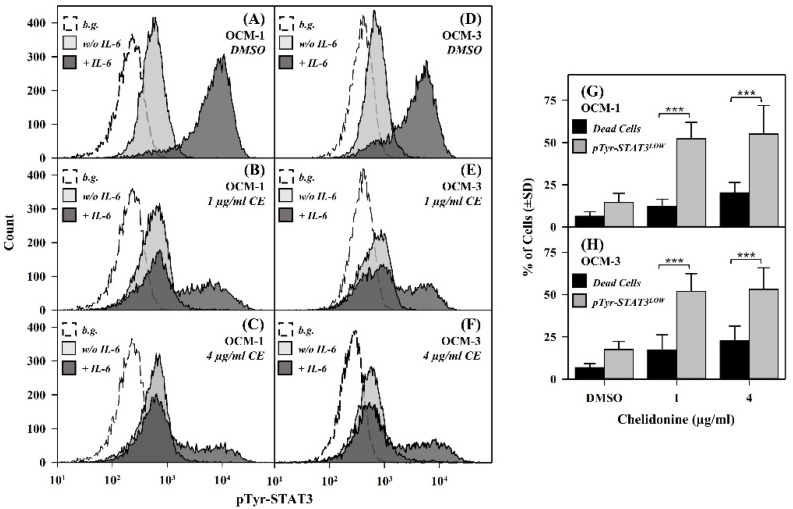
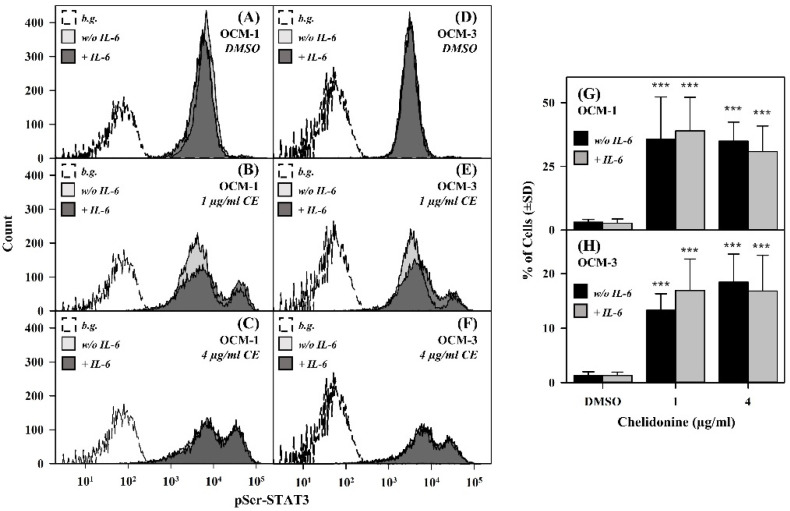
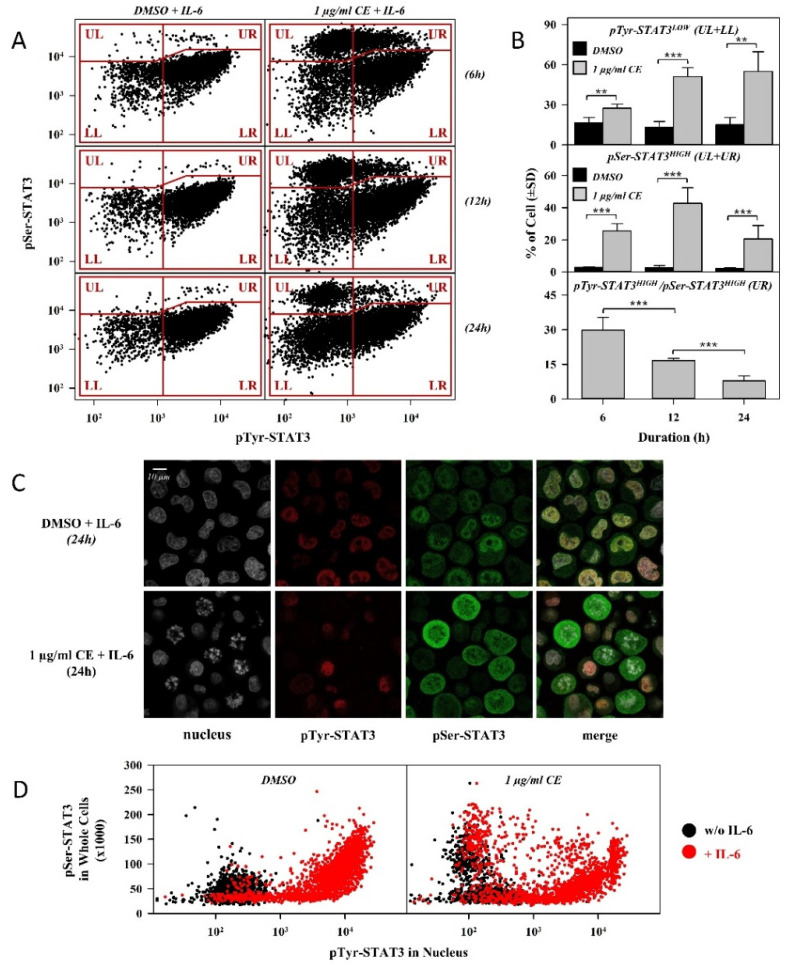
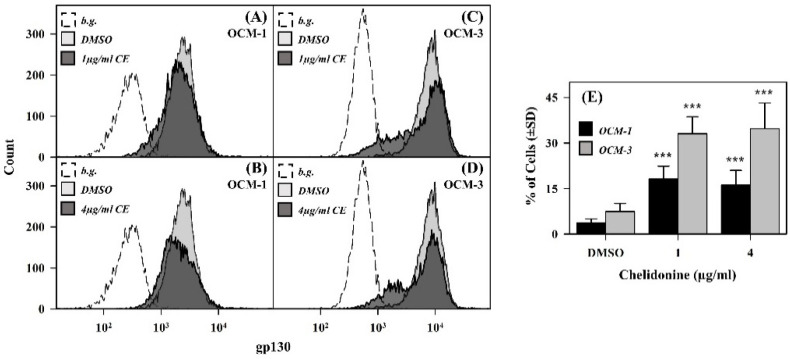
STAT3 is a transcription factor that regulates various cellular processes with oncogenic potential, thereby promoting tumorigenesis when activated uncontrolled. STAT3 activation is mediated by its tyrosine phosphorylation, triggering dimerization and nuclear translocation. STAT3 also contains a serine phosphorylation site, with a postulated regulatory role in STAT3 activation and G2/M transition. Interleukin-6, a major activator of STAT3, is present in elevated concentrations in uveal melanomas, suggesting contribution of dysregulated STAT3 activation to their pathogenesis. Here, we studied the impact of chelidonine on STAT3 signaling in human uveal melanoma cells. Chelidonine, an alkaloid isolated from Chelidonium majus, disrupts microtubules, causes mitotic arrest and provokes cell death in numerous tumor cells. According to our flow cytometry and confocal microscopy data, chelidonine abrogated IL-6-induced activation and nuclear translocation, but amplified constitutive serine phosphorylation of STAT3. Both effects were restricted to a fraction of cells only, in an all-or-none fashion. A partial overlap could be observed between the affected subpopulations; however, no direct connection could be proven. This study is the first proof on a cell-by-cell basis for the opposing effects of a microtubule-targeting agent on the two types of STAT3 phosphorylation.

Keywords: STAT3 signaling; chelidonine; confocal microscopy; flow cytometry; interleukin-6; uveal melanoma.


Conflict of interest statement

The authors declare no conflict of interest.

Figures

Figure 1
Figure 1
IL-6 induced tyrosine phosphorylation of STAT3 is abolished completely by chelidonine in a significant portion of OCM-1 and OCM-3 human uveal melanoma cells. (AF) Representative flow cytometric intensity histograms demonstrate cell-by-cell distribution of pTyr-STAT3 levels in DMSO- and chelidonine-treated cells. Dark and light grey histograms correspond to IL-6-stimulated and unstimulated cells, respectively, whereas the empty histograms represent unlabeled cells (background). (G,H) Bar charts demonstrate the percentage of IL-6 nonresponsive cells and that of dead cells (grey and black bars, respectively) for DMSO- and chelidonine-treated OCM-1 and OCM-3 cell lines. The values for dead cells represent the fraction of apoptotic and necrotic cells combined. Percentages are expressed as the mean ± SD values of at least three independent experiments, p-value < 0.001 (***). The fraction of IL-6 nonresponsive cells increased significantly upon 1 or 4 µg/mL chelidonine treatment as compared to control (DMSO-treated) samples for both cell lines (p < 0.001, not indicated on the figure). Cells treated with chelidonine (1 or 4 µg/mL) or DMSO (vehicle control) for 24 h were incubated either in the presence of IL-6 (20 ng/mL) or alone for 30 min at 37 °C. Cells were then subjected to immunofluorescence staining using Alexa Fluor 647-conjugated mAbs specific for pTyr-STAT3, and analyzed by flow cytometry (n = 10,000 cells/sample). Bar charts: The percentage of IL-6 nonresponsive cells was determined by the evaluation of flow cytometric data detected for IL-6 stimulated cells as described in the Materials and Methods. The fraction of dead cells was determined based on Annexin-V and PI staining of DMSO- or chelidonine-treated cells without IL-6 stimulation. (b.g.: background, CE: chelidonine, pTyr-STAT3: STAT3 phosphorylated on the tyrosine 705 residue, w/o: without).
Figure 2
Figure 2
Serine phosphorylation of STAT3 is enhanced by chelidonine in a significant portion of OCM-1 and OCM-3 cells. (AF) Representative flow cytometric intensity histograms demonstrate cell-by-cell distribution of pSer-STAT3 levels in DMSO- and chelidonine-treated cells. The thick black line and the filled grey histograms belong to IL-6-stimulated and unstimulated cells, respectively, whereas the dashed line histograms represent unlabeled cells (background). (G,H) Bar charts demonstrate the fraction of cells with increased levels of pSer-STAT3 for DMSO- and chelidonine-treated OCM-1 and OCM-3 cells. Grey and black bars represent IL-6-stimulated and unstimulated cells, respectively. Percentages are expressed as the mean ± SD values of at least three independent experiments, p-value < 0.001 (***). Cells treated with chelidonine (1 or 4 µg/mL) or DMSO (vehicle control) for 24 h were incubated either in the presence of IL-6 (20 ng/mL) or alone for 30 min at 37 °C. Cells were then stained with PE-conjugated mAbs specific for pS727-STAT3 and analyzed by flow cytometry (n = 10,000 cells/sample). (b.g.: background, CE: chelidonine, pSer-STAT3: STAT3 phosphorylated on the serine 727 residue, w/o: without).
Figure 3
Figure 3
Subpopulations of OCM-1 cells with reduced IL-6 responsiveness and elevated pSer-STAT3 level overlap partially with each other. (A) Representative flow cytometry dot plots of pSer-STAT3 vs. pTyr-STAT3 levels in OCM-1 cells incubated for the indicated durations with chelidonine (right panels) or DMSO (left panels). n = 10,000 cells/sample were measured. Before analysis, cells were stimulated with IL-6 (20 ng/mL, 30 min) and labeled with Alexa Fluor 647- and PE-conjugated mAbs targeting pTyr-STAT3 and pSer-STAT3. (UL: upper left, UR: upper right, LL: lower left, LR: lower right) (B) Time dependence of the effects of chelidonine on the phosphorylation state of STAT3 in OCM-1 cells. The top and middle panels show the fraction of IL-6 unresponsive cells (in terms of STAT3 activation, pTyr-STAT3LOW) and that of cells with elevated pSer-STAT3 levels (pSer-STAT3HIGH), respectively, for DMSO- (black bars) and chelidonine-treated (grey bars) cells. The bottom panel depicts the fraction of cells with elevated pSer-STAT3 levels, induced by chelidonine treatment, which are still responsive to IL-6-induced tyrosine phosphorylation (pTyr-STAT3HIGH/ pSer-STAT3HIGH) (UL, UR, LL and LR refer to the respective fractions of cells in part A). The percentage of cells was determined with quantitative analysis of flow cytometry dot plots shown in part A. Percentages are expressed as mean ± SD values for at least three independent experiments, p-value < 0.001 (***) or < 0.01 (**). (C) Confocal microscopy images depict subcellular localization of pTyr- and pSer-STAT3 in DMSO- (top panels) and chelidonine-treated (bottom panels) cells. Images in the first column show nuclei stained with DAPI (grey), whereas images in the second and third columns represent subcellular distribution of pTyr-STAT3 (red) and pSer-STAT3 (green). Overlay images (last column) show co-localization of the labels. For microscopy experiments, cells were cultured in the presence of chelidonine or DMSO for 24 h and then processed as described in part A. (D) Representative dot plots demonstrate the correlated levels of nuclear pTyr-STAT3 and whole cell pSer-STAT3 in DMSO- (left panel) and chelidonine-treated cells (right panel) with and without IL-6 stimulation (red and black dots, respectively). Fluorescence intensities, representing average values of single nuclei or single cells, were derived from at least 40 images (number of analyzed cells > 1500), for which a representative series is shown in part B, after segmentation. (CE: chelidonine, pTyr- and pSer-STAT3: STAT3 phosphorylated on the tyrosine 705 and serine 727 residues, respectively).
Figure 4
Figure 4
Chelidonine decreases the expression of gp130 in the cell membrane in OCM-1 and OCM-3 cell lines. (AD) Representative flow cytometric histograms demonstrating the expression level of gp130 receptor subunits in DMSO- (light grey) and chelidonine-treated (dark grey) cells. The unlabeled DMSO-only-treated cells are depicted as empty dashed histograms. (E) Percentages of cells with reduced gp130 expression (OCM-1: black bars; OCM-3: grey bars). Percentages are expressed as mean ± SD values for at least three independent experiments, p < 0.001 (***). Cells treated with chelidonine (1 or 4 µg/mL) or DMSO for 24 h were stained with PE-conjugated mAb specific for gp130 and analyzed by flow cytometry (n = 10,000 cells/sample). (b.g.: background, CE: chelidonine).

Similar articles

Cited by

References

    1. Yu H., Lee H., Herrmann A., Buettner R., Jove R. Revisiting STAT3 signalling in cancer: New and unexpected biological functions. Nat. Rev. Cancer. 2014;14:736–746. doi: 10.1038/nrc3818. - DOI - PubMed
    1. Johnston P.A., Grandis J.R. STAT3 signaling: Anticancer strategies and challenges. Mol. Interv. 2011;11:18–26. doi: 10.1124/mi.11.1.4. - DOI - PMC - PubMed
    1. Tolomeo M., Cascio A. The Multifaced Role of STAT3 in Cancer and Its Implication for Anticancer Therapy. Int. J. Mol. Sci. 2021;22:603. doi: 10.3390/ijms22020603. - DOI - PMC - PubMed
    1. Hirano T. IL-6 in inflammation, autoimmunity and cancer. Int. Immunol. 2021;33:127–148. doi: 10.1093/intimm/dxaa078. - DOI - PMC - PubMed
    1. Wu M., Song D., Li H., Yang Y., Ma X., Deng S., Ren C., Shu X. Negative regulators of STAT3 signaling pathway in cancers. Cancer Manag. Res. 2019;11:4957–4969. doi: 10.2147/CMAR.S206175. - DOI - PMC - PubMed