. 2021 Dec 4;22(23):13136.
doi: 10.3390/ijms222313136.

Targeting MicroRNA-485-3p Blocks Alzheimer's Disease Progression

Affiliations

Targeting MicroRNA-485-3p Blocks Alzheimer's Disease Progression

Han Seok Koh et al. Int J Mol Sci. .

Erratum in

Abstract

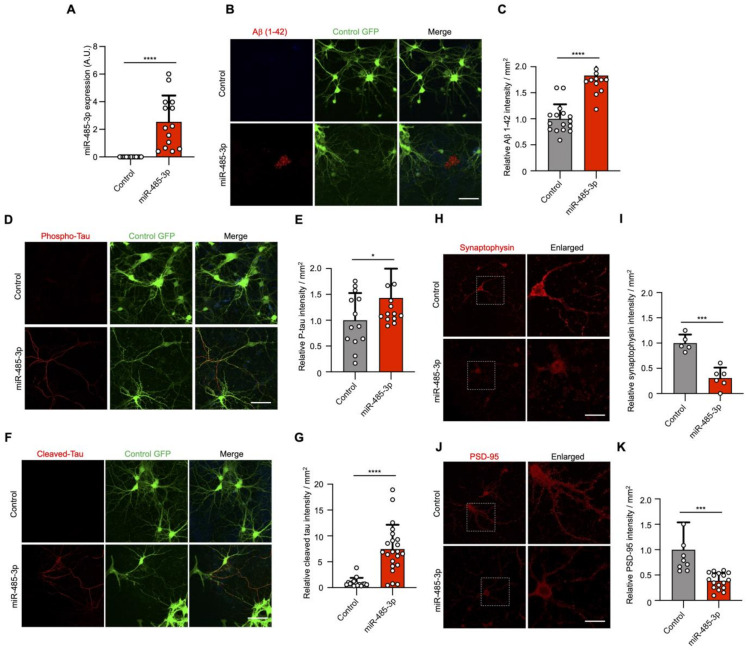
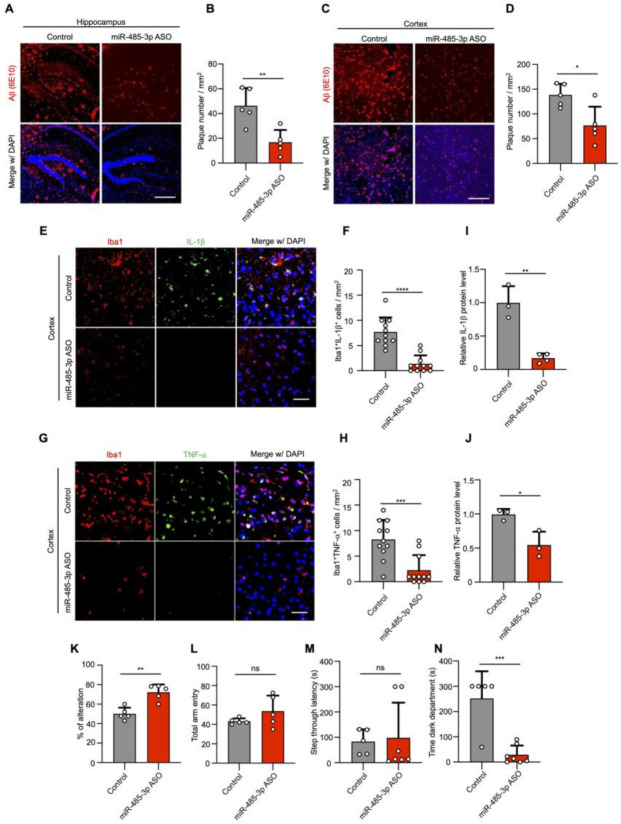
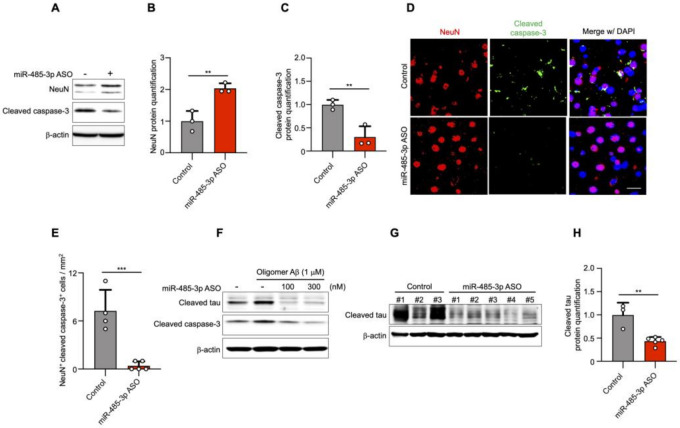
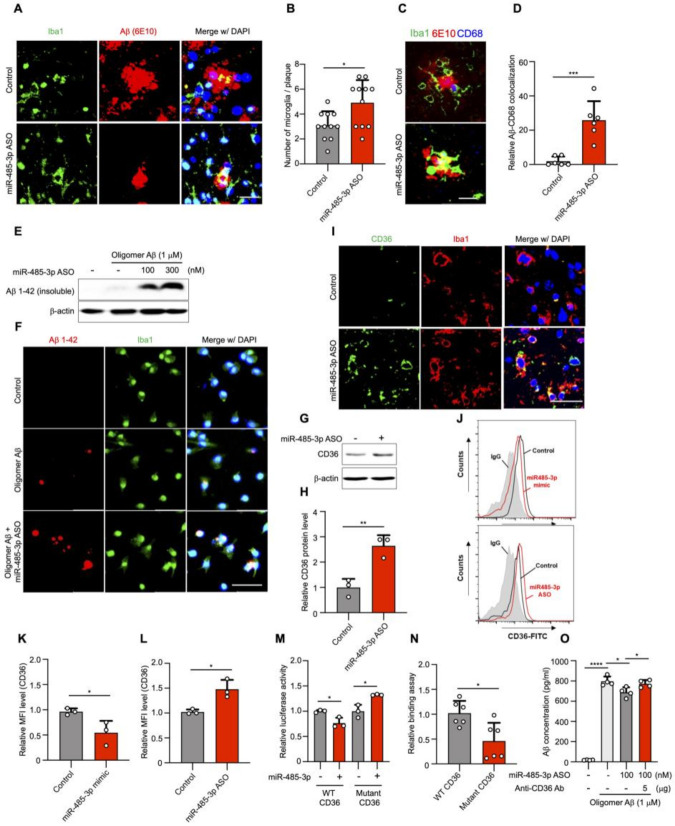
Alzheimer's disease (AD) is a form of dementia characterized by progressive memory decline and cognitive dysfunction. With only one FDA-approved therapy, effective treatment strategies for AD are urgently needed. In this study, we found that microRNA-485-3p (miR-485-3p) was overexpressed in the brain tissues, cerebrospinal fluid, and plasma of patients with AD, and its antisense oligonucleotide (ASO) reduced Aβ plaque accumulation, tau pathology development, neuroinflammation, and cognitive decline in a transgenic mouse model of AD. Mechanistically, miR-485-3p ASO enhanced Aβ clearance via CD36-mediated phagocytosis of Aβ in vitro and in vivo. Furthermore, miR-485-3p ASO administration reduced apoptosis, thereby effectively decreasing truncated tau levels. Moreover, miR-485-3p ASO treatment reduced secretion of proinflammatory cytokines, including IL-1β and TNF-α, and eventually relieved cognitive impairment. Collectively, our findings suggest that miR-485-3p is a useful biomarker of the inflammatory pathophysiology of AD and that miR-485-3p ASO represents a potential therapeutic candidate for managing AD pathology and cognitive decline.

Keywords: Alzheimer’s disease; IL-1β; TNF-α; antisense oligonucleotide; cognitive function; miR-485-3p; microRNA; neuroinflammation; tau; β-amyloid.


Conflict of interest statement

Biorchestra Co. filed a patent on miR-485-3p ASO described in this study, listing J.R. as inventors (serial no. US 16/443,700).

Figures

Figure 1
Figure 1
miR-485-3p is overexpressed in Alzheimer’s disease patients. (A) Results of differentially expressed miRNA analysis using founder-plasma samples from patients with AD (all patients were amyloid-PET positive, n = 3) and healthy controls (all subjects were amyloid-PET negative, n = 3). The red horizontal dotted line indicates p = 0.05. The two grey vertical dotted lines represent −1 and +1. Eighty-four miRNAs were normalized using 8 reference genes. (BD) Expression of miR-485-3p in the human frontal cortex by real-time PCR (healthy control [HC] n = 8; patients with AD n = 7) (B), precentral gyrus (healthy control [HC] n = 6; patients with AD n = 8) (C), and cerebrospinal fluid (CSF) (healthy control [HC] n = 6; patients with AD n = 7) (D). Data obtained across three independent experiments are expressed as mean ± SD. (EG) Expression patterns of miR-485-3p in the frontal cortex by real-time PCR (O/A n = 2; B/C n = 7) (E), precentral gyrus (O/A n = 4; B/C n = 10) (F), and CSF (O/A n = 3; B/C n = 10), (G) depending on the level of Aβ plaque accumulation. Level O/A means no or low densities of amyloid deposits in the isocortex, particularly in the basal portions of the frontal, temporal, and occipital lobes. Level B shows an increase in amyloid deposit levels in almost all isocortical association areas; only the primary sensory areas and primary motor field remained almost devoid of deposits. Level C is mainly characterized by virtually all isocortical areas being affected; deposits in the hippocampus show the same pattern as those in Level B. Data obtained across three independent experiments are expressed as mean ± SD. (HJ) Expression patterns of miR-485-3p in the frontal cortex by real-time PCR (stages 0 to 3: n = 8; stages 5 to 6 n = 7) (H), precentral gyrus (stages 0 to 1: n = 3; stages 2 to 3: n = 2; stages 4: n = 4; stage 5: n = 3; stage 6: n = 2) (I), and CSF (stages 0 to 3: n = 6; stages 4: n = 2; stages 5 to 6: n = 5) (J), depending on Braak stage. Data obtained across three independent experiments are expressed as mean ± SD. (K,M) Amyloid-PET images and standard uptake values (SUVs) of two clinical samples. Each SUV is displayed as a rainbow bar on the left. The images were obtained using a GE Discovery PET/CT 690 as a scanner and florbetaben as a tracer (K). Expression of miR-485-3p in plasma exosomes according to amyloid PET images (amyloid-PET-negative patients n = 14; amyloid-PET-positive patients n = 25) (L). Data obtained across three independent real-time PCR experiments are expressed as mean ± SD. Expression of miR-485-3p in plasma exosomes according to cognitive diagnostic results (healthy control n = 10; MCI patients n = 17; patients with AD patients n = 12) (M). Data obtained across three independent real-time PCR experiments are expressed as mean ± SD. For the frontal cortex (B,E,H), six repeat tests were performed per sample. In the case of the precentral gyrus (C,F,I), four repeat tests were performed per sample. In the case of CSF (D,G,J), nine repeat tests were performed per sample. For plasma (L,M), an average of 1.92 repeat tests per sample was performed. * p < 0.05; *** p < 0.001, **** p < 0.0001 (two-tailed t-test).
Figure 2
Figure 2
miRNA-485-3p induces accumulated Ab plaque, phosphorylated tau, cleaved tau, and reduced synaptophysin and PSD-95 conditions in primary mouse neurons. (A) After lentivirus-derived miR-485-3p transduction, miR-485-3p expression in primary mouse neurons was analyzed by real-time PCR (n = 14; data obtained across three independent experiments are expressed as mean ± S.E.M.). (B,C) Aβ 1–42 plaque immunofluorescence images of primary mouse neurons after lentivirus-derived miR-485-3p transduction (B). Scale bars, 20 μm. Data are representative of three independent experiments. Quantification of the Aβ 1–42 intensity (C) (two-tailed t-test; lenti-control n = 16, lenti-miR-485-3p n = 17; data are expressed as mean ± S.E.M. representing 1–5 randomly sampled regions, pooled from three independent experiments). (D,E) Phospho-tau immunofluorescence images of primary mouse neurons after lentivirus-derived miR-485-3p transduction (D). Scale bars, 20 μm. Data are representative of three independent experiments. Quantification of the phospho-tau intensity (E) (lenti-control n = 13, lenti-miR-485-3p n = 15; data are expressed as mean ± S.E.M. representing 1–5 randomly sampled regions, pooled from three independent experiments). (F,G) Cleaved tau immunofluorescence images of primary mouse neurons after lentivirus-derived miR-485-3p transduction (F). Scale bars, 20 μm. Data are representative of three independent experiments. Quantification of the cleaved tau intensity (G) (two-tailed t-test; lenti-control n = 15, lenti-miR-485-3p n = 22; data are expressed as mean ± S.E.M. representing 1–5 randomly sampled regions, pooled from three independent experiments). (HK) Synaptophysin (H) or PSD-95 (J) immunofluorescence images of primary mouse neurons after lentivirus-derived miR-485-3p transduction. Scale bars, 20 μm. Data are representative of three independent experiments. Quantification of the synaptophysin (I) or PSD-95 (K) intensity (two-tailed t-test; synaptophysin, lenti-control n = 5, lenti-miR-485-3p n = 6; PSD-95, lenti-control n = 9, lenti-miR-485-3p n = 17; data are expressed as mean ± S.E.M. representing 1–5 randomly sampled regions, pooled from three independent experiments). * p < 0.05; *** p < 0.001; **** p < 0.0001 (two-tailed t-test).
Figure 3
Figure 3
miR-485-3p antisense oligonucleotide (ASO) reduces Aβ pathology and neuroinflammation and rescues cognitive impairment. (AD) Representative images of immunohistochemical staining with Aβ (6E10) in the hippocampus (A) and cortex region (C) after either control oligonucleotide or miR-485-3p ASO injection. Scale bars, 300 μm. Quantification of the Aβ plaque in the hippocampus (B) and cortex region (D) (two-tailed t-test; n = 5; data are expressed as mean ± SD representing 1–3 randomly sampled regions, pooled from two independent experiments). (E) Representative images of immunohistochemical staining for Iba1 and IL-1β in the cortex region of control- or miR-485-3p ASO-injected 8-month-old 5XFAD mice. Scale bars, 20 μm. (F) Quantification of the Iba1+IL-1β cells from (E) (two-tailed t-test; n = 11; data are expressed as mean ± SD representing 1-4 randomly sampled regions, pooled from three independent experiments). (G) Representative images of immunohistochemical staining for Iba1 and TNF-α in the cortex region of control- or miR-485-3p ASO-injected 8-month-old 5XFAD mice. Scale bars, 20 μm. (H) Quantification of the Iba1+ TNF-α cells from (G) (two-tailed t-test; n = 11; data are expressed as mean ± SD representing 1-4 randomly sampled regions, pooled from three independent experiments). (I,J) Protein expression of IL-1β (I) and TNF-α (J) in the cortex of control- or miR-485-3p ASO-injected 5XFAD mice (data obtained across three independent experiments are expressed as mean ± SD). (KN) Behavior tests in control- (n = 5–7) or miR-485-3p ASO- (n = 5–7) injected 8-month-old 5XFAD mice. Y-maze (K,L) analysis and passive avoidance testing (M,N) of control- or miR-485-3p ASO-injected 8-month-old 5XFAD mice. Average alternation (%) (K) for control- or and miR-485-3p ASO-injected 5XFAD mice and total entry number (L) into each arm on the Y-maze. Average step-through latency (M) and time in the dark compartment in seconds (N) for control- and miR-485-3p ASO-injected 5XFAD mice in passive avoidance tests. All data are presented as mean ± SD. ns, not significant; * p < 0.05; ** p < 0.01; *** p < 0.001; **** p < 0.0001 (two-tailed t-test).
Figure 4
Figure 4
miR-485-3p antisense oligonucleotide (ASO) reduces apoptosis and truncated tau level. (A) Immunoblotting for NeuN and cleaved caspase-3 expression in fractions from the cortex region of control- or miR-485-3p ASO-injected 10-month-old 5XFAD mice. Data are representative of three independent experiments. (B,C) Relative protein quantification of NeuN (B) and cleaved caspase-3 (C) obtained from (A). Data obtained across four independent experiments are expressed as mean ± SD. (D) Immunohistochemical staining for NeuN and cleaved caspase-3 in coronal brain sections from control- or miR-485-3p ASO-injected 10-month-old 5XFAD mice. Scale bars, 20 μm. Data are representative of three independent experiments. (E) Quantification of the NeuN+cleaved caspase-3+ cells from control- (n = 4) or miR-485-3p ASO- (n = 5) injected 10-month-old 5XFAD mice. (F) Primary cortical neurons were treated with 1 μM oligomeric Aβ (1–42) for 6 h; lysates were immunoblotted with cleaved tau or cleaved caspase-3 antibodies. Data are representative of three independent experiments. (G) Immunoblotting for cleaved tau protein expression in control- (n = 3) or miR-485-3p ASO- (n = 5) injected 10-month-old 5XFAD mice. (H) Relative protein quantification of cleaved tau obtained from (G). Data obtained over three independent experiments are expressed as mean ± SD. ** p < 0.01; *** p < 0.001 (two-tailed t-test).
Figure 5
Figure 5
miR-485-3p antisense oligonucleotide enhances phagocytosis of Aβ by regulation of CD36 in vitro and in vivo. (A) Representative images of immunohistochemical staining for Iba1 and Aβ (6E10) in the cortex region of control- and miR-485-3p ASO-injected 8-month-old 5XFAD mice. Data are representative of five independent experiments. (B) Quantification of Iba1++ cells from (A) (control n = 13, miR-485-3p ASO n = 11 from five biologically independent samples). (C) Representative images of immunohistochemical staining for Iba1, CD68 (phagosome), and Aβ (6E10) in the cortex region of control- and miR-485-3p ASO-injected 8-month-old 5XFAD mice. Data are representative of three independent experiments. (D) Quantification of the Iba1+CD68++ cells from (C) (control n = 6, miR-485-3p ASO n = 6 from three biologically independent samples). (E) Control- or miR-485-3p ASO-transfected BV2 microglia treated with oligomer Aβ (1–42). After 4 h, the Ab insoluble fraction was analyzed by immunoblotting for analysis of uptake capacity. Data are representative of three independent experiments. (F) Primary mouse microglia were transfected with control or miR-485-3p ASO and treated with oligomer Aβ (1–42). After 4 h, the cells were examined by immunocytochemistry using Iba1 and 6E10 antibodies. Data are representative of three independent experiments. (G) CD36 protein expression in the cortex region of control- or miR-485-3p ASO-injected 8-month-old 5XFAD mice. Data are representative of three independent experiments. (H) Quantification of CD36 protein expression from (G). Data obtained across three independent experiments are expressed as mean ± SD. (I) Representative images of immunohistochemical staining with Iba1 and CD36 in coronal brain sections of control- or miR-485-3p ASO-injected 8-month-old 5XFAD mice. Data are representative of three independent experiments. (JL) Cell surface expression of CD36 was analyzed by flow cytometry using Alexa488-conjugated anti-CD36 antibody in control-, miR485-3p mimic-, or miR-485-3p ASO-transfected primary glial cells (J). Data are representative of three independent experiments. Relative quantification of CD36 expression in control and miR-485-3p (K) or control and miR-485-3p ASO (L) obtained from (J). Data obtained across three independent experiments are expressed as mean ± SD. (M) Relative luciferase activity in HEK293T cells co-transfected with CD36 3′-UTR WT or mutant reporter constructs and miR-control or miR-485-3p for 48 h. Data obtained across three independent experiments are expressed as mean ± SD. (N) Relative binding of miR-485-3p to the 3′ UTR of CD36 harboring mutant seed sequences, compared with those binding to the 3′ UTR of WT CD36. (O) Control- or miR-485-3p ASO-transfected microglial cells were treated with 1 μM oligomer Aβ (1–42) with IgG or a CD36-blocking antibody. After 4 h, the supernatant was analyzed using ELISA for phagocytosis. Data obtained across three independent experiments are expressed as mean ± SD. * p < 0.05; ** p < 0.01; *** p < 0.001; **** p < 0.0001 (two-tailed t-test).

References

    1. Hardy J., Selkoe D.J. The amyloid hypothesis of Alzheimer’s disease: Progress and problems on the road to therapeutics. Science. 2002;297:353–356. doi: 10.1126/science.1072994. - DOI - PubMed
    1. Hardy J.A., Higgins G.A. Alzheimer’s disease: The amyloid cascade hypothesis. Science. 1992;256:184–185. doi: 10.1126/science.1566067. - DOI - PubMed
    1. Ising C., Stanley M., Holtzman D. Current thinking on the mechanistic basis of Alzheimer’s and implications for drug development. Clin. Pharmacol. Ther. 2015;98:469–471. doi: 10.1002/cpt.200. - DOI - PubMed
    1. Selkoe D.J. The therapeutics of Alzheimer’s disease: Where we stand and where we are heading. Ann. Neurol. 2013;74:328–336. doi: 10.1002/ana.24001. - DOI - PubMed
    1. Sevigny J., Chiao P., Bussière T., Weinreb P.H., Williams L., Maier M., Dunstan R., Salloway S., Chen T., Ling Y., et al. The antibody aducanumab reduces Aβ plaques in Alzheimer’s disease. Nature. 2016;537:50–56. doi: 10.1038/nature19323. - DOI - PubMed

MeSH terms

LinkOut - more resources