. 2021 Nov 28;13(23):5984.
doi: 10.3390/cancers13235984.

Organ Specific Copy Number Variations in Visceral Metastases of Human Melanoma

Affiliations

Organ Specific Copy Number Variations in Visceral Metastases of Human Melanoma

Orsolya Papp et al. Cancers (Basel). .

Abstract

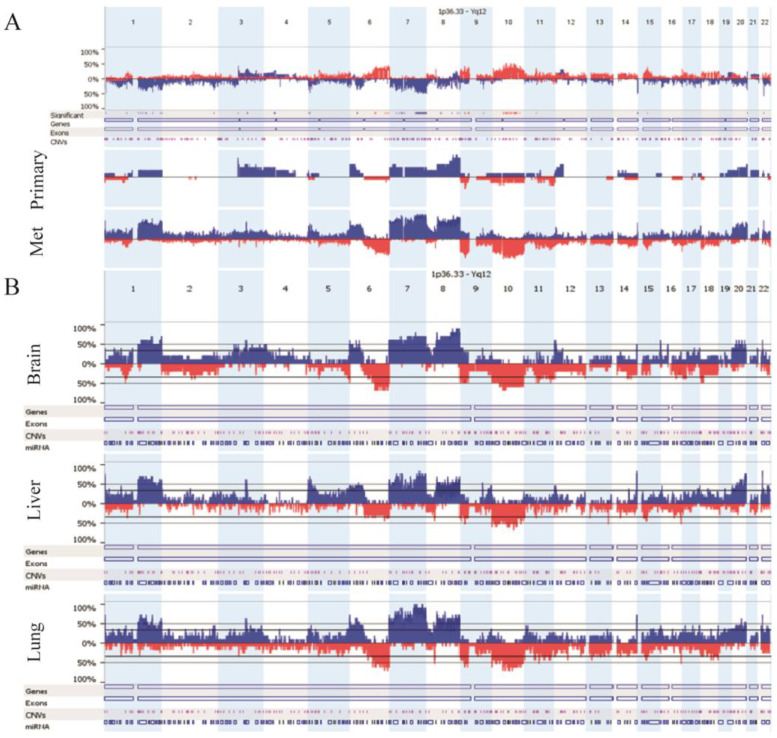
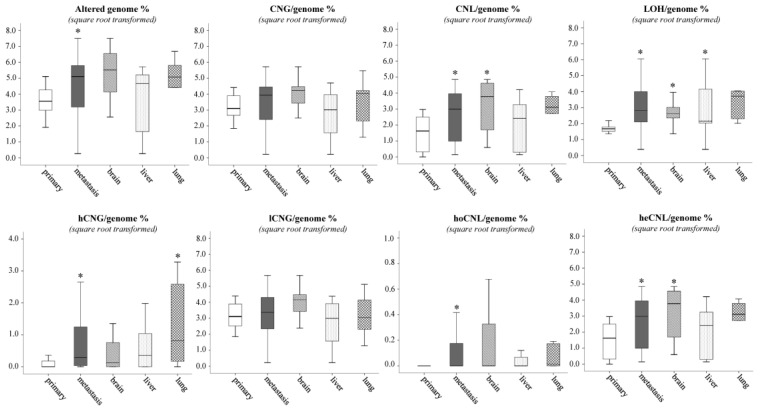
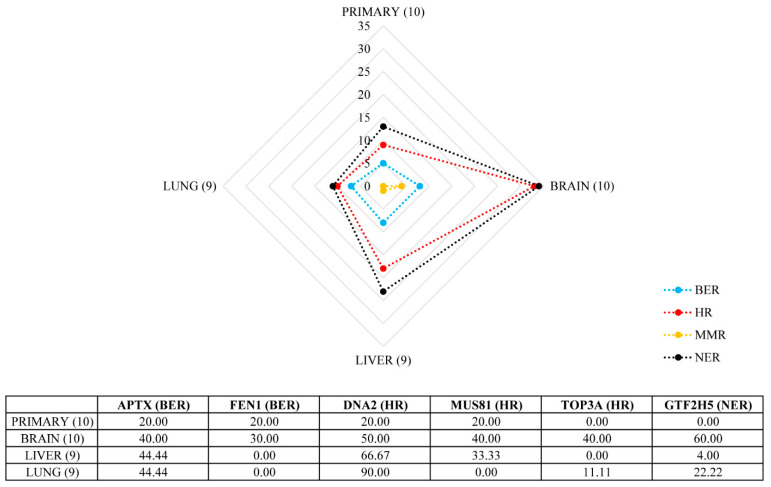
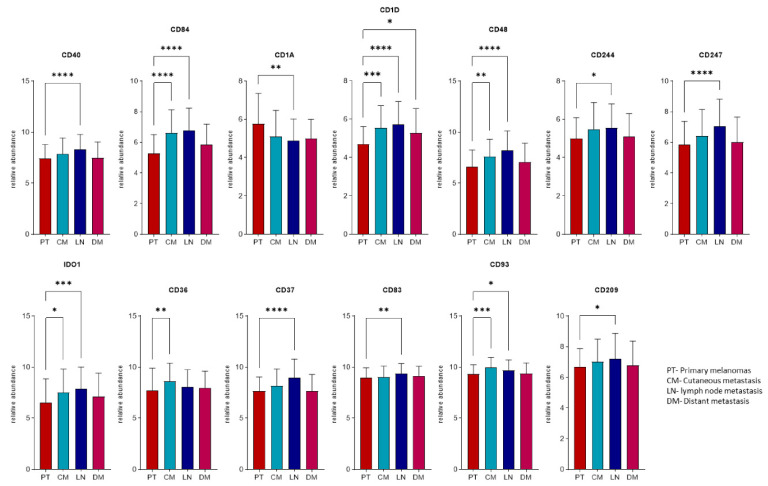
Malignant melanoma is one of the most aggressive skin cancers with high potential of visceral dissemination. Since the information about melanoma genomics is mainly based on primary tumors and lymphatic or skin metastases, an autopsy-based visceral metastasis biobank was established. We used copy number variation arrays (N = 38 samples) to reveal organ specific alterations. Results were partly completed by proteomic analysis. A significant increase of high-copy number gains was found in an organ-specific manner, whereas copy number losses were predominant in brain metastases, including the loss of numerous DNA damage response genes. Amplification of many immune genes was also observed, several of them are novel in melanoma, suggesting that their ectopic expression is possibly underestimated. This "immunogenic mimicry" was exclusive for lung metastasis. We also provided evidence for the possible autocrine activation of c-MET, especially in brain and lung metastases. Furthermore, frequent loss of 9p21 locus in brain metastases may predict higher metastatic potential to this organ. Finally, a significant correlation was observed between BRAF gene copy number and mutant allele frequency, mainly in lung metastases. All of these events may influence therapy efficacy in an organ specific manner, which knowledge may help in alleviating difficulties caused by resistance.

Keywords: BRAF and NRAS mutant allele frequency; DDR deficiency; HGF/MET autocrine activation; distant organ metastasis; immunogenic mimicry.


Conflict of interest statement

The authors declare no conflict of interest.

Figures

Figure 1
Figure 1
CNV landscape of examined melanoma samples: (A) primary tumors vs. distant melanoma metastases, (B) distinct distant metastatic sites (brain vs. liver vs. lung). Blue and red colors indicate copy number gains and losses, respectively.
Figure 2
Figure 2
Distribution of CNV types between primary tumors and distant metastases from distinct sites. Asterisk means the level of significance (* p ≤ 0.05). Kruskal–Wallis test was used for the multiple group comparisons, and Mann–Whitney–Wilcoxon test was applied for the primary vs. all metastasis analysis. Abbreviations: CNG, copy number gain (CN > 2); CNL, copy number loss (CN < 2); LOH, loss of heterozygosity; hCNG, high-copy number gain (CN ≥ 4); lCNG, low-copy number gain (4 > CN > 2); hoCNL, homozygous copy number loss (CN = 0); heCNL, heterozygous copy number loss (2 > CN > 0).
Figure 3
Figure 3
Copy number loss (CNL) frequency in different melanoma metastases affecting genes coding proteins in DDR subpathways. Radar chart represents the CNL frequency in primary melanomas and visceral metastases. In brackets, we indicated the count of samples resected from primary tumors and a given metastatic site. The vertical axis represents the number of genes altered in any of the DDR subpathways. Table shows the frequency (percentage) of the TOP6 DDR genes affected in melanoma. Abbreviations: DDR, DNA damage repair; BER, base excision repair; HR, homologous recombination; MMR, mismatch repair, NER, nucleotide excision repair.
Figure 4
Figure 4
Shared and specific chromosomal regions distorted by high-copy number gains (CN ≥ 4) and homozygous losses. Blue and red arrows represent copy number gains and number losses, respectively.
Figure 5
Figure 5
Relative abundance levels of the transcripts differentially expressed in at least one group of metastases relative to primary melanomas. Asterix represents the level of significance (* p < 0.05; ** p < 0.01; *** p < 0.001; **** p < 0.0001) using analysis of variance (ANOVA) test adjusted with the Benjamini–Hochberg method and an additional Tukey–Kramer post hoc test for each ANOVA analysis.
Figure 6
Figure 6
Relative abundance levels of proteins with significant differences between sample origin-based groups in the proteomics cohorts. (A) Proteins with significant differences between at least two groups from the prospective cohort. (B) Proteins with significant differences between at least two groups from the postmortem cohort. Asterisks represent the level of significance (* p < 0.05; ** p < 0.01) using Analysis of Variance (ANOVA) test adjusted with the Benjamini–Hochberg method and an additional Tukey–Kramer post hoc test for each ANOVA analysis.

References

    1. Alexandrov L.B., Nik-Zainal S., Wedge D.C., Aparicio S.A.J.R., Behjati S., Biankin A.V., Bignell G.R., Bolli N., Borg A., Børresen-Dale A.-L., et al. Signatures of mutational processes in human cancer. Nature. 2013;500:415–421. doi: 10.1038/nature12477. - DOI - PMC - PubMed
    1. Makohon-Moore A.P., Lipson E.J., Hooper J.E., Zucker A., Hong J., Bielski C.M., Hayashi A., Tokheim C., Baez P., Kappagantula R., et al. The Genetic Evolution of Treatment-Resistant Cutaneous, Acral, and Uveal Melanomas. Clin. Cancer Res. 2021;27:1516–1525. doi: 10.1158/1078-0432.CCR-20-2984. - DOI - PMC - PubMed
    1. Liu L., Bai X., Wang J., Tang X.-R., Wu D.-H., Du S.-S., Du X.-J., Zhang Y.-W., Zhu H.-B., Fang Y., et al. Combination of TMB and CNA Stratifies Prognostic and Predictive Responses to Immunotherapy Across Metastatic Cancer. Clin. Cancer Res. 2019;25:7413–7423. doi: 10.1158/1078-0432.CCR-19-0558. - DOI - PubMed
    1. Reimann J.D.R., Salim S., Velazquez E.F., Wang L., Williams K.M., Flejter W.L., Brooke L., Sunder S., Busam K.J. Comparison of melanoma gene expression score with histopathology, fluorescence in situ hybridization, and SNP array for the classification of melanocytic neoplasms. Mod. Pathol. 2018;31:1733–1743. doi: 10.1038/s41379-018-0087-6. - DOI - PMC - PubMed
    1. Chin L., Garraway L.A., Fisher D.E. Malignant melanoma: Genetics and therapeutics in the genomic era. Genes Dev. 2006;20:2149–2182. doi: 10.1101/gad.1437206. - DOI - PubMed