. 2021 Dec 2;13(23):6075.
doi: 10.3390/cancers13236075.

Tumor-Infiltrating Lymphocytes and Cancer Markers in Osteosarcoma: Influence on Patient Survival

Affiliations

Tumor-Infiltrating Lymphocytes and Cancer Markers in Osteosarcoma: Influence on Patient Survival

José Manuel Casanova et al. Cancers (Basel). .

Abstract

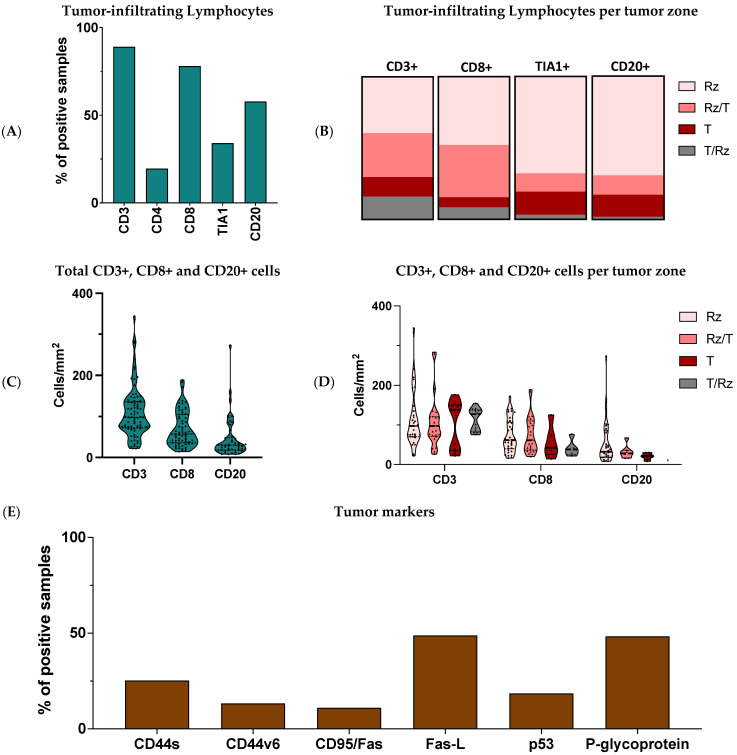
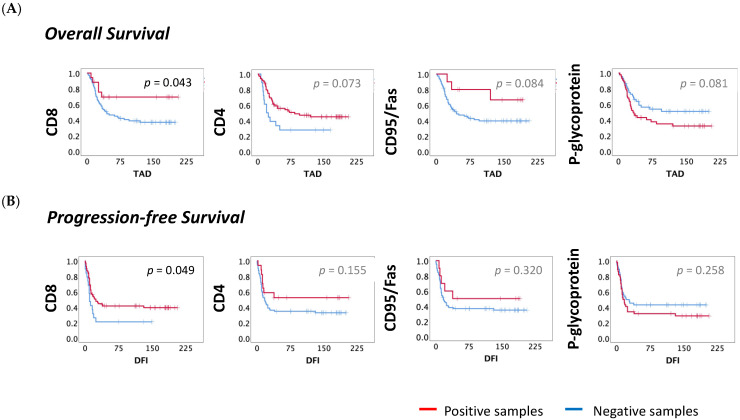
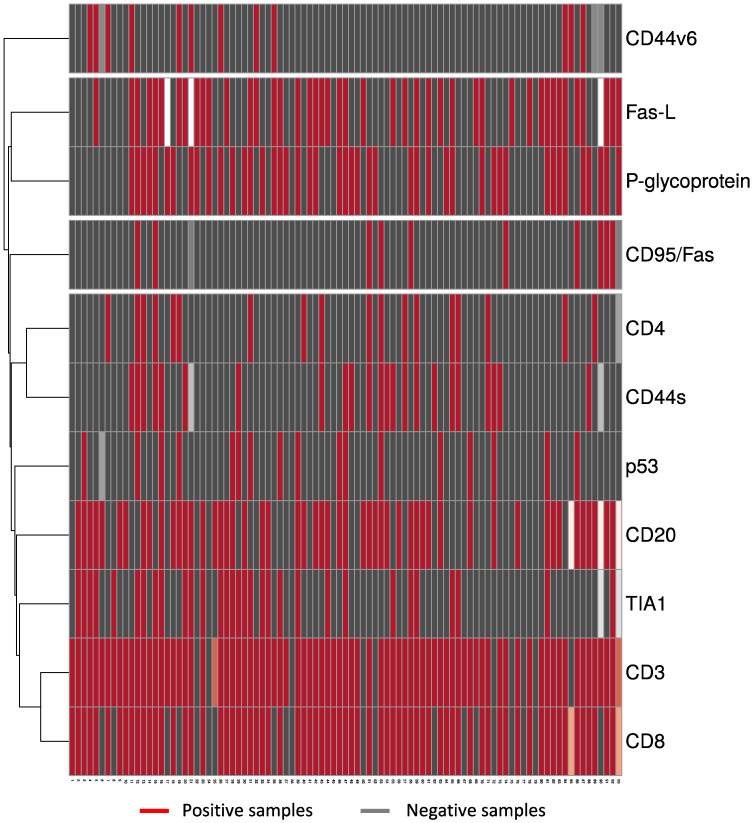
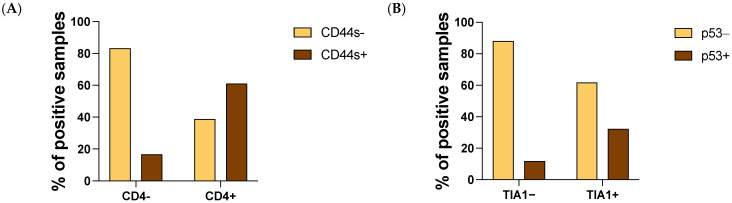
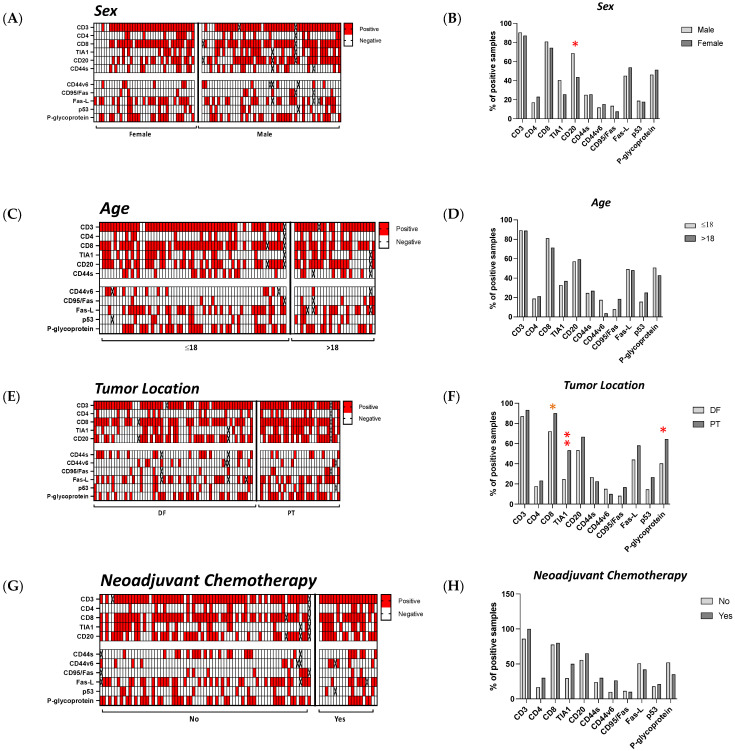
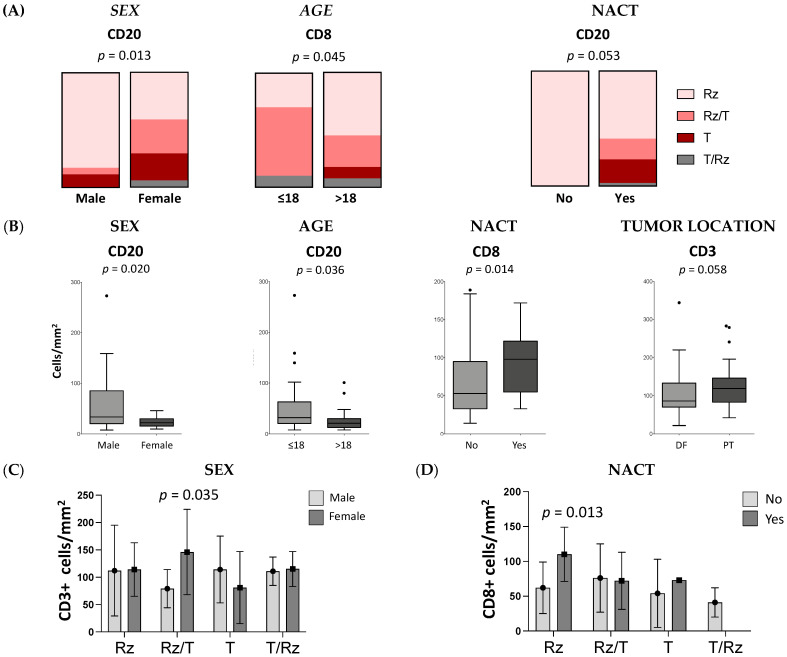
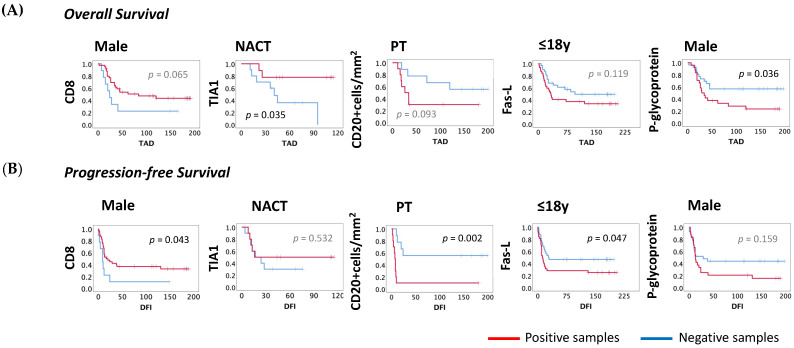
Osteosarcoma (OST) is the most common type of high-grade primary bone tumor, which mainly affects young adults. The current standard of care for OST combines surgical resection with chemotherapy. The clinical outcomes and the current options to treat OST patients are unsatisfactory and novel treatment strategies are needed. The crosstalk between tumor cells and immune cells is essential to the OST microenvironment. Despite the efforts that have been made to address the importance of immune-related factors in OST, there is still a lot to understand. The purpose of the current study was to evaluate the tumor-infiltrating lymphocytes (TIL), the expression of proteins involved in tumor biology, and their impact on the clinical outcome of OST patients. We studied 93 samples of OST patients using immunohistochemistry and histomorphometry. We looked for the infiltration of CD3+, CD4+, CD8+, TIA1+ and CD20+ cells and for the expression of CD44 standard (CD44s) and variant 6 (CD44v6), CD95/Fas, Fas-L, p53 and p-glycoprotein. All the parameters were analyzed for the influence on the occurrence of death and metastasis, plus patient overall survival (OS) and progression-free survival (PFS). The effect of sex, age, tumor location (distal femur or proximal tibia) and the combination with neoadjuvant chemotherapy was also assessed. Our results suggest that the presence of tumor-infiltrating CD4+ cells provides protection to OST patients, and that CD8+ cells have a significant impact on the patient's overall survival (OS) and progression-free survival (PFS), which is more evident in male patients. In addition, a strong association between tumor-infiltrating CD4+ cells and the presence of CD44s expression in tumor samples was observed. Analysis of TIL and tumor markers related to tumor biology could be useful to stratify patients and monitor the response to therapy, as well as to assist with the development of immunotherapy strategies to improve the effects of cytotoxic TIL to eradicate the tumor cells.

Keywords: osteosarcoma; survival; tumor markers; tumor microenvironment; tumor-infiltrating lymphocytes.


Conflict of interest statement

The authors declare no conflict of interest.

Figures

Figure 1
Figure 1
Characterization of the OST microenvironment. Tumor tissues were collected from 93 OST patients and evaluated through IHC staining. (A) Frequency of positive samples for CD3+, CD4+, CD8+, TIA1+ and CD20+ infiltration. (B) Distribution of the CD3+, CD8+, TIA1+ and CD20+ cells according to the tumoral region. (C) CD3+, CD8+ and CD20+ cell number. (D) CD3+, CD8+ and CD20+ cell number according to the tumoral region. (E) Frequency of positive samples for CD44s, CD44v6, CD95/Fas, Fas-L, p53 and p-glycoprotein expression. Rz—reactive zone; T—tumor zone; IHC—Immunohistochemical.
Figure 2
Figure 2
OS and PFS curves according to TILs and the molecules expressed in the tumor. The survival curves for OS and PFS were obtained by the Kaplan–Meyer (Log-rank) method. (A) Impact on OS—The median OS for infiltration of CD8+ and CD4+ cells, expression of CD95/Fas and p-glycoprotein non-expression were higher when compared to their counterparts ((CD8−: TAD = 61, N = 18; vs. CD8+: TAD = 112, N = 69); (CD4−: TAD = 94, N = 71; vs. CD4+: TAD = 149, N = 17); (CD95/Fas−: TAD = 99, N = 77 vs. CD95/Fas+: TAD = 150, N = 10); (p-glycoprotein−: TAD = 117, N = 45; p-glycoprotein+: TAD = 87, N = 44)). (B) Impact on PFS—The median PFS for CD8 infiltration was longer when compared to their counterpart (CD8−: DFI = 39, N = 19 vs. CD8+: DFI = 91, N = 69). IHC—Immunohistochemical; OS—overall survival (months); PFS—progression-free survival; TAD—time after diagnosis (months); DFI—disease-free interval (months). Statistical significance was set at p < 0.05.
Figure 3
Figure 3
Heatmap of the interactions of TIL and molecules expressed in the tumor. Tumor tissues were collected from 93 OST patients and evaluated using IHC staining. Multivariate cluster analysis was applied to rows for interactions between the presence of CD3+, CD4+, CD8+, TIA1+, and CD20+ cells and the expression of CD44s, CD44v6, CD95/Fas, Fas-L, p53 and p-glycoprotein. ClustVis was accessed online [27] to visualize the clustering of multivariate data using heatmaps. IHC—Immunohistochemical.
Figure 4
Figure 4
Interaction of CD4 and TIA infiltration with CD44s and p53, respectively, expressed in the tumor. Tumor tissues were collected from 93 OST patients and evaluated using IHC staining. (A) Frequency of infiltrating CD4+ cells regarding CD44s tumoral expression. (B) Frequency of infiltrating TIA1+ cells regarding p53 expression. IHC—Immunohistochemical.
Figure 5
Figure 5
Characterization of the OST microenvironment considering sex, age, tumor location and the use of neoadjuvant chemotherapy. Tumor tissues were collected from 93 OST patients and evaluated using IHC staining. Statistical analysis of the CD3+, CD4+, CD8+, TIA1+, and CD20+ cell infiltration and of the CD44s, CD44v6, CD95/Fas, Fas-L, p53 and p-glycoprotein expression was performed. (A) Representative heatmap of the positive and negative samples according to sex. (B) Frequency of positive samples in males and females (male: N = 54; female: N = 39). (C) Representative heatmap of positive and negative samples according to age. (D) Frequency of positive samples in younger and older patients (≤18: N = 65; >18: N = 28). (E) Representative heatmap of positive and negative samples according to tumor location. (F) Frequency of positive samples in patients with the tumor located at the DF or PT (DF: N = 62; PT: N = 31). (G) Representative heatmap of positive and negative samples according to neoadjuvant chemotherapy. (H) Frequency of positive samples in patients without any prior treatment to surgery and those that had undergone neoadjuvant chemotherapy (no-NACT: N = 73; NACT: N = 20). Fisher’s exact test was used for comparative analysis. IHC—Immunohistochemical; DF—distal femur; PT—proximal tibia; p-value < 0.05 * or < 0.01 **.
Figure 6
Figure 6
The influence of cell distribution and number on sex, age, tumor location or neoadjuvant chemotherapy. Tumor tissues were collected from 93 OST patients and evaluated using IHC staining. (A) Illustration of the tumoral distribution of CD20+ cells by sex, CD8+ cells by age and CD20+ cells by neoadjuvant chemotherapy. Comparative analysis was performed using Fisher’s exact test. (B) Count of CD20+ cells according to sex and age, CD3+ cells according to tumor location and CD8+ cells according to neoadjuvant chemotherapy. (C) CD3+ cell count per tumoral region in males and females (Rz/T: females = 146, SD = 78, N = 10; vs. males = 79 cells, SD = 35, N = 15). (D) CD8+ cell count per tumoral region in no-NACT and NACT patients (Rz: NACT = 110, SD = 39, N = 8; vs. no-NACT = 62, SD = 37, N = 26). Mann–Whitney U test was used to compare means between two groups and two-way ANOVA followed by Sidak’s multiple comparisons test was used to compare more than two groups. IHC—Immunohistochemical; DF—distal femur; PT—proximal tibia; NACT—neoadjuvant chemotherapy; Rz—reactive zone; T—tumor zone.
Figure 7
Figure 7
OS and PFS curves of TILs and molecules expressed in the tumor according to sex, age, tumor location and neoadjuvant chemotherapy. The survival curves were obtained by the Kaplan–Meyer (Log-rank) method. (A) Impact on OS—In male patients, the OS for p-glycoprotein non-expression was higher when compared to their counterpart (p-glycoprotein−: TAD = 123.477, N = 27; vs. p-glycoprotein+: TAD = 71.788, N = 24). In addition, in males the PFS for CD8+ cell infiltration was higher compared with their counterpart (CD8−: DFI = 24, N = 9; vs. CD8+: DFI = 76, N = 40). (B) Impact on PFS—In younger patients, the PFS for FasL expression was lower compared with their counterpart (Fas-L−: DFI = 100, N = 32; vs. Fas-L+: DFI = 63, N = 32). In NACT patients, the OS for TIA1+ cell infiltration was higher compared with the absence of infiltration (TIA1−: TAD = 52, N = 10; vs. TIA1+: TAD = 95, N = 9). In patients with tumors located in the PT region, the PFS for the cell number of infiltrating CD20+ cells were higher compared with their counterpart (CD20−: 118, N = 9; vs. CD20+: 24, N = 10). IHC—Immunohistochemical; OS–overall survival (months); PFS—progression-free survival; TAD—time after diagnosis (months); DFI—disease-free interval (months); NeoChem—Patients treated with neoadjuvant chemotherapy. Statistical significance was set at p < 0.05.

References

    1. Kansara M., Teng M.W., Smyth M.J., Thomas D.M. Translational biology of osteosarcoma. Nat. Rev. Cancer. 2014;14:722–735. doi: 10.1038/nrc3838. - DOI - PubMed
    1. Tang H., Tang Z., Jiang Y., Wei W., Lu J. Pathological and therapeutic aspects of matrix metalloproteinases: Implications in osteosarcoma. Asia Pac. J. Clin. Oncol. 2019;15:218–224. doi: 10.1111/ajco.13165. - DOI - PubMed
    1. Casali P.G., Bielack S., Abecassis N., Aro H.T., Bauer S., Biagini R., Bonvalot S., Boukovinas I., Bovee J.V.M.G., Brennan B., et al. ESMO Guidelines Committee, PaedCan and ERN EURACAN. Bone sarcomas: ESMO-PaedCan-EURACAN Clinical Practice Guidelines for diagnosis, treatment and follow-up. Ann. Oncol. 2018;29:iv79–iv95. doi: 10.1093/annonc/mdy310. - DOI - PubMed
    1. Geller D.S., Gorlick R. Osteosarcoma: A review of diagnosis, management, and treatment strategies. Clin. Adv. Hematol. Oncol. 2010;8:705–718. PMID: 21317869. - PubMed
    1. Lindsey B.A., Markel J.E., Kleinerman E.S. Osteosarcoma Overview. Rheumatol. Ther. 2017;4:25–43. doi: 10.1007/s40744-016-0050-2. - DOI - PMC - PubMed