. 2021 Dec 9;4(1):1360.
doi: 10.1038/s42003-021-02872-x.

AMPK modulation ameliorates dominant disease phenotypes of CTRP5 variant in retinal degeneration

Affiliations

AMPK modulation ameliorates dominant disease phenotypes of CTRP5 variant in retinal degeneration

Kiyoharu J Miyagishima et al. Commun Biol. .

Abstract

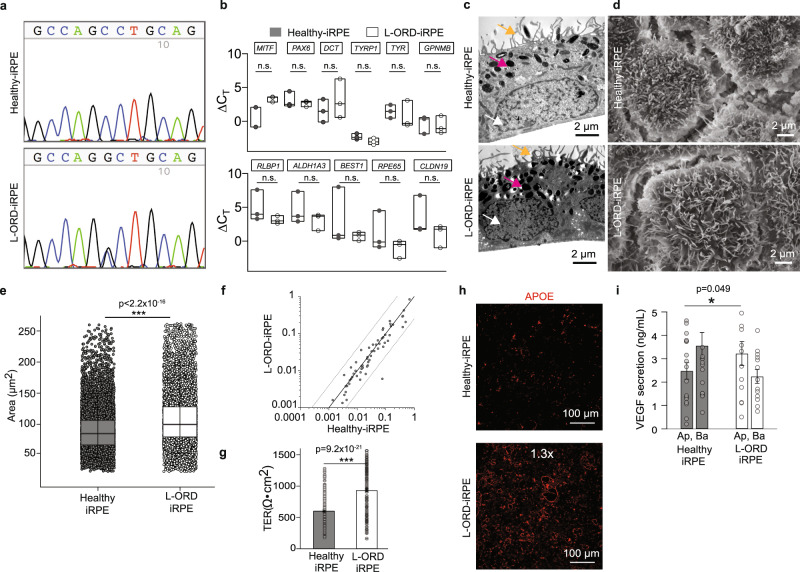
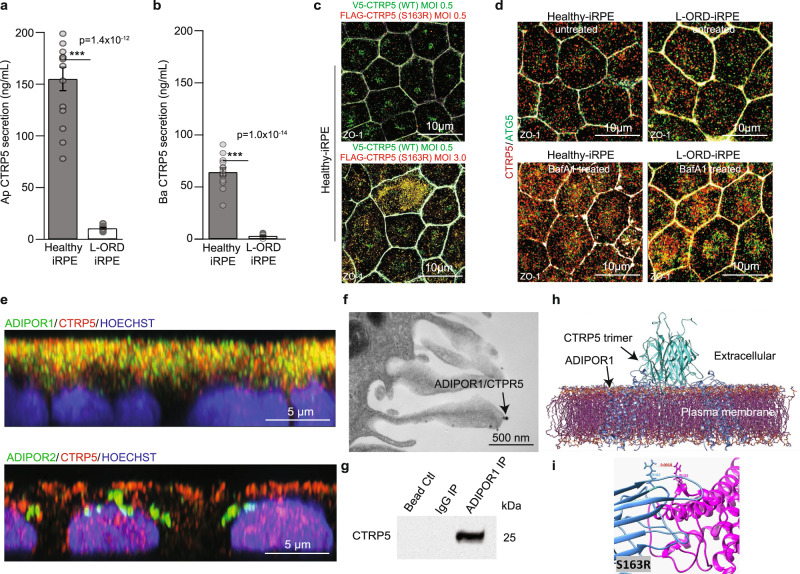
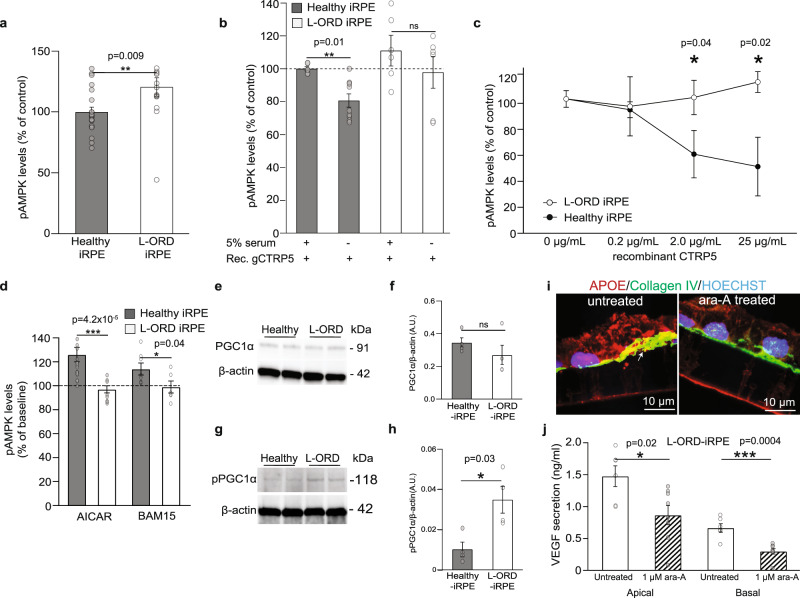
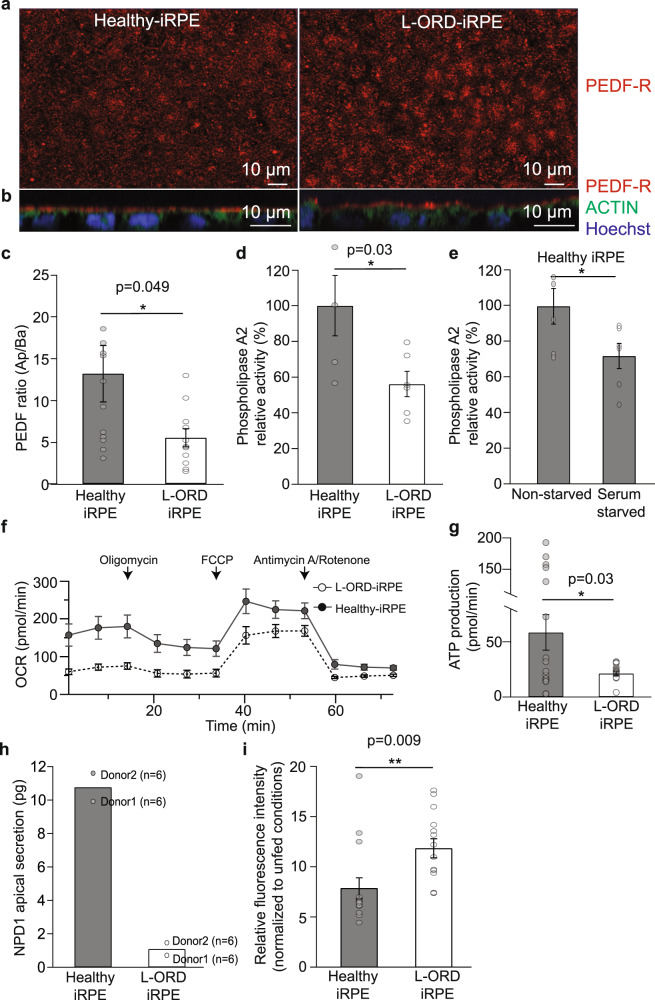
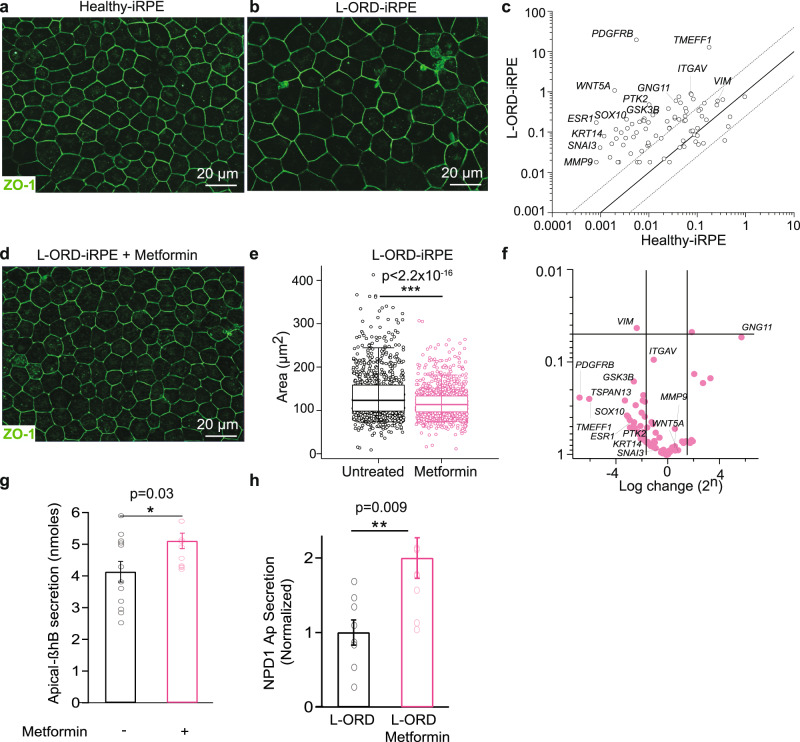
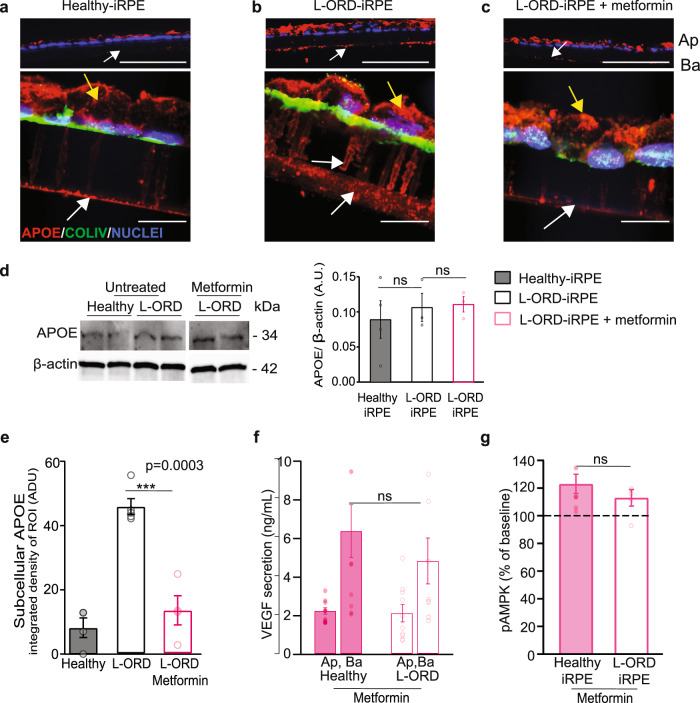
Late-onset retinal degeneration (L-ORD) is an autosomal dominant disorder caused by a missense substitution in CTRP5. Distinctive clinical features include sub-retinal pigment epithelium (RPE) deposits, choroidal neovascularization, and RPE atrophy. In induced pluripotent stem cells-derived RPE from L-ORD patients (L-ORD-iRPE), we show that the dominant pathogenic CTRP5 variant leads to reduced CTRP5 secretion. In silico modeling suggests lower binding of mutant CTRP5 to adiponectin receptor 1 (ADIPOR1). Downstream of ADIPOR1 sustained activation of AMPK renders it insensitive to changes in AMP/ATP ratio resulting in defective lipid metabolism, reduced Neuroprotectin D1(NPD1) secretion, lower mitochondrial respiration, and reduced ATP production. These metabolic defects result in accumulation of sub-RPE deposits and leave L-ORD-iRPE susceptible to dedifferentiation. Gene augmentation of L-ORD-iRPE with WT CTRP5 or modulation of AMPK, by metformin, re-sensitize L-ORD-iRPE to changes in cellular energy status alleviating the disease cellular phenotypes. Our data suggests a mechanism for the dominant behavior of CTRP5 mutation and provides potential treatment strategies for L-ORD patients.


Conflict of interest statement

The authors declare no competing interests.

Figures

Fig. 1
Fig. 1. L-ORD-iRPE replicates disease cellular phenotype in a dish.
a Sanger sequencing confirms the presence of p.Ser163Arg variant in L-ORD-iPSCs. The heterozygous single nucleotide variant in C1QTNF5 (c.489 C > C/G) appears as a peak within a peak. b Boxplots of ΔCt values for RPE signature genes are comparable in healthy and L-ORD-iRPE (boxplots represent n = 3 independent experiments from at least two donors; 25th, median, and 75th percentiles correspond to the bottom, middle, and top of each box). c TEM images of healthy and L-ORD-iRPE monolayers show polarized RPE structure including abundant apical processes (orange arrow), melanosomes (magenta arrow), and basally located nuclei (white arrow). Scale bar: 2 µm. d SEM images of healthy-iRPE and L-ORD-iRPE demonstrate hexagonal morphology and abundant apical processes. Scale bar: 2 µm. e Boxplot of cell area reveals larger cell size in L-ORD-iRPE than heathy-iRPE. iRPE monolayers were immunostained with membrane marker (ADIPOR1) to outline their hexagonal shape (healthy-iRPE: n = 9; L-ORD-iRPE: n = 6). Total of n > 10,000 cells counted. f Scatterplot of dedifferentiation-related genes shows no difference in L-ORD-iRPE (n = 2 donors) compared to healthy-iRPE (n = 2 donors). g Transepithelial resistance (TER) measurements were performed using an epithelial voltohmmeter in L-ORD-iRPE (n = 264 inclusive of all clones, two donors) compared to healthy-iRPE (n = 266 inclusive of all clones, 2 donors). (h) Comparative analysis of sub-RPE APOE (red)-positive deposits (n = 25) in healthy-iRPE (n = 11) and L-ORD-iRPE (n = 14) show 1.3-fold (p = 0.01) increase in APOE staining. Hoechst 33342 staining confirms the lack of cellular debris contributing towards APOE staining. Scale bar: 100 µm. i Apical and basal VEGF secretion is mispolarized in L-ORD-iRPE (white, n = 13) compared with healthy-iRPE (gray, n = 17). For validation of iPSC-derived lines and karyotyping analysis: See Table 1 and Fig. S1. ∗p < 0.05; ∗∗∗p < 0.001; ns not significant.
Fig. 2
Fig. 2. Expression and localization of CTRP5 in L-ORD-iRPE.
a, b Apical and basal CTRP5 secretion measured by ELISA in the culture medium are both significantly decreased (n = 14). c Coexpression of V5-tagged WT CTRP5 (green) and FLAG-tagged S163R CTRP5 (red) in healthy-iRPE. V5-tagged WT CTRP5 expressing lentivirus construct was transduced at MOI 0.5 for both top and bottom panels. MOI of Flag-tagged S163R CTRP5 expressing lentivirus construct was 0.5 for cells in the top panel and 3.0 for cells in the bottom panel. Scale bar: 10 µm d Confocal microscopy images of untreated and bafilomycin (BafA1) treated (3 h) healthy-iRPE and L-ORD-iRPE co-stained with CTRP5 (red) and ATG5 (green). (n = 3 images per condition). Scale bar: 10 µm. e Representative confocal microscopy images showing colocalization of CTRP5 (red) with membrane receptors ADIPOR1 (green, upper panel) and no colocalization with ADIPOR2 (green, lower panel). Nuclear stain (blue). Scale bar: 5 µm. f TEM image of immunogold labeled ADIPOR1 (6 nm gold particle) and CTRP5 (12 nm gold particle) demonstrate the co-binding of two proteins (arrow). Scale bar: 500 nm. g Western blot detects CTRP5 in the membrane fraction of iRPE cells immunoprecipitated using anti-ADIPOR1 antibodies and not in lanes immunoprecipitated with the IgG antibody or with only beads. h Probabilistic model of the interaction of integral membrane protein ADIPOR1 (blue) and CTRP5 (teal) determined using published crystallographic structures and refined by molecular dynamics. i The polar serine to arginine substitution on CTRP5 (blue) is predicted to have an electrostatic repulsive interaction with neighboring arginine residue, Arg122, on ADIPOR1 (magenta) reducing the likelihood of interaction. See also Fig. S4. ∗∗∗p < 0.001.
Fig. 3
Fig. 3. Reduced antagonism of CTRP5 on ADIPOR1 results in altered AMPK signaling in L-ORD-iRPE.
a pAMPK levels determined by ELISA in L-ORD-iRPE (n = 15; 120.6% ± 0.08) compared to healthy-iRPE (n = 21; 100% ± 0.04), cultured in 5% serum-containing media. b Effect of recombinant globular CTRP5 (0.2 µg/mL) on pAMPK levels in the presence (+) or absence (−) of serum in healthy-iRPE (81% ± 4, n = 9) and L-ORD-iRPE (99% ± 1, n = 6), measured by ELISA. Data were normalized to the untreated condition (0 µg/mL gCTRP5), considered as 100%. c Effects of recombinant full-length CTRP5 (0.2, 2, and 25 µg/mL) on pAMPK levels in healthy-iRPE (n = 6) and L-ORD-iRPE (n = 6) incubated in serum-free medium for 5 h, measured by ELISA. d Effect of increasing cytosolic AMP with AICAR (an AMP analog, 2 mM) treatment or decreasing ATP with BAM15 (a mitochondrial uncoupler, 500 nM) on AMPK activity in healthy-iRPE and L-ORD-iRPE. All data were normalized to the 0% serum-containing untreated condition (AICAR: n = 20 for healthy-iRPE, n = 16 for L-ORD-iRPE; BAM15: n = 8 for healthy-iRPE, and n = 6 for L-ORD-iRPE). e Representative Western blot of PGC1α expression in healthy and L-ORD-iRPE. f Quantification of Western blots for PGC1α. Healthy-iRPE (n = 4). L-ORD-iRPE (n = 4). g Representative Western blot for phospho (S570)-PGC1α in L-ORD-iRPE compared to healthy-iRPE. h Quantification of Western blots for phosphor (S570)-PGC1 α in healthy-iRPE (n = 4) and L-ORD-iRPE (n = 4). i APOE expression (red) in untreated and adenine 9-beta-d-arabinofuranoside (1 µM, ara-A) treated L-ORD-iRPE. Collagen IV (green) marks RPE basal surface and nuclei (blue) are labeled with Hoechst 33342. (n = 3 images each) Scale bar: 10 µm. j ELISA detection of apical and basal VEGF secretion in untreated and adenine 9-beta-d-arabinofuranoside (1 µM, ara-A) treated L-ORD-iRPE (n = 6). ∗p < 0.05; ∗∗p < 0.01; ∗∗∗p < 0.001; ns not significant, AU arbitrary units.
Fig. 4
Fig. 4. Altered lipid metabolism in L-ORD-iRPE contributes to reduced neuroprotective signaling.
a, b PEDF-R (red) immunolabeling in healthy-iRPE and L-ORD-iRPE. Cell nuclei (blue) and the actin cytoskeleton (phalloidin, green). Healthy-iRPE (n = 8), L-ORD-iRPE (n = 6). Scale bar: 10 µm. c Apical/basal ratio of PEDF secretion in L-ORD-iRPE (n = 11) as compared to healthy-iRPE (n = 12), measured by ELISA. d Phospholipase A2 activity in L-ORD-iRPE (n = 6) and healthy-iRPE (n = 5), measured by ELISA. e Phospholipase A2 activity of healthy-iRPE under basal and serum-starved (24 h) cell culture conditions (n = 6). f Seahorse assay results demonstrating oxygen consumption rate (OCR) in healthy (n = 18) and L-ORD-iRPE (n = 18) before and after the addition of mitochondrial respiration inhibitors (oligomycin, FCCP, antimycin A/rotenone). g ATP production measured from the Seahorse experiment in L-ORD-iRPE (21.4 ± 2.2 pmol/min, n = 18) compared to healthy-iRPE (58.7 ± 16.1 pmol/min, n = 18). h Apically secreted Neuroprotectin D1 (NPD1) measured by tandem mass spectrometry lipidomic analysis in POS-fed (4 h) L-ORD-iRPE (n = 12) and healthy-iRPE (n = 12). i Flow cytometry-based analysis of photoreceptor outer segment phagocytosis in L-ORD-iRPE and healthy-iRPE (n = 14). ∗p < 0.05, ∗∗p < 0.01.
Fig. 5
Fig. 5. Metformin counteracts the increased susceptibility to dedifferentiation in L-ORD-iRPE.
a, b Representative immunofluorescent images of the membrane marker ZO-1 (green) in healthy (a) and L-ORD-iRPE (b) following 7 consecutive days of POS uptake. Scale bar 20 µm. c The effect of POS uptake on the expression of dedifferentiation-related genes in L-ORD-iRPE compared to healthy-iRPE. A dashed line indicates a fourfold difference. Housekeeping genes: ACTB and GAPDH. d Concurrent treatment of L-ORD-iRPE with metformin (3 mM) on POS-induced increase in cell size (ZO-1, green) after 7 days of POS uptake. Scale bar 20 µm. e Quantification of cell area after 7 days of POS uptake and metformin (3 mM) treatment in L-ORD-iRPE. Cells were labeled with anti-ZO-1 antibody and area was quantified using an AI-based algorithm, low whisker: 5% of data, low hinge: 25% of data, midline: median, high hinge: 75% of data, high whisker: 95% of data. (n = 6 images). f Expression of 31 dedifferentiation-related genes in metformin-treated (magenta) L-ORD-iRPE (fed POS for 7 days) compared to untreated cells. A dashed line indicates a fourfold difference. Housekeeping genes: ACTB and GAPDH. g Apically secreted beta-hydroxybutyrate (β-HB) in L-ORD-iRPE after 1 week of metformin treatment. Cells were supplied with a β-HB metabolic substrate, BSA-palmitate conjugate, for 3 h before measuring β-HB levels (n = 12). h Secreted NPD1 in untreated (n = 8) and metformin-treated L-ORD-iRPE (n = 9) measured by tandem mass spectrometry lipidomic analysis. Cells were POS-fed for 24 h prior to media collection. ∗p < 0.05, **p < 0.01, ∗∗∗p < 0.001.
Fig. 6
Fig. 6. Metformin ameliorates L-ORD cellular phenotypes.
ac Immunofluorescent images of cryosectioned healthy (a) and L-ORD-iRPE [without metformin (b), with metformin (c)] monolayers fed POS for 7 consecutive days and stained for APOE (red), COLLAGEN IV (COLIV, green), nuclei with Hoechst 33342 (blue). Top panels (ac) show 20x magnification images, scale bar: 50 µm. Representative 60x magnification images are shown in bottom panels (ac), scale bar: 10 µm. Apical APOE is indicated with yellow arrows and basal with white arrows (n = 4) d Representative Western blot and quantification of APOE signal in healthy (n = 4) and L-ORD-iRPE without (n = 3) and with metformin treatment (n = 3). e Quantification of APOE signal from images shown in panels ac. (n = 4 for healthy-iRPE; n = 5 for L-ORD-iRPE; n = 4 for L-ORD-iRPE with metformin). f ELISA-based measurements of apical and basal VEGF secretion in metformin-treated healthy and L-ORD-iRPE (n = 10; Ap: 2.07 ± 0.4; Ba: 4.8 ± 1). g pAMPK levels in response to AICAR (2 mM) in L-ORD-iRPE (n = 6) treated with metformin, measured by ELISA.

References

    1. Soumplis V, et al. Phenotypic findings in C1QTNF5 retinopathy (late-onset retinal degeneration) Acta Ophthalmol. 2013;91:e191–e195. - PubMed
    1. Bharti K, Miller SS, Arnheiter H. The new paradigm: retinal pigment epithelium cells generated from embryonic or induced pluripotent stem cells. Pigment Cell Melanoma Res. 2011;24:21–34. - PMC - PubMed
    1. Borooah S, Collins C, Wright A, Dhillon B. Republished review. [corrected] Late-onset retinal macular degeneration: clinical insights into an inherited retinal degeneration. Postgrad. Med. J. 2009;85:495–500. - PubMed
    1. Ramtohul P, Gascon P, Matonti F. Choroidal neovascularization in late-onset retinal macular degeneration. Ophthalmol. Retin. 2019;3:153. - PubMed
    1. Kuntz CA, et al. Sub-retinal pigment epithelial deposits in a dominant late-onset retinal degeneration. Invest. Ophthalmol. Vis. Sci. 1996;37:1772–1782. - PubMed

Publication types

Substances

Supplementary concepts