. 2021 Dec;23(12):1240-1254.
doi: 10.1038/s41556-021-00805-8. Epub 2021 Dec 9.

Supermeres are functional extracellular nanoparticles replete with disease biomarkers and therapeutic targets

Affiliations

Supermeres are functional extracellular nanoparticles replete with disease biomarkers and therapeutic targets

Qin Zhang et al. Nat Cell Biol. 2021 Dec.

Abstract

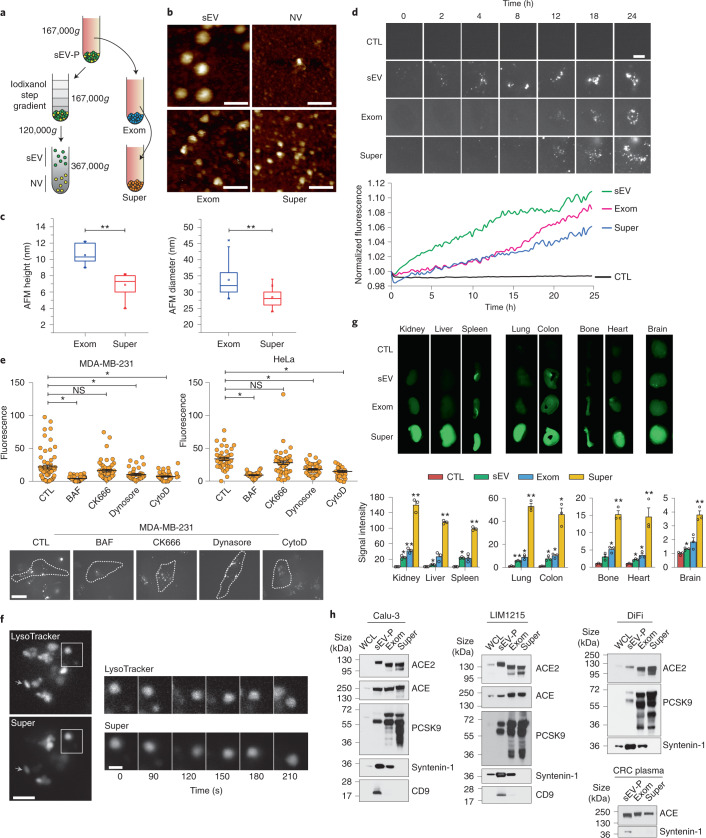
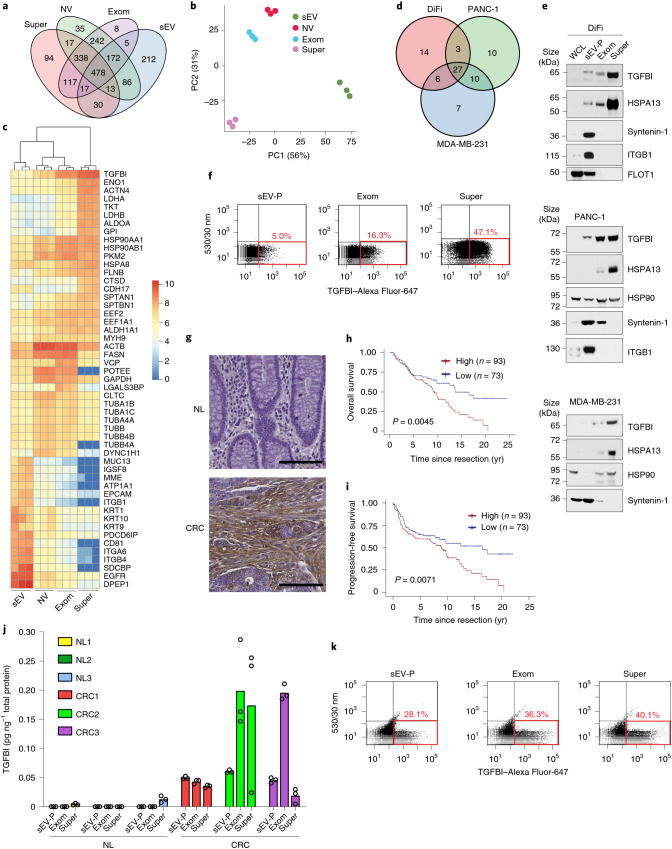
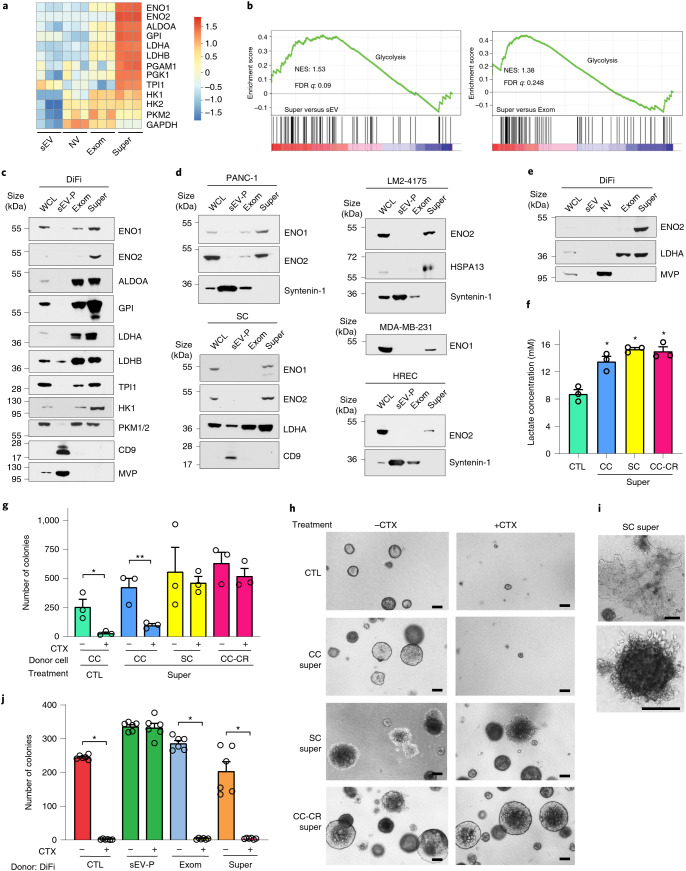
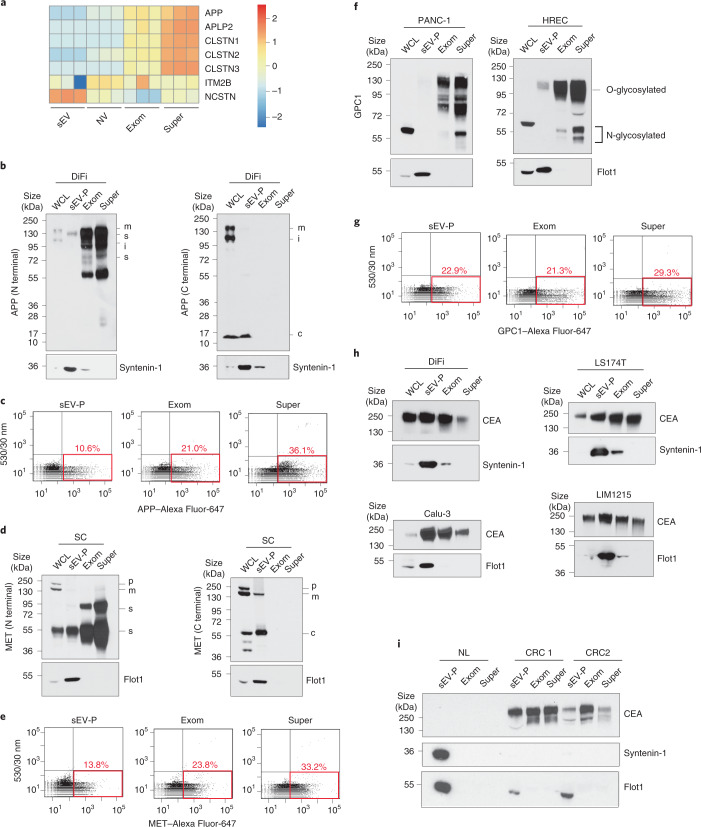
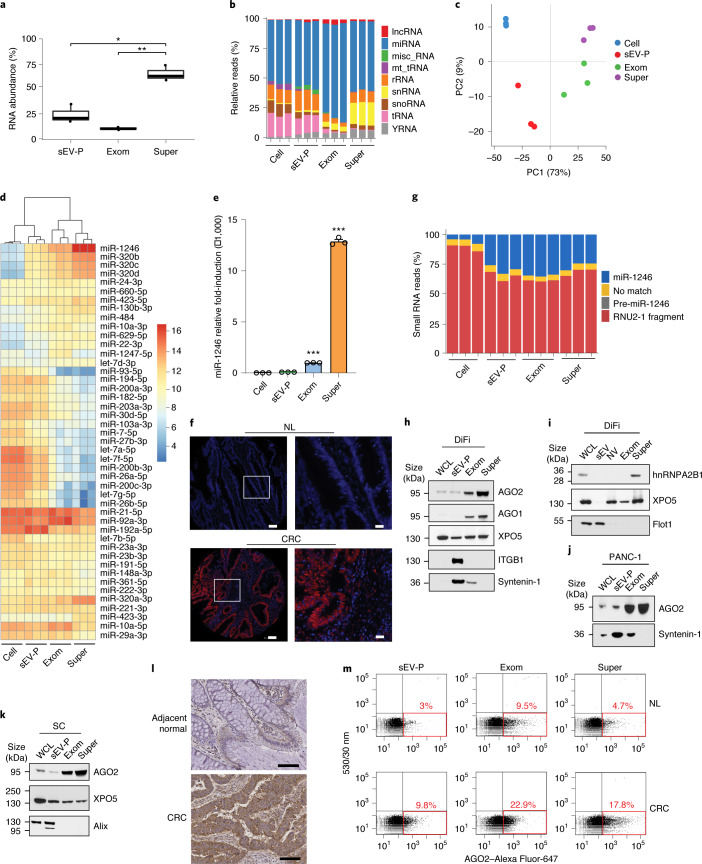
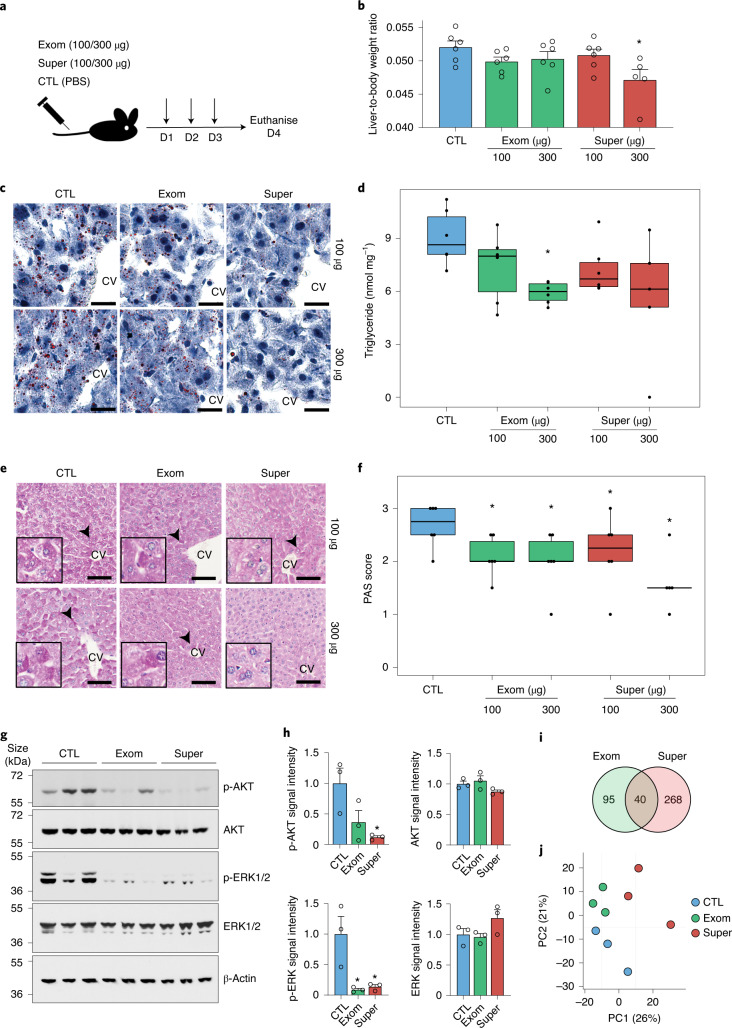
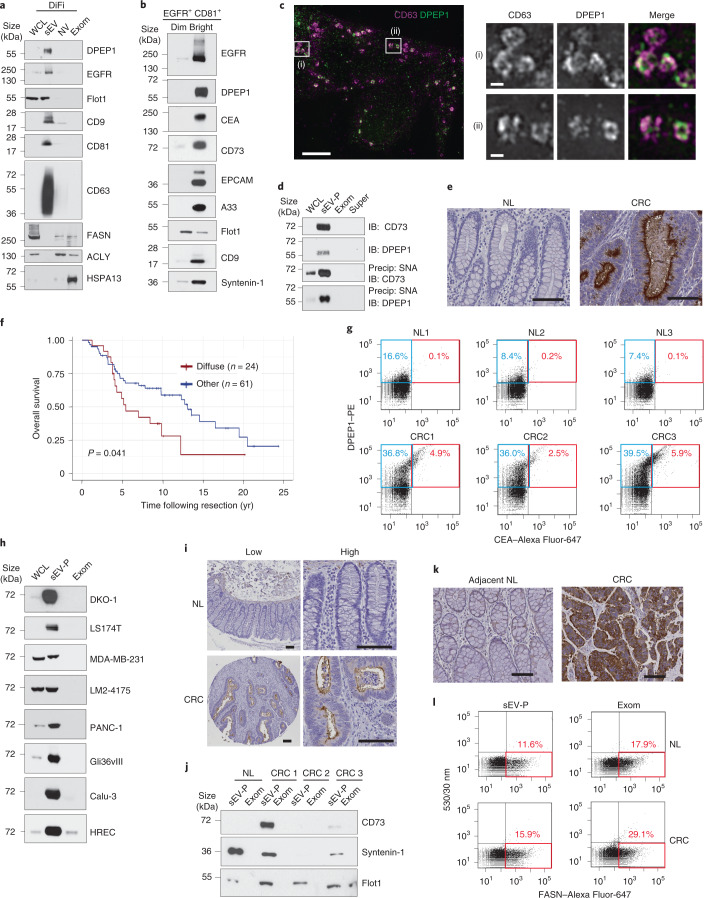
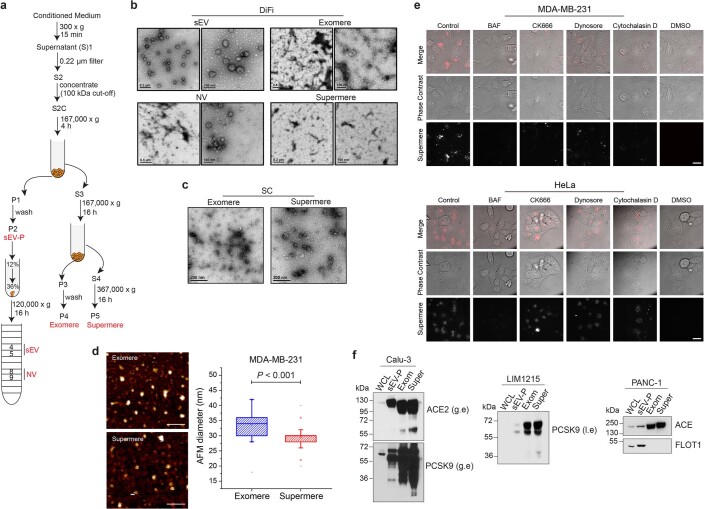
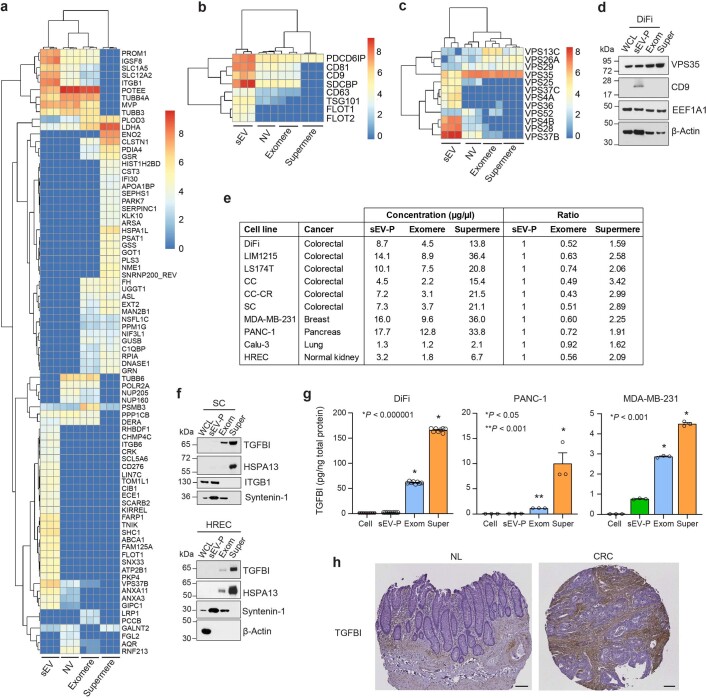
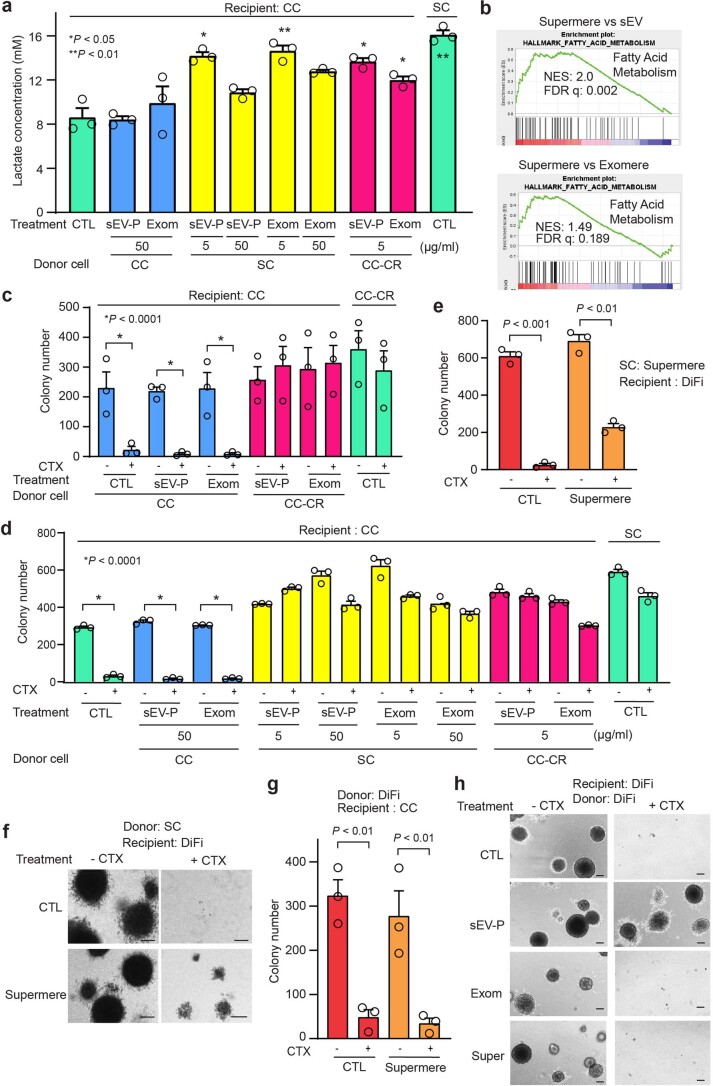
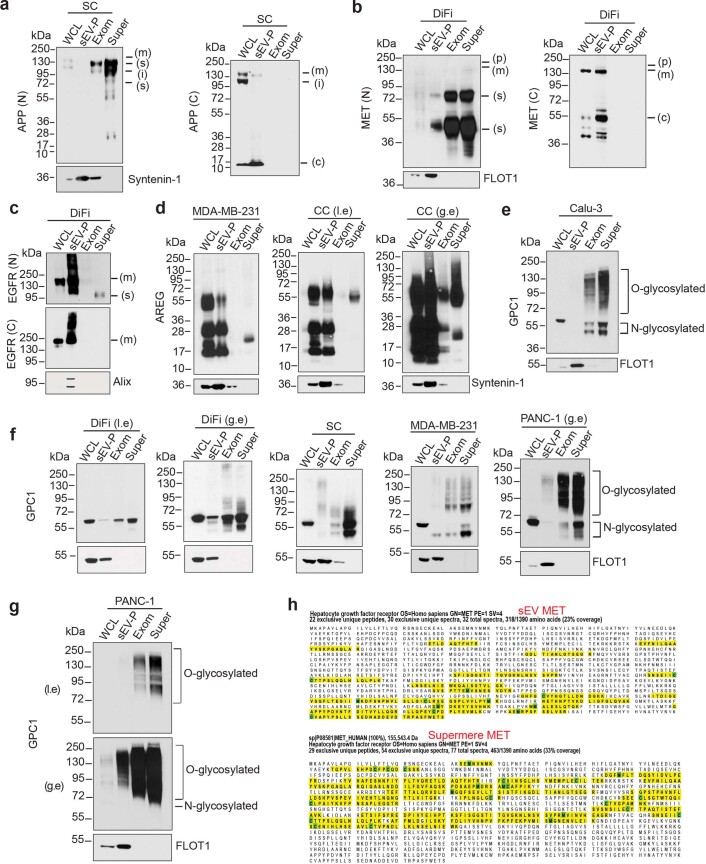
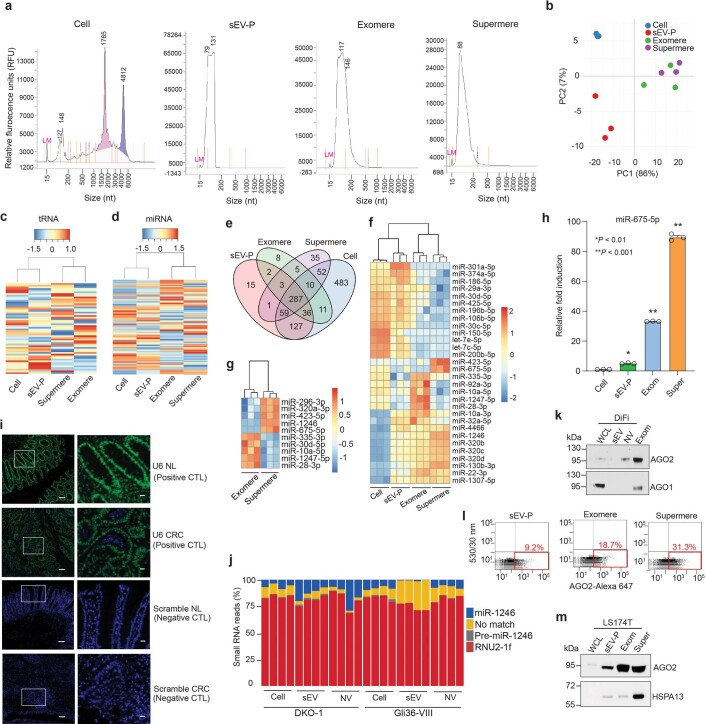
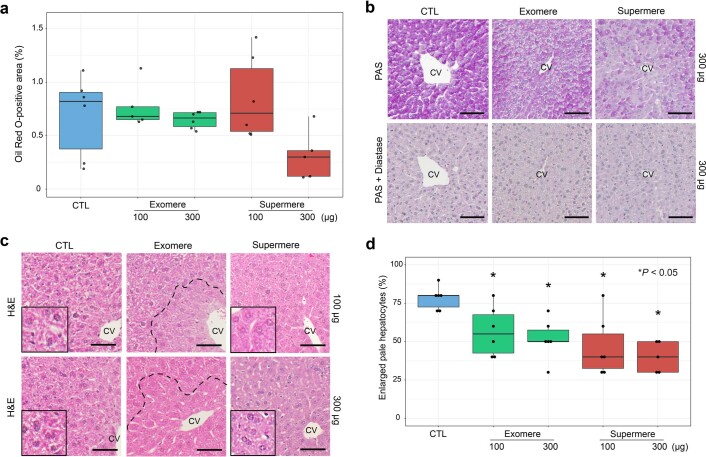
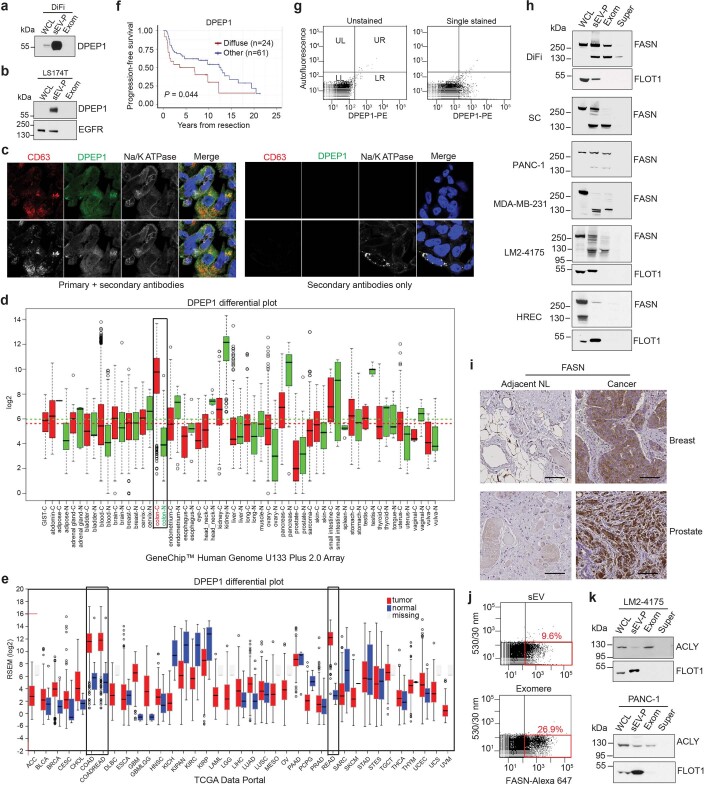
Extracellular vesicles and exomere nanoparticles are under intense investigation as sources of clinically relevant cargo. Here we report the discovery of a distinct extracellular nanoparticle, termed supermere. Supermeres are morphologically distinct from exomeres and display a markedly greater uptake in vivo compared with small extracellular vesicles and exomeres. The protein and RNA composition of supermeres differs from small extracellular vesicles and exomeres. Supermeres are highly enriched with cargo involved in multiple cancers (glycolytic enzymes, TGFBI, miR-1246, MET, GPC1 and AGO2), Alzheimer's disease (APP) and cardiovascular disease (ACE2, ACE and PCSK9). The majority of extracellular RNA is associated with supermeres rather than small extracellular vesicles and exomeres. Cancer-derived supermeres increase lactate secretion, transfer cetuximab resistance and decrease hepatic lipids and glycogen in vivo. This study identifies a distinct functional nanoparticle replete with potential circulating biomarkers and therapeutic targets for a host of human diseases.


Conflict of interest statement

The authors declare no competing interests.

Figures

Fig. 1
Fig. 1. Supermeres display distinct uptake in vitro and in vivo.
a, Simplified schematic illustration of the supermere isolation procedure. b, Representative fluid-phase AFM topographic images of sEVs (top left), NV fractions (top right), exomeres (bottom left) and supermeres (bottom right) derived from DiFi cells. Scale bars, 100 nm. c, Exomere and supermere heights (left) and diameters (right) measured by AFM (mean ± s.e.m). Height, n = 10; and diameter, n = 134, where n is the number of nanoparticles. For the boxplots, the centre lines mark the median, the box limits indicate the 25th and 75th percentiles, and the whiskers extend 1.5× the interquartile range from the 25th and 75th percentiles. d, Imaging of vesicle and particle uptake (top). MDA-MB-231 cells were incubated with PBS (CTL, control), or Alexa Fluor-647-labelled sEVs, exomeres or supermeres, and imaged every 15 min for 24 h using an instant SIM (iSIM) imaging system. Each field of view was averaged and normalized to the starting value (bottom); n = 3 fields of view for each 15 min time point. Data are representative of two independent experiments. Scale bar, 10 µm. e, Inhibition of cellular supermere uptake. Cells were pre-incubated with uptake inhibitors for 30 min before the addition of labelled supermeres. After a 24 h incubation, images were acquired using an iSIM imaging system (bottom). Data are the mean ± s.e.m. of n = 30 (MDA-MB-231) and 27 (HeLa) cells (top). Images are representative of three independent experiments. The dashed white lines represent the region of interest (ROI). Scale bar, 20 µm. BAF, bafilomycin A1; and CytoD, cytochalasin D. f, Supermere co-localization with endo/lysosomal compartments following uptake. MDA-MB-231 cells were incubated with labelled supermeres and stained with LysoTracker. Images were acquired using an iSIM imaging system. Data are representative of two independent experiments. A time montage of the regions in the white boxes on the left is shown (right). Scale bar, 5 µm (left) and 2 µm (right). g, Whole-organ imaging (top). Male C57BL/6 mice were intraperitoneally injected with labelled sEVs, exomeres or supermeres derived from DiFi cells. Their organs were harvested and analysed after 24 h. Data are the mean ± s.e.m. of n = 3 animals (bottom). h, Immunoblots of select proteins in the sEV-P, exomeres and supermeres derived from cell lines and a plasma sample from a patient with CRC. WCL, whole-cell lysate; exom, exomere; and super, supermere. Statistical significance was determined using a two-tailed Student’s t-test (c,g) or one-way analysis of variance (ANOVA) with Holm–Bonferroni correction (e); NS, not significant; *P < 0.01 and **P< 0.001. Source data
Fig. 2
Fig. 2. Supermeres exhibit a distinct proteome with high levels of TGFBI.
a, Venn diagram of unique and common proteins identified in DiFi-derived sEVs, NV fractions, exomeres and supermeres. b, Principal component (PC) analysis of normalized DiFi proteomic mass spectral counts. c, Heatmap of the top-20 most abundant proteins in each of the samples from DiFi cells. d, Venn diagram of unique and common top-50 most abundant proteins identified in supermeres derived from DiFi, PANC-1 and MDA-MB-231 cells. e, Immunoblot of representative proteins in DiFi- (top), PANC-1- (middle) and MDA-MB-231-derived (bottom) supermeres. Equal quantities (30 µg) of protein from each fraction were analysed. f, FAVS analysis of the TGFBI levels in the sEV-P (left), exomeres (middle) and supermeres (right) derived from DiFi cells. g, Immunohistochemical staining of TGFBI expression in normal (NL) colon and CRC tissue samples. Data are representative of three independent experiments. Scale bars, 100 µm. h,i, Overall (h) and progression-free (i) survival analysis of patients with CRC with different levels of TGFBI (that is, high versus low) using the Kaplan–Meier method; data were compared between the two marker groups using a two-sided log-rank test. j, ELISA analysis of the TGFBI levels in supermeres derived from plasma from control individuals (NL1–3) and patients with CRC. Data are the mean of n = 3 technical replicates. k, FAVS analysis of the TGFBI levels in sEV-Ps, exomeres and supermeres derived from the plasma of patients with CRC. f,k, The red boxes indicate TGFBI-positive particles. The percentages indicate the percent of particles that contain TGFBI above the detection limit. WCL, whole-cell lysate; exom, exomere; and super, supermere. Source data
Fig. 3
Fig. 3. Supermeres increase lactate release and transfer cetuximab resistance.
a, Heatmap of normalized spectral counts for select proteins and enzymes involved in glycolysis in sEVs, NV fractions, exomeres and supermeres from DiFi cells. b, GSEA analysis of pathways enriched in metabolic enzymes for supermeres versus sEVs (left) and supermeres versus exomeres (right) from DiFi cells. NES, normalized enrichment score; and FDR, false discovery rate. c,d, Immunoblot analysis of select metabolic enzymes and proteins involved in glycolysis in cells and extracellular samples derived from DiFi (c) as well as PANC-1, SC, LM2-4175, MDAM-MB-231 and HREC (d) cells. e, Immunoblot analysis of ENO2 and LDHA in DiFi whole-cell lysate as well as high-resolution density gradient-fractionated sEVs, NV fractions, and exomeres and supermeres. ce, Equal quantities (30 µg) of protein from each fraction were analysed. f, Lactate release of CC cells treated with PBS (control) or 50 µg ml−1 supermeres derived from CC, SC or CC-CR cells as the mean ± s.e.m. of n = 3 independent treatments. g, Growth analysis of CC colonies in 3D collagen and treated with 50 µg ml−1 supermere derived from CC, SC or CC-CR cells in the presence or absence of cetuximab for 14 d. Colony counts plotted as the mean ± s.e.m. of n = 3 independent samples. h, Representative images of CC colonies from g. i, Representative low (top) and high (bottom) magnification images of CC colonies treated with SC supermeres. h,i, Scale bars, 200 µm. j, Growth analysis of DiFi colonies in 3D collagen and treated with 50 µg ml−1 sEV-Ps, exomeres and supermeres derived from DiFi cells in the presence or absence of cetuximab for 14 d. Colony counts plotted as the mean ± s.e.m. of n = 6 independent experiments. f,g,j, *P < 0.01, **P < 0.001; two-tailed Student’s t-test. Exom, exomere; super, supermere; WCL, whole-cell lysate; CTL, control; and CTX, cetuximab. Source data
Fig. 4
Fig. 4. Supermeres are enriched in shed membrane proteins.
a, Heatmap of normalized spectral counts of APP and other select membrane proteins involved in Alzheimer’s disease. b, Immunoblot analysis of APP in the whole-cell lysate, sEV-P as well as exomeres and supermeres of DiFi cells using N-terminal (left) and C-terminal (right) APP antibodies. c, C-terminal APP fragment; i, immature APP; m, mature APP; and s, soluble APP. c, FAVS analysis of APP in the sEV-P (left), exomeres (middle) and supermeres (right) of DiFi cells. d, Immunoblot analysis of MET in SC cells and corresponding extracellular samples using both N-terminal (left) and C-terminal (right) MET antibodies. c, C-terminal MET fragment; p, pro-form MET; m, mature MET; s, soluble MET. e, FAVS analysis of MET in the DiFi sEV-P, exomeres and supermeres using MET antibody directly conjugated to Alexa Fluor-647. f, Immunoblot analysis of GPC1 in the whole-cell lysate, sEV-P, exomeres and supermeres derived from PANC-1 (left) and HREC (right) cells using a rabbit monoclonal antibody. g, FAVS analysis of GPC1 in the sEV-P (left), exomeres (middle) and supermeres (right) of DiFi cells. h, Immunoblot analysis of CEA in whole-cell lysates, sEV-Ps, exomeres and supermeres derived from DiFi (top left), LS174T (top right), LIM1215 (bottom right) and Calu-3 (bottom left) cells. i, Immunoblot analysis of CEA in the sEV-Ps, exomeres and supermeres isolated from control individuals (NL) and plasma from patients with CRC. c,e,g, The red boxes indicate APP-, GPC-1- or MET-positive particles, respectively. The percentages indicate the percent of particles that contain APP, GPC-1 or MET, respectively, above the detection limit. b,d,f,h,i, Equal quantities (30 µg) of protein from each fraction were analysed. Exom, exomere; super, supermere; WCL, whole-cell lysate. Source data
Fig. 5
Fig. 5. Distinct expression of small exRNAs in supermeres.
a, Relative RNA abundance in the sEV-P, exomeres and supermeres of DiFi cells. Two-tailed Student’s t-test. For the boxplots, the centre lines mark the median, the box limits indicate the 25th and 75th percentiles, and the whiskers extend 1.5× the interquartile range from the 25th and 75th percentiles; n = 3 independent samples. b, Percentage of small-RNA reads mapped small noncoding RNA for DiFi cells, the sEV-P, exomeres and supermeres following RNA-seq. misc_RNA, miscellaneous RNA; mt_tRNA; mitochondrial tRNA; rRNA, ribosomal RNA; snoRNA, small nucleolar RNA; n = 3 independent samples. c, Principal component (PC) analysis of normalized miRNA reads for DiFi cells, the sEV-P, exomeres and supermeres following RNA-seq; n = 3 independent samples. d, Heatmap of the top-25 most abundant miRNAs across DiFi cells and extracellular compartments. e, Expression levels of miR-1246, determined by quantitative PCR with reverse transcription analysis, in DiFi cells and extracellular compartments. Data are the mean ± s.e.m. of n = 3 independent samples. Two-tailed Student’s t-test. f, Fluorescence in situ hybridization staining of miR-1246 in normal human colonic tissue (NL; top) and CRC (bottom) from a TMA. Representative data from three independent experiments are shown. Scale bar, 100 µm (left) and 20 µm (right; magnified view of the region in the white box). g, Percentage of normalized DiFi small-RNA reads containing the miR-1246 sequence. hk, Immunoblots of representative RNA-binding proteins identified in extracellular compartments derived from DiFi (h,i), PANC-1 (j) and SC cells (k). Equal quantities (30 µg) of protein from each fraction were analysed. l, Immunohistochemical staining of AGO2 expression in adjacent normal colon and CRC samples. Representative images are shown. Scale bars, 100 µm. m, FAVS analysis of the AGO2 levels in the plasma of control individuals (NL) and patients with CRC. The red boxes indicate AGO2-positive particles. The percentages indicate the percent of particles that contain AGO2 above the detection limit. Representative results are shown. n = 3 independent experiments. Exom, exomere; super, supermere; WCL, whole-cell lysate. *P< 0.05, **P< 0.01 and ***P < 0.001. Source data
Fig. 6
Fig. 6. Supermeres affect the in vivo levels of liver lipids and glycogen.
a, Schematic of the mouse treatment experiments. D, day. b, Liver-to-body weight ratio of mice following PBS, exomere or supermere treatments. Two-sided Kruskal–Wallis test, followed by Dunn’s post-hoc test. Data are the mean ± s.e.m. of n = 6 animals. c, Oil red O staining of mouse livers following three consecutive injections with PBS (left) or exomeres (middle) and supermeres (right) derived from DiFi cells. The livers were harvested 24 h after the last injection. Scale bars, 20 µm. d, Level of triglycerides in liver tissue following injection with exomeres or supermeres derived from DiFi cells. e, Periodic acid–Schiff staining of formalin-fixed paraffin-embedded (FFPE) liver tissue following injection with exomeres or supermeres derived from DiFi cells. There were significant differences between experimental groups by pathology scoring of hepatocytes containing darker magenta deposits of polysaccharides (arrowheads; P = 0.038, two-sided Kruskal–Wallis test). Representative images are shown. Inset: magnified view with a diameter of approximately 90 µm. Scale bars, 100 µm. f, Histological scoring of liver sections stained with periodic acid–Schiff (PAS). The sections were scored double-blinded (0–3) for intensity and homogeneity by two liver pathologists. The liver sections from the mice injected with 300 µg of supermeres showed decreased scores in comparison to the other treatment groups. d,f, Two-sided Wilcoxon rank-sum test; n = 6 animals. For the boxplots, the centre lines mark the median, the box limits indicate the 25th and 75th percentiles, and the whiskers extend 1.5× the interquartile range from the 25th and 75th percentiles. g, Immunoblot of select proteins in mouse liver lysates after treatment with PBS (control) or 300 µg of exomeres or supermeres. h, Levels of proteins detected by immunoblot. Data are the mean ± s.e.m. of n = 3 animals. One-way ANOVA, followed by Holm–Bonferroni correction. i, Venn diagram of unique and common genes that are differentially expressed compared with the control (PBS) group between exomere- and supermere-treated mice. The criteria for inclusion of a differentially expressed gene were fold change > 1.5 and FDR < 1.0. j, Principal component (PC) analysis of gene expression in the mouse liver cells following treatment. Exom, exomere; super, supermere; CV, centrilobular vein; and CTL, control. *P < 0.05. Source data
Fig. 7
Fig. 7. DPEP1 and CD73 are potential CRC biomarkers in exosomes.
a, Immunoblot of representative proteins identified in the whole-cell lysates, sEVs, NV fractions and exomeres of DiFi cells. b, Immunoblot of representative proteins identified in sEVs sorted by FAVS based on the expression of EGFR and CD81. The same number of sorted vesicles (1.5 × 106) were analysed for each sample. c, Localization of endogenous CD63 and DPEP1 in DiFi cells imaged using 3D structured illumination microscopy (SIM). 1.8 µm z-stack projection (left). Magnified views of the regions in the white squares are shown (right). Data are representative of two independent experiments. Scale bars, 5 µm (left) and 500 nm (right). d, Level of α2,6-sialylated DPEP1 and CD73 detected in the whole-cell lysates, sEV-Ps, exomeres and supermeres of DiFi cells. IB, immunoblot; precip, precipitation. e, Immunohistochemical staining of DPEP1 expression in normal colon (NL) and CRC tissue samples. Data are representative of three independent experiments. Scale bar, 100 µm. f, Overall survival analysis of patients with CRC comparing their DPEP1-staining patterns (diffuse versus others) using the Kaplan–Meier method; data were compared between marker groups using a two-sided log-rank test. g, FAVS analysis of the levels of DPEP1 and CEA in the sEV-Ps from the plasma of control individuals and patients with CRC using anti-DPEP1 directly conjugated to phycoerythrin (PE). The blue boxes indicate DPEP1+ sEVs and the red boxes indicate DPEP1+CEA+ double-positive sEVs. h, Immunoblot analysis of CD73 expression in cells (whole-cell lysates), sEV-Ps and exomeres from different cell lines. i, Immunohistochemical staining of CD73 expression in normal colon and CRC tissue samples. Low (left) and high (right) magnification images. Data are representative of three independent experiments. Scale bars, 100 µm. j, Immunoblot analysis of CD73 in the sEV-P and exomeres isolated from plasma samples of control individuals and patients with CRC. k, Immunohistochemical staining of FASN expression in adjacent normal colon and CRC tissue samples. Data are representative of three independent experiments. Scale bars, 100 µm. l, FAVS analysis of the FASN levels in the sEV-Ps and exomeres of plasma from normal controls and patients with CRC using anti-FASN directly conjugated to Alexa Fluor-647. a,d,h,j, Equal quantities (30 µg) of protein from each fraction were analysed. The red boxes indicate FASN-positive particles. The percentages indicate the percent of particles that contain FASN above the detection limit. WCL, whole-cell lysate; exom, exomere; and super, supermere. Source data
Extended Data Fig. 1
Extended Data Fig. 1. Supermeres are extracellular particles with distinct uptake in vitro.
a, Schematic of the isolation procedure for the sEV-P, sEVs, NV, exomeres and supermeres. b, Negative stain transmission electron microscopy of DiFi-derived sEVs, NV, exomeres and supermeres. c, Negative stain transmission electron microscopy of SC-derived exomeres and supermeres. d, Representative fluid-phase AFM topographic images of exomeres and supermeres derived from MDA-MB-231 cells. Scale bar, 100 nm (left). Box plots of exomere and supermere diameters measured by AFM. n = 108 particles, **P < 0.001 (two-tailed t-test). For boxplots the centre lines mark the median; box limits indicate 25th and 75th percentiles; whiskers extend 1.5 times the interquartile range from 25th and 75th percentiles (right). e, Inhibition of cellular supermere uptake. MDA-MB-231 or HeLa cells were pre-incubated with indicated uptake inhibitors for 30 min before addition of Alexa Fluor-647-labelled supermeres. After 24 h incubation, bright-field and fluorescence images were acquired with iSIM. Scale bar, 20 µm. f, Immunoblot of selected proteins in Calu-3-, LIM1215-, and PANC-1-derived sEV-Ps, exomeres (exom) and supermeres (super). Thirty micrograms of protein from each fraction were analysed. WCL, whole-cell lysate. l.e, lower exposure; g.e, greater exposure. Source data
Extended Data Fig. 2
Extended Data Fig. 2. Supermeres exhibit distinct proteomic profiles.
a, Heatmap of top-25 differentially expressed proteins in sEVs, NV, exomeres and supermeres from DiFi cells, based on normalized spectral counts. b,c, Heatmap of the relative abundance of select conventional sEV markers (b) and vacuolar protein sorting proteins (VPS) in sEVs, NV, exomeres and supermeres from DiFi cells (c). d, Immunoblot analysis of VPS35 in DiFi cells (WCL), the sEV-P, exomeres (exom) and supermeres (super). e, Protein concentrations and ratios of the sEV-P, exomeres and supermeres produced from cell lines in equal volumes. Note that the size of the sample preparations (number of cell culture plates) is not equal between different cell lines. f, Immunoblot analysis of SC and HREC cells (WCL), the sEV-P, exomeres and supermeres. g, ELISA analysis of TGFBI levels in DiFi, PANC-1 and MDA-MB-231 cells, the sEV-P, exomeres and supermere. Data are mean ± s.e.m. n = 8 for DiFi, and n = 3 for PANC-1 and MDA-MB-231. h, Immunohistochemical staining of TGFBI expression in normal colon (NL) and colorectal cancer (CRC) tissue samples. Representative images are shown. Scale bar, 100 µm. Source data
Extended Data Fig. 3
Extended Data Fig. 3. Supermeres increase lactate release and transfer drug resistance.
a, Lactate release from CC cells treated with PBS (CTL), or 5 or 50 µg/ml of the sEV-P or exomeres derived from CC, SC or CC-CR cells is plotted. Data are mean ± s.e.m. n = 3 biological replicates. b, GSEA analysis of pathways enriched in metabolic enzymes for supermeres versus sEVs (top) and supermeres versus exomeres (bottom) from DiFi cells c, CC colony growth analysis in 3D collagen treated with 50 µg/ml of CC or CC-CR-derived sEV-P or exomeres in the presence or absence of cetuximab (CTX) for 14 days. Colony counts are plotted (mean ± s.e.m). n = 3 biological replicates. d, CC colony growth analysis in 3D collagen treated with 5 or 50 µg/ml of the sEV-P or exomeres derived from CC, SC, or CC-CR cells in the presence or absence of CTX for 14 days. Colony counts are plotted (mean ± s.e.m). n = 3 biological replicates. e, DiFi colony growth analysis in 3D collagen treated with 25 µg/ml of supermeres derived from SC cells in the presence or absence of CTX for 14 days. Colony counts are plotted (mean ± s.e.m). n = 3 biological replicates. f, Representative images of DiFi colonies from (e). Scale bar, 200 µm. g, CC colony growth analysis in 3D collagen treated with 25 µg/ml of supermeres derived from DiFi cells in the presence or absence of CTX for 14 days. Colony counts are plotted (mean ± s.e.m). n = 3 biological replicates. *P < 0.01 (two-tailed t-test). h, Representative images of DiFi colonies from (Fig. 3j). Scale bar, 200 µm. Source data
Extended Data Fig. 4
Extended Data Fig. 4. Supermeres and exomeres are highly enriched with clinically relevant shed membrane proteins.
a, Immunoblot analysis of APP in SC cells, the sEV-P, exomeres (exom) and supermeres (super) using N-terminal (N, left) and C-terminal (C, right) APP antibodies. (i), immature APP; (m), mature APP; (s), soluble APP. b, Immunoblot analysis of MET in DiFi cells, the sEV-P, exomeres and supermeres, using N-terminal (N, left) and C-terminal (C, right) MET antibodies. (c), C-terminal fragment MET; (p), pro-form MET; (s), soluble MET. c, Immunoblot analysis of EGFR in DiFi cells, the sEV-P, exomeres and supermeres, using N-terminal (N) and C-terminal (C) EGFR antibodies. m, membrane; s, soluble. d, Immunoblot analysis of AREG in MDA-NB-231 cells and the sEV-P, exomeres and supermeres (left), and in CC cells and the sEV-P, exomeres and supermeres with short (left) and long exposure (right), using an N-terminal AREG antibody. g.e, greater exposure; l.e, lower exposure. e, Immunoblot analysis of GPC1 in Calu-3 cells, the sEV-P, exomeres and supermeres using a rabbit monoclonal GPC1 antibody. f, Immunoblot analysis of GPC1 in DiFi, SC, MDA-MB-231 and PANC-1 cells, and the sEV-P, exomere and supermere fractions, using a rabbit monoclonal GPC1 antibody. The PANC-1 immunoblot is a longer exposure of the corresponding membrane in Fig. 4f. g, Immunoblot analysis of GPC1 in PANC-1 cells, and the sEV-P, exomeres and supermeres, using a rabbit polyclonal GPC1 antibody with short (upper) and long exposure (lower) of the immunoblot. h, MET sequence in DiFi-derived sEV and supermere identified by mass spectrometry. Source data
Extended Data Fig. 5
Extended Data Fig. 5. Characterization of small RNAs associated with different fractions.
Bioanalyzer size profile of RNAs isolated from DiFi cells, the sEV-P, exomeres and supermeres. b, Principal component analysis of tRNAs in DiFi cells, the sEV-P, exomeres and supermeres. c, Heatmap of tRNA analysis in DiFi cells, the sEV-P, exomeres and supermeres. d, Heatmap of miRNAs analysis in DiFi cells, the sEV-P, exomeres and supermeres. e, Venn diagram of miRNAs identified in DiFi cells, the sEV-P, exomeres and supermeres. n = 3 biological replicates. f, Heatmap of top 10 differentially expressed miRNAs. Scale bar indicates intensity. DESeq2 was used to detect differential expression among samples. g, Heatmap of top 5 differentially expressed miRNAs in DiFi exomeres and supermeres. Scale bar indicates intensity. h, qRT-PCR analysis of miR-675-5p expression in DiFi cells, the sEV-P, exomeres and supermeres relative to U6. The mean Ct value for miR-675-5p and U6 are displayed in the table. Data are mean ± s.e.m. n = 3 biological replicates. i, Representative FISH staining of positive control of U6 (green) and negative control (CTL) of scrambled miRNA (green) in human normal tissue (NL) and colorectal cancer (CRC) tumours on a tissue microarray with DAPI (blue). Scale bars, 100 µm (left) and 20 µm (right). j, Percentage of normalized small RNA reads containing the miR-1246 sequence in cells, sEVs and NV fraction derived from DKO-1 and Gli36 vIII cells (dataset from Jeppesen et al. 2019, https://www.cell.com/cell/article/S0092-8674(19)30212-0/fulltext). k, Immunoblot analysis of AGO1 and AGO2 expression in DiFi cells, sEVs, NV and exomeres. WCL, whole-cell lysate; sEV, small extracellular vesicle; NV, non-vesicular; exom, exomere. l, FAVS analysis of AGO2 expression in the DiFi sEV-P, exomeres and supermeres. m, Immunoblot analysis of AGO2 expression in LS174T cells, sEVs, NV and exomeres. Source data
Extended Data Fig. 6
Extended Data Fig. 6. Organ biodistribution of supermeres and effects on liver in vivo.
a, Histological scoring of liver sections stained with Red Oil O. Significance assessed by two-sided Wilcoxon rank-sum. n = 5–6 animals. For boxplots, the centre lines mark the median; box limits indicate 25th and 75th percentiles; whiskers extend 1.5 times the interquartile range from 25th and 75th percentiles. CTL, control. b, Periodic acid-Schiff (PAS) staining of formalin-fixed, paraffin-embedded (FFPE) liver tissue with or without glycogen digestion by diastase. CV, centrilobular vein. Scale bar, 100 µm. c, Hematoxylin and eosin (H&E) staining of FFPE liver tissue following injection with exomeres or supermeres derived from DiFi cells. PBS-injected control mice showed larger areas of enlarged hepatocytes with vacuolated cytoplasm, which extended to the edge of the CV. Exomere and supermere-injected mice had a reduction of these large hepatocytes in the centrilobular area as delimited by the hyphenated line, when compared to the PBS control groups (two-sided Kruskal–Wallis, P = 0.01). Enlarged inset diameter, approximately 68 µm. Scale bar, 75 µm. d, Histological scoring of liver H&E sections for the percentage of enlarged hepatocytes. For boxplots, the centre lines mark the median; box limits indicate 25th and 75th percentiles; whiskers extend 1.5 times the interquartile range from 25th and 75th percentiles. n = 5–6 animals. The most significant reduction was between the supermere 300 µg group and the PBS controls. *P < 0.05 (two-sided Wilcoxon rank sum). Source data
Extended Data Fig. 7
Extended Data Fig. 7. DPEP1 in exosomes and FASN in exomeres are potential CRC biomarkers.
a,b, Immunoblot of DPEP1 expression in DiFi (a) and LS174T (b). c, Localization of endogenous CD63 and DPEP1 in DiFi cells imaged with confocal microscopy. Left panels: primary + secondary antibodies. Right panels: secondary antibodies only control. Scale bar, 10 µm. d, DPEP1 expression from microarray platform U133 plus 2.0 (http://gent2.appex.kr/gent2/). Data were presented by box plots, where the centre line shows the median, the bounds of the box show the first and third quantile, whiskers extend to the most extreme values within 1.5 interquartile range (1.5 *IQR), and dots denote outliers reaching past 1.5 interquartile range. n = 3775 for biologically independent colon cancer samples, n = 397 for biologically independent normal colon samples. e, DPEP1 expression from TCGA RNA-seq (http://firebrowse.org/viewGene.html). Data were presented by box plots, where the centre line shows the median, the bounds of the box show the first and third quantile, whiskers extend to the most extreme values within 1.5 interquartile range (1.5*IQR), and dots denote outliers reaching past 1.5 interquartile range. n = 458 for COAD_tumor, n = 41 for COAD_normal, n = 625 for COADREAD_tumor, n = 51 for COADREAD_normal, n = 167 for READ_tumor, and n = 10 for READ_normal biologically independent samples. f, Progression-free survival analysis of CRC patients comparing DPEP1 staining pattern (diffuse versus others) using Kaplan and Meier, using two-sided log-rank test. g, Gating strategy. Greater than 98% of the unstained samples that fell within the lower left (LL) quadrant of a dot-plot were used as negative control (baseline). Samples that fell in the lower right (LR) quadrant were considered as epitope positive, while samples falling in the LL quadrant were below the limit of detection. This gating panel corresponds to Figs. 2f, 2k, Figs. 4c, 4e, 4g, Fig. 5m, Figs. 7g, 7l, Extended Data Fig. 5l. h, Immunoblot analysis of FASN expression. i, Immunohistochemical staining of FASN expression in adjacent normal (NL) and cancer tissue samples of breast and prostate. Scale bar, 100 µm. j, FAVS analysis of FASN level. k, Immunoblot analysis of ACLY. Source data

Comment in

  • Profiling and promise of supermeres.
    Clancy JW, Boomgarden AC, D'Souza-Schorey C. Clancy JW, et al. Nat Cell Biol. 2021 Dec;23(12):1217-1219. doi: 10.1038/s41556-021-00808-5. Nat Cell Biol. 2021. PMID: 34887514 Free PMC article.

Similar articles

Cited by

References

    1. Jeppesen DK, et al. Reassessment of exosome composition. Cell. 2019;177:428–445. - PMC - PubMed
    1. Zhang H, et al. Identification of distinct nanoparticles and subsets of extracellular vesicles by asymmetric flow field-flow fractionation. Nat. Cell Biol. 2018;20:332–343. doi: 10.1038/s41556-018-0040-4. - DOI - PMC - PubMed
    1. Zhang Q, et al. Transfer of functional cargo in exomeres. Cell Rep. 2019;27:940–954. doi: 10.1016/j.celrep.2019.01.009. - DOI - PMC - PubMed
    1. Mathieu M, Martin-Jaular L, Lavieu G, Thery C. Specificities of secretion and uptake of exosomes and other extracellular vesicles for cell-to-cell communication. Nat. Cell Biol. 2019;21:9–17. - PubMed
    1. van Niel G, D’Angelo G, Raposo G. Shedding light on the cell biology of extracellular vesicles. Nat. Rev. Mol. Cell Biol. 2018;19:213–228. - PubMed

Publication types