. 2021 Dec;27(12):2165-2175.
doi: 10.1038/s41591-021-01572-7. Epub 2021 Dec 9.

PPIL4 is essential for brain angiogenesis and implicated in intracranial aneurysms in humans

Affiliations

PPIL4 is essential for brain angiogenesis and implicated in intracranial aneurysms in humans

Tanyeri Barak et al. Nat Med. 2021 Dec.

Abstract

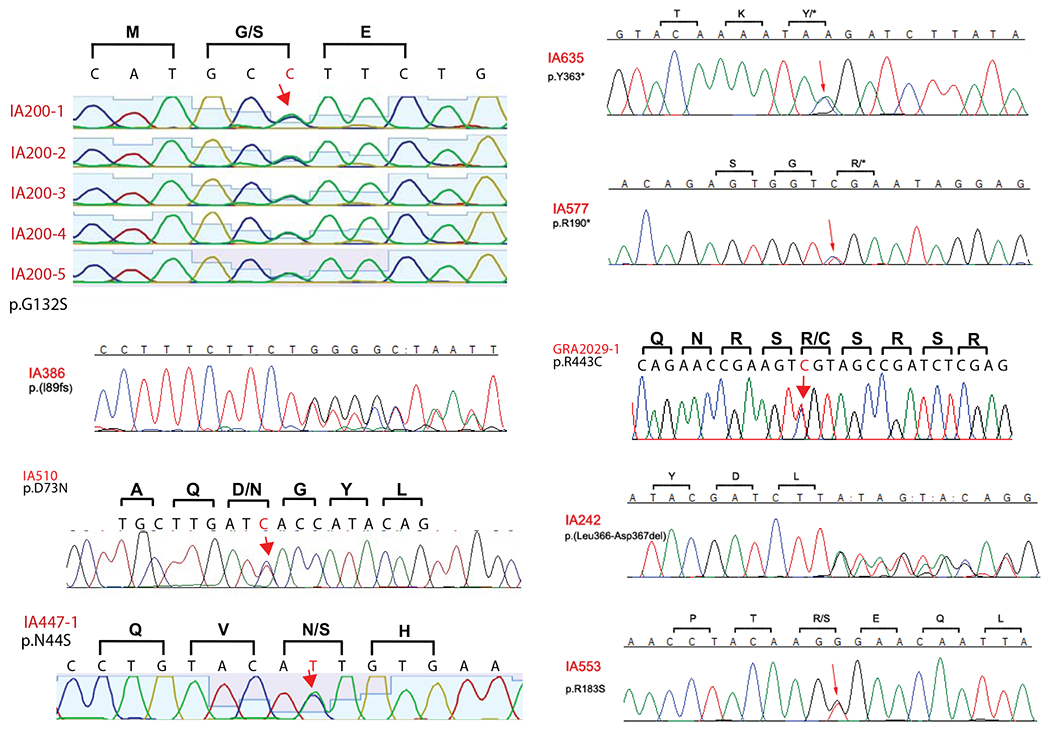
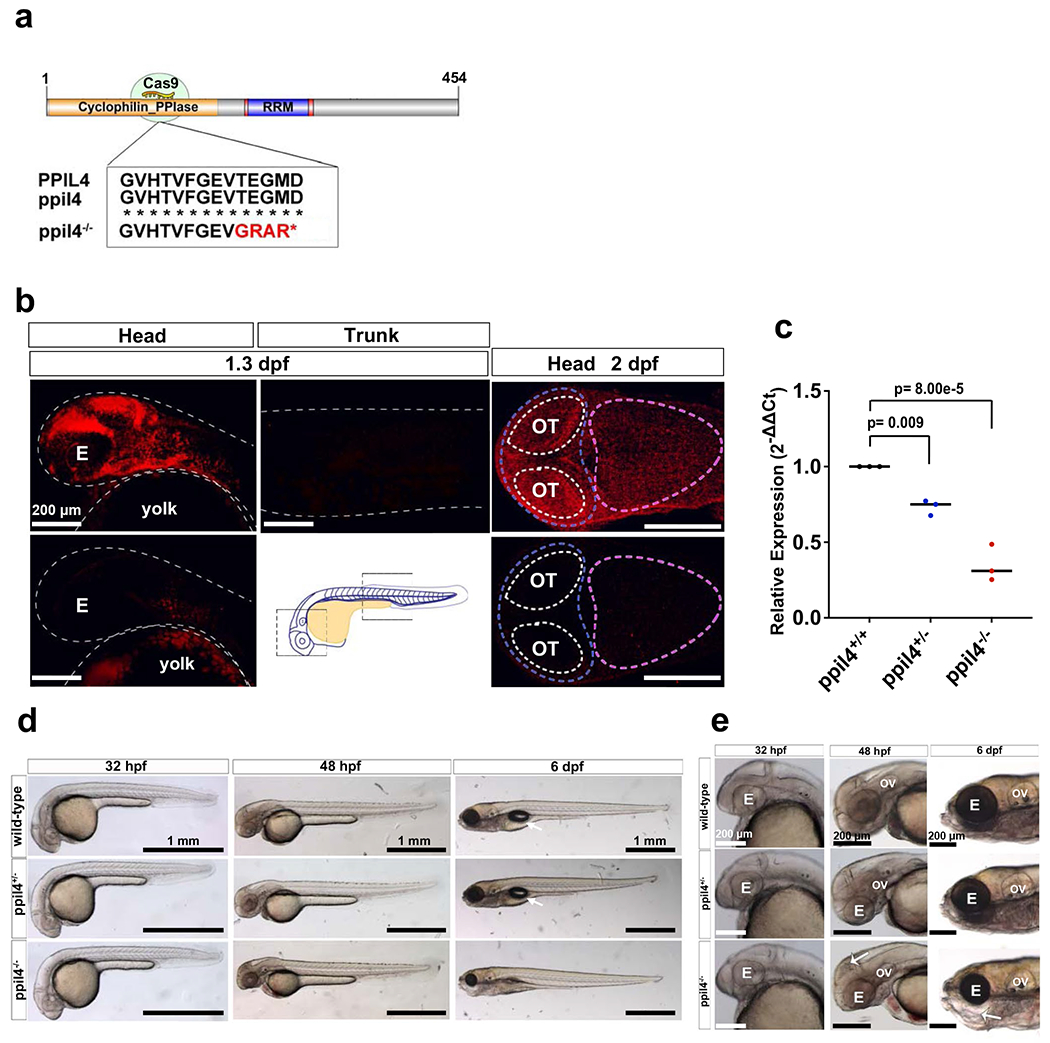
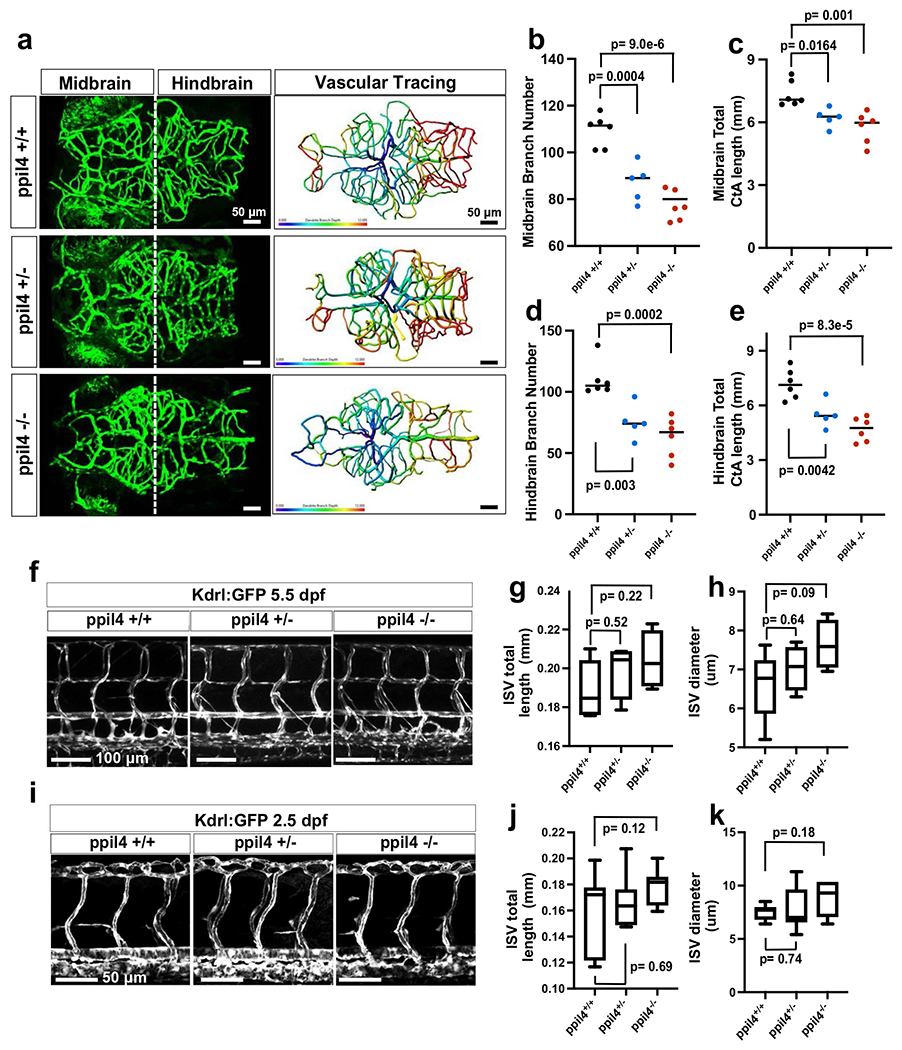
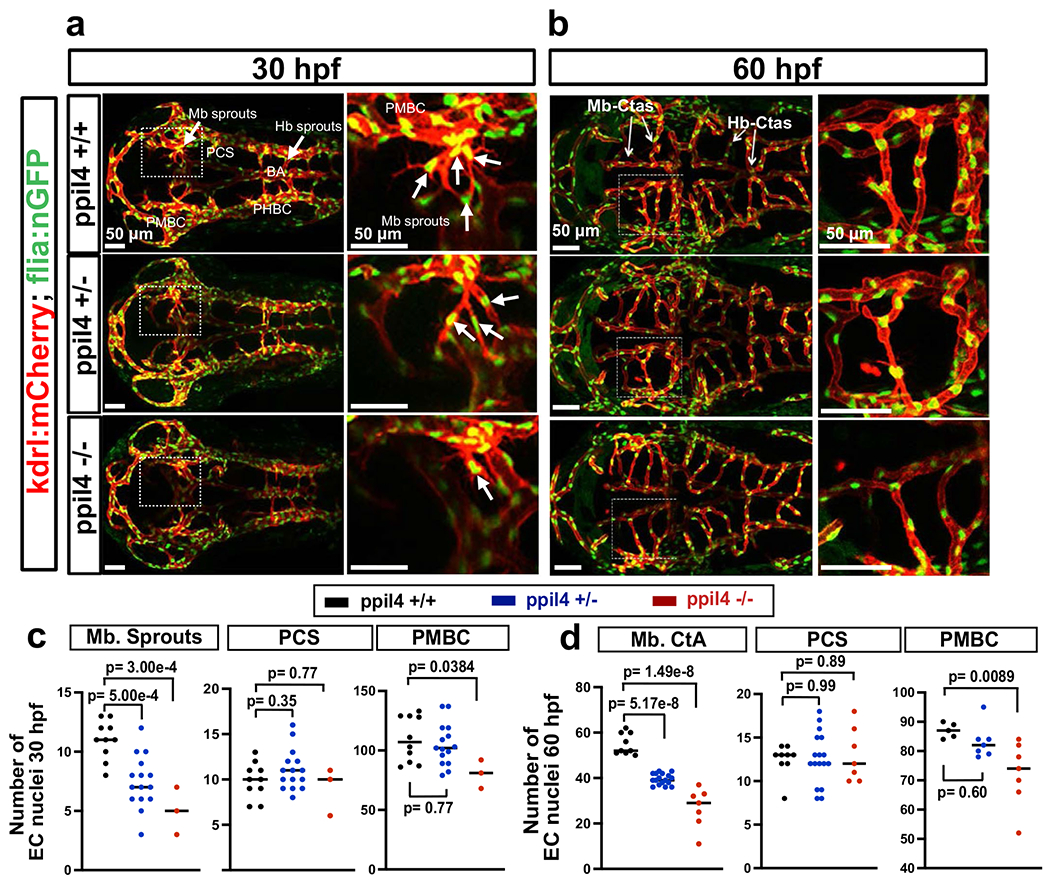
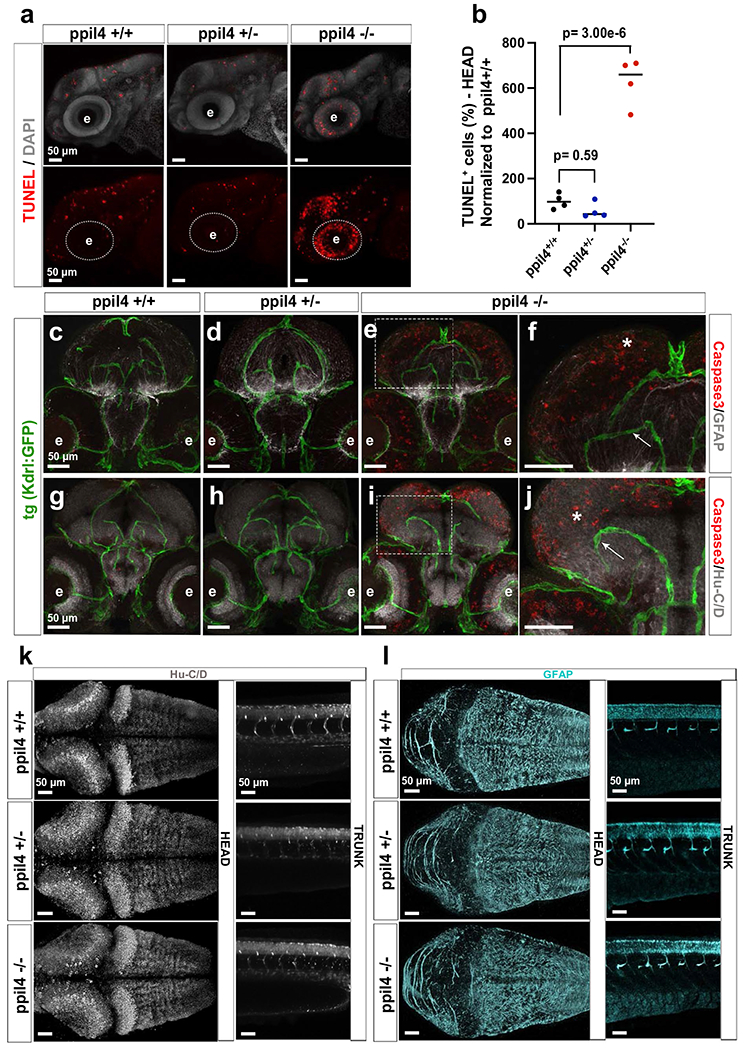
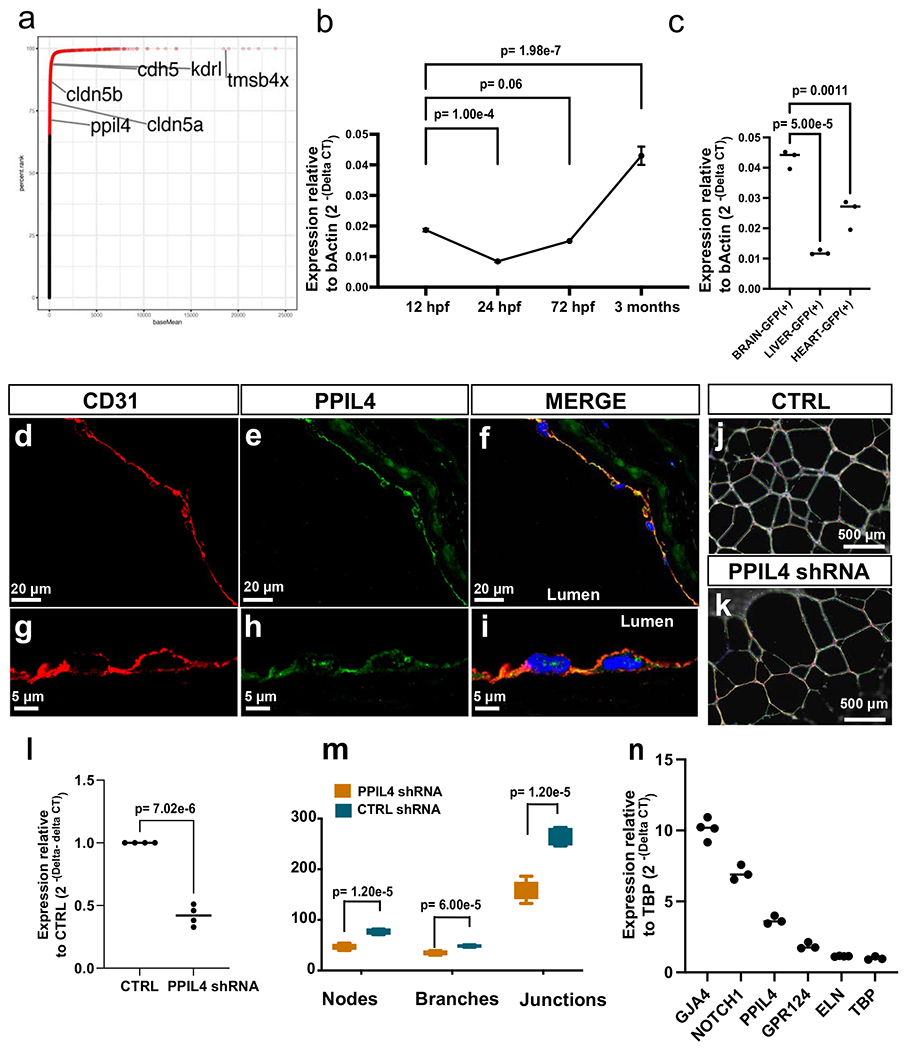
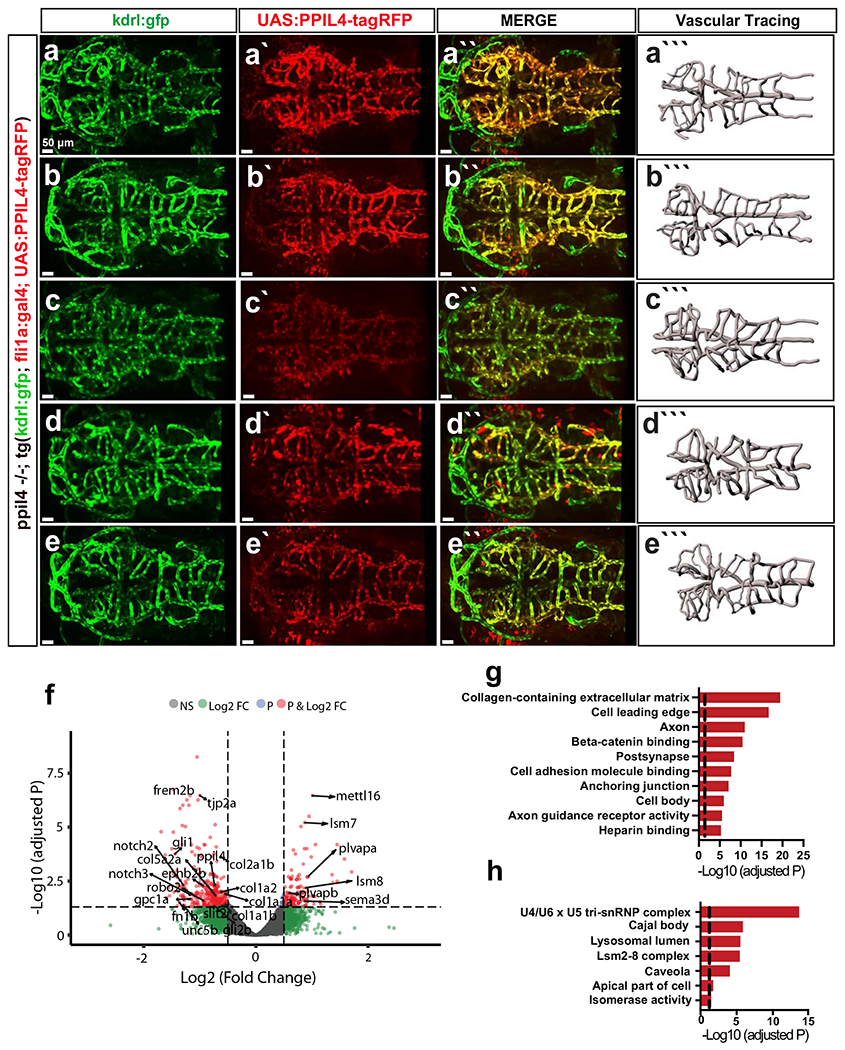
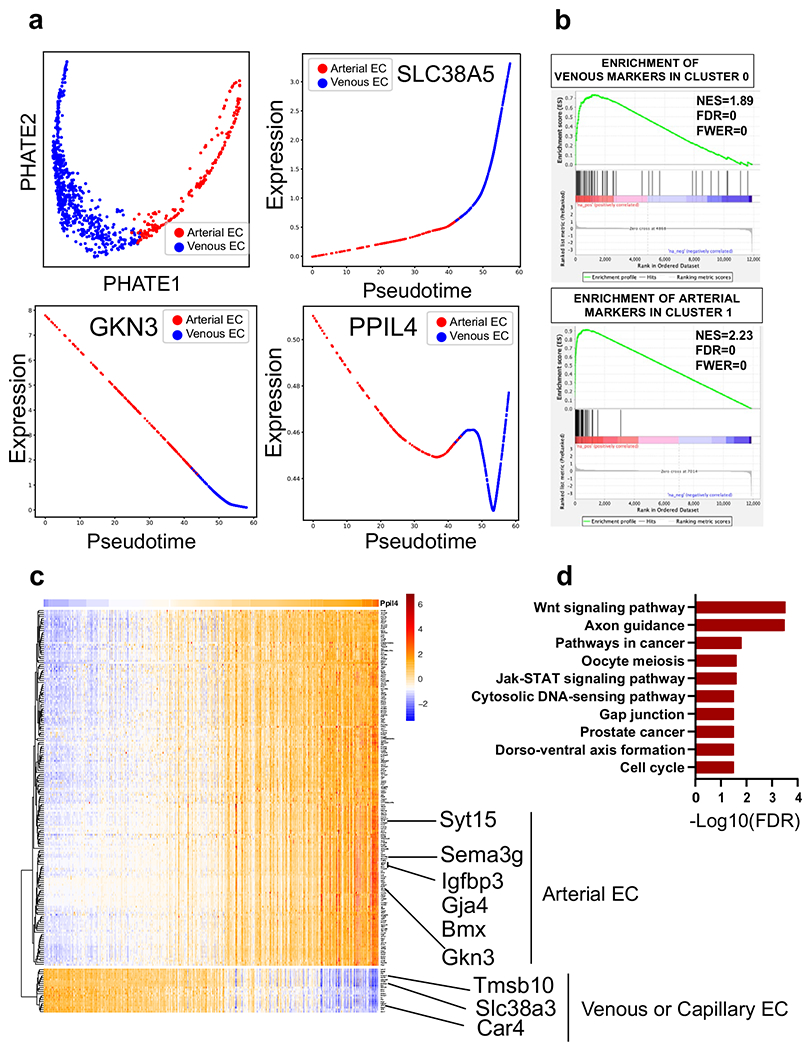
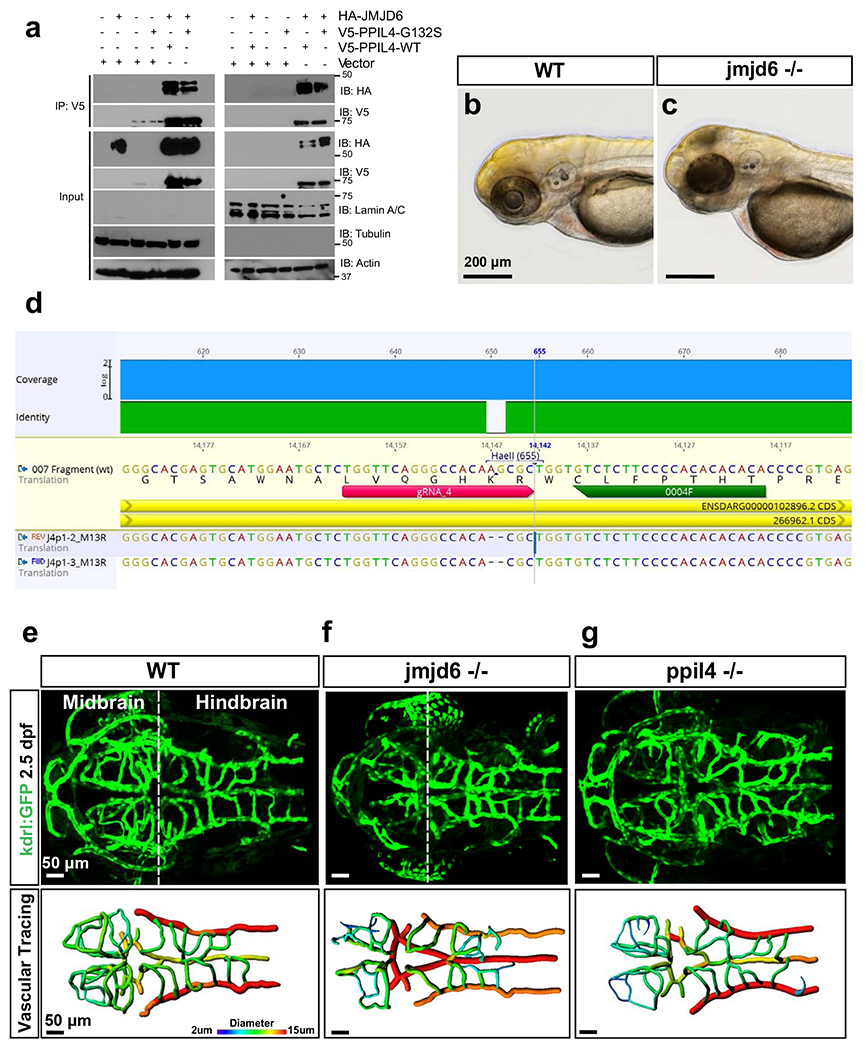
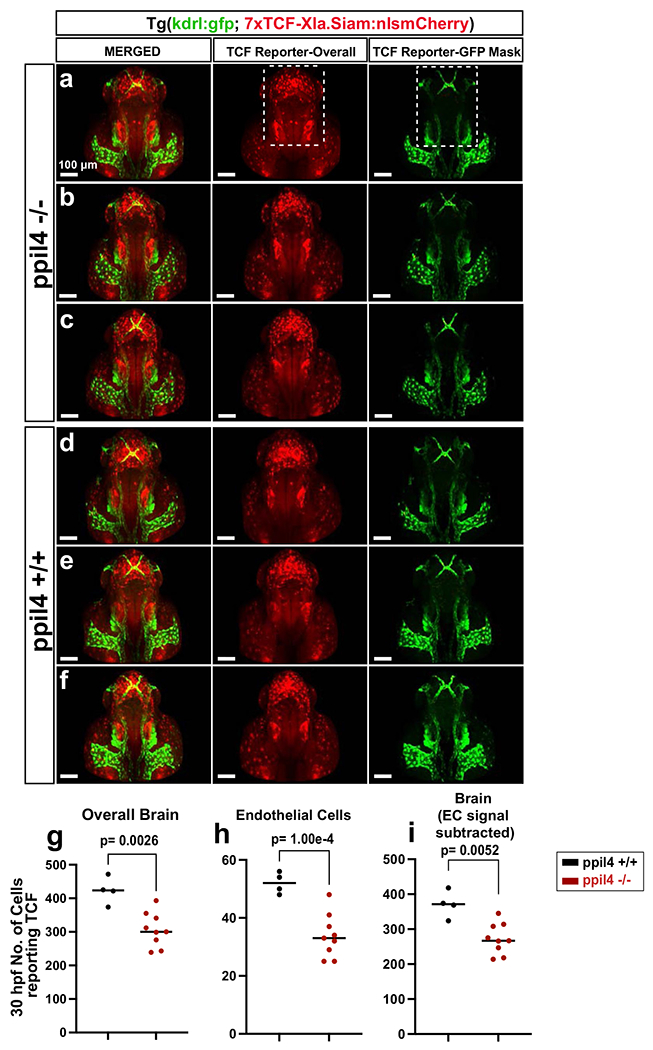
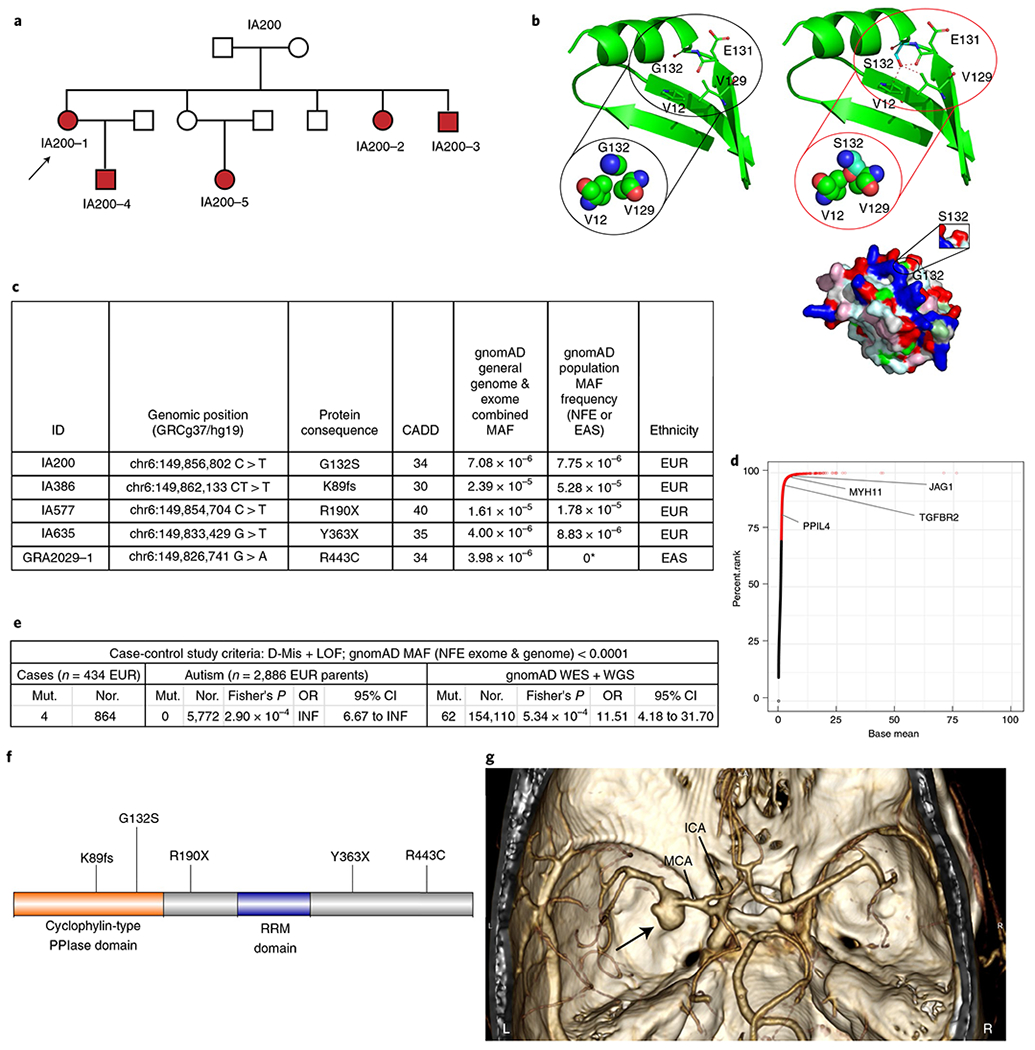
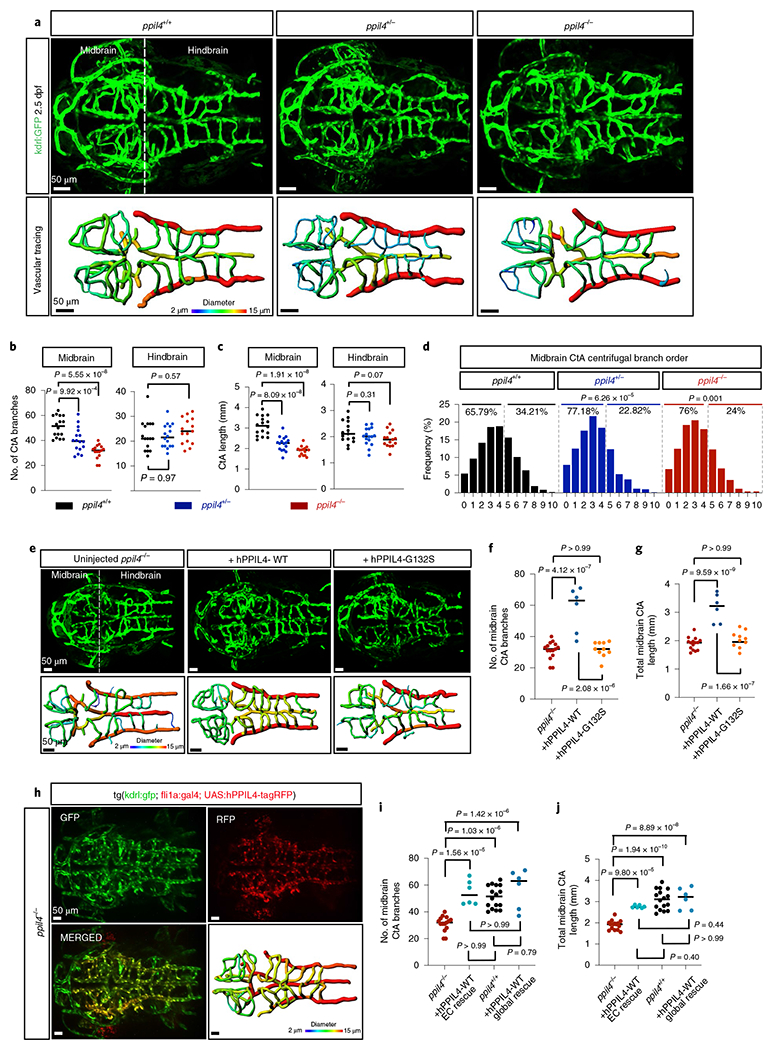
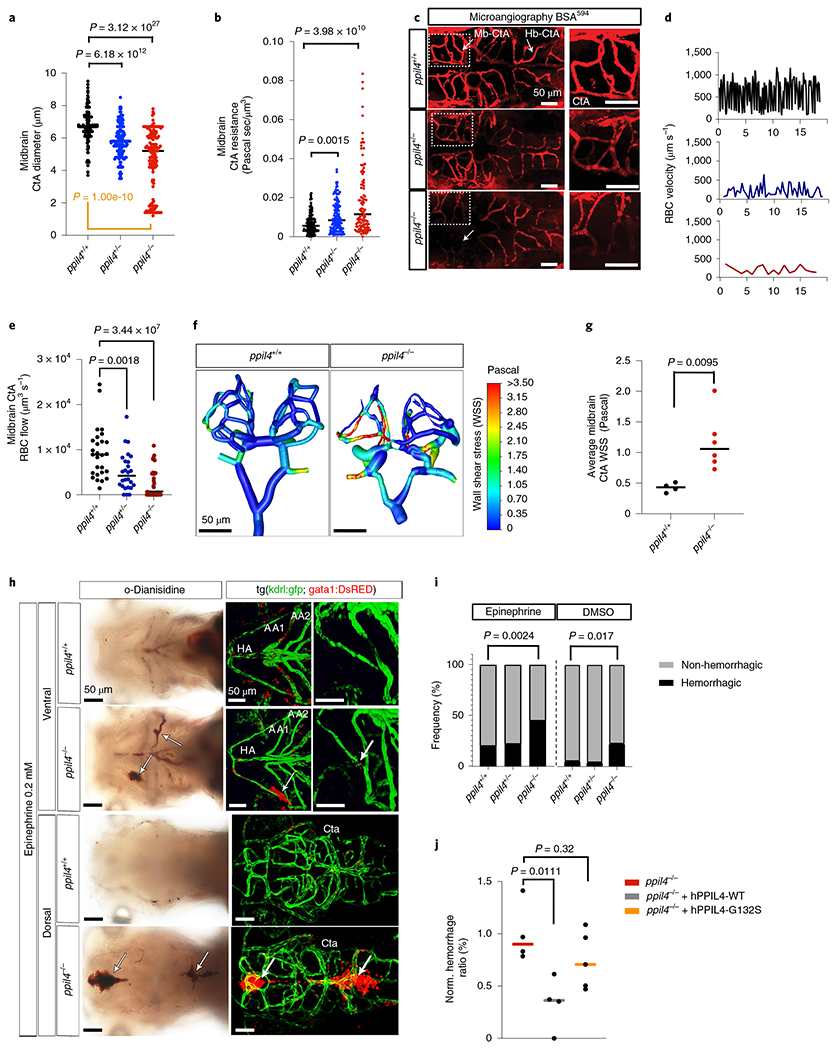
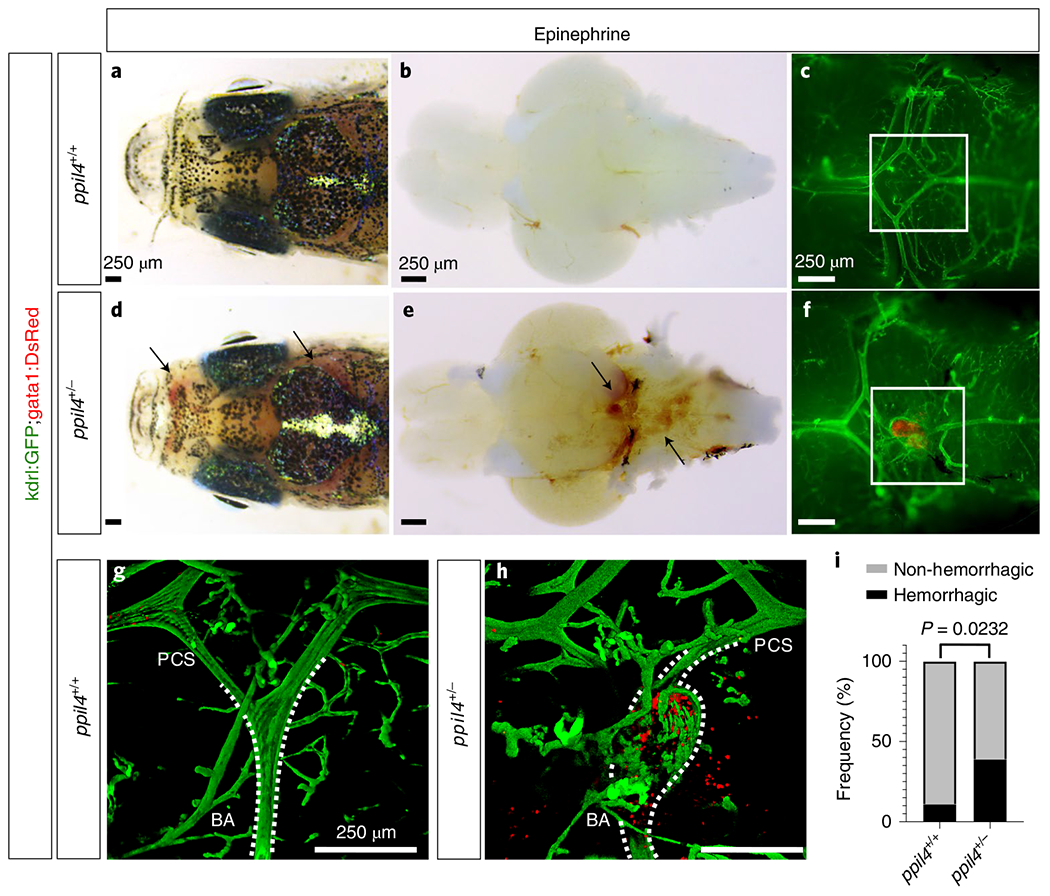
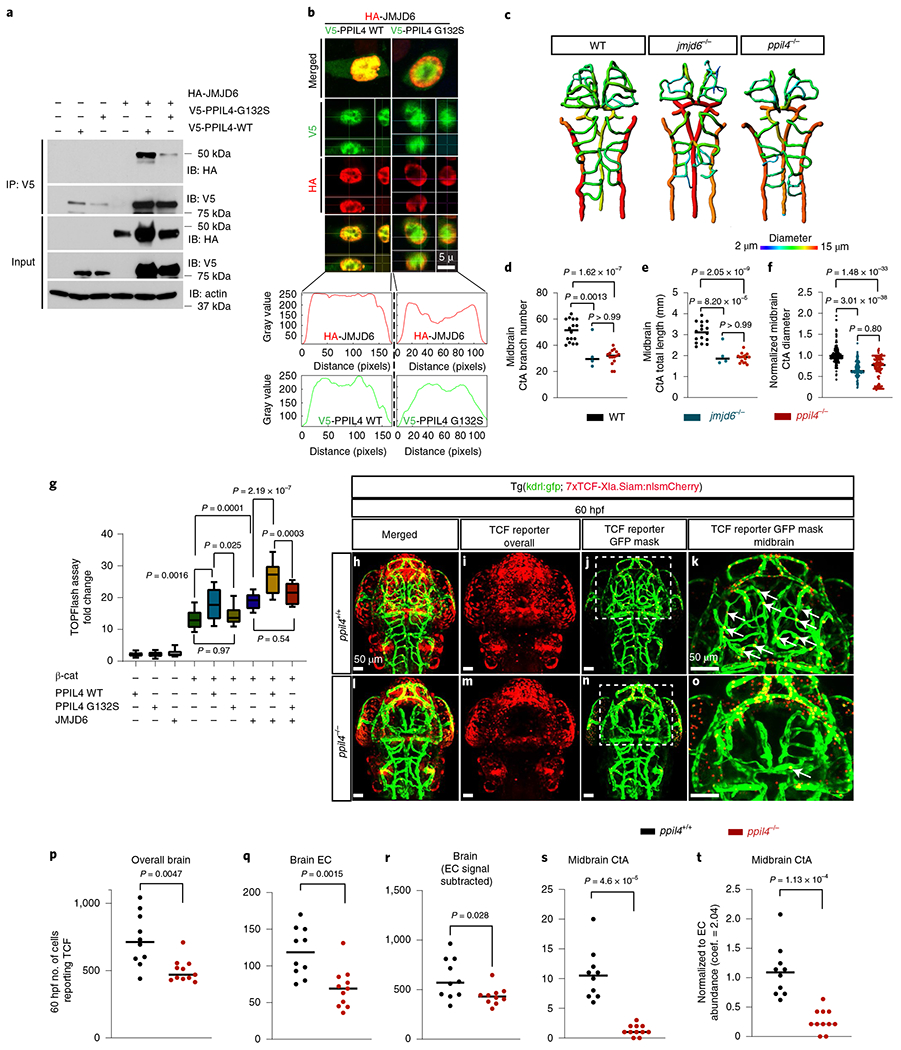
Intracranial aneurysm (IA) rupture leads to subarachnoid hemorrhage, a sudden-onset disease that often causes death or severe disability. Although genome-wide association studies have identified common genetic variants that increase IA risk moderately, the contribution of variants with large effect remains poorly defined. Using whole-exome sequencing, we identified significant enrichment of rare, deleterious mutations in PPIL4, encoding peptidyl-prolyl cis-trans isomerase-like 4, in both familial and index IA cases. Ppil4 depletion in vertebrate models causes intracerebral hemorrhage, defects in cerebrovascular morphology and impaired Wnt signaling. Wild-type, but not IA-mutant, PPIL4 potentiates Wnt signaling by binding JMJD6, a known angiogenesis regulator and Wnt activator. These findings identify a novel PPIL4-dependent Wnt signaling mechanism involved in brain-specific angiogenesis and maintenance of cerebrovascular integrity and implicate PPIL4 gene mutations in the pathogenesis of IA.


Conflict of interest statement

Competing interests

The authors declare no competing interests.

Figures

Extended Data Fig. 1 |
Extended Data Fig. 1 |. Sanger sequencing confirmation of PPIL4 variants identified by whole-exome sequencing (WES).
Sanger sequencing confirming heterozygous PPIL4 variants identified in IA patients. Locations of single nucleotide variations (red arrows), deletions (”:”) and the consecutive overlapping sequence. * represents stop gain mutation.
Extended Data Fig. 2 |
Extended Data Fig. 2 |. Gross morphologic assessment of ppil4 mutant zebrafish.
a, Schematic of the zebrafish ppil4 protein showing the location of the stop codon generated in the PPIase domain by Crispr-CAS9. A deletion of 11 bp in exon 5 causes a frameshift and a premature stop codon. b, Fluorescent in situ hybridization for ppil4 in ~1.3 and ~2 dpf wild type embryos (upper row). ppil4 is expressed in the head region but not in the trunk. ppil4 expression is lost in ppil4−/− mutants (lower row). The midbrain (blue-dashed line), hindbrain (pink-dashed), and optic tectum (white-dashed) boundaries are indicated, n= 3 sets of biological replicates with 30 zebrafish (each set) for both timepoints. c, Reduction in ppil4 expression in heterozygous and homozygous mutant zebrafish validated by qPCR. Values shown as fold change in different genotypes (X-axis) relative to wild type (Y-axis), beta actin was used for normalization, n= 3 sets of biological replicates. d, Bright-field images of wild-type, ppil4+/− and ppil4+/− embryos at different stages of development. No gross morphological defects were observed in heterozygous mutants. Arrows (6 dpf): swim bladder. e, ppil4−/− zebrafish manifest necrosis in the head at 48 hpf (white arrow), not evident at 32 hpf and lower jaw abnormality at 6 dpf (white arrow), n=3 sets of biological replicates. Data presented as individual scatter plot with median. Statistical test: One-way ANOVA with Dunnett’s multiple comparison test. E= eye, OV= otic vesicle, OT= Optic tectum. Scale bar: 200 μm in b and e; 1 mm in d.
Extended Data Fig. 3 |
Extended Data Fig. 3 |. The impact of ppil4 depletion on cerebrovascular network is persistent at 5.5 dpf.
a, Left panels: Maximum intensity projection (MIP) of representative confocal z-stack images in 5.5 dpf old ppil4+/+ (n=6), ppil4+/− (n=5) and ppil4−/− (n=6) embryos in the tg(kdrl:gfp)zn1 background (dorsal-view and caudal facing left). Right panels: Brain vessel segmentation in the larvae shown at left (Imaris). Colors represent branch depth ranging from 0 to 12 (higher and lower branch depth shown in red and blue, respectively). b-e, Quantification of midbrain CtA branch number (b) and length (c); Quantification of hindbrain CtA branch number (d) and length (e) in ppil4+/+ (n=6), ppil4+/− (n=5) and ppil4−/− (n=6) embryos, f-h, Confocal images (f) and comparative assessment (g,h) of trunk vasculature in 5.5 dpf old ppil4+/+ (n=7), ppil4+/− (n=4) or ppil4−/− (n=4) zebrafish. i-k, Confocal images (i) and comparative assessment (j,k) of trunk vasculature in 2.5 dpf old, n=9 per genotype. Individual values shown with scatter dot plot and median in b-e. The box extends from the 25th to 75th percentile. The whiskers show the minimum and the maximum values, while the line in the middle of the box is median in g,h,j and k. Statistical tests: One-way ANOVA followed by Dunnett’s multiple correction for all comparisons. Scale bar: 50 μm in a and i, 100 μm in f.
Extended Data Fig. 4 |
Extended Data Fig. 4 |. Loss of ppil4 results in reduction in endothelial cell number.
a,b, Confocal images of the cerebral vasculature of (a) 30 and (b) 60 hpf zebrafish in the tg(kdrl:mCherry; fli1:nGFP) background, expressing mCherry and GFP respectively in the cell membrane and nuclei of endothelial cells (ECs) (dorsal view). Arrows indicate angiogenic sprouting in midbrain (a), and hindbrain CtAs (b). c, Comparison of EC number at 30 hpf ppil4+/+ (n=10), ppil4+/− (n=15), and ppil4−/− (n=3) embryos. d, Comparison of EC number in the cerebral arteries of 60 hpf ppil4+/+ (n=9), ppil4+/− (n=17), and ppil4−/− (n=7) embryos. Individual values presented with scatter dot plot and median for all quantifications. Statistical tests: One-way ANOVA followed by Dunnett’s multiple comparison test for all comparisons. Abbreviations: Mb= Midbrain, Hb= Hindbrain, BA= Basilar Artery, PCS= Posterior communicating segment, PMBC= Primordial midbrain channel, PHBC= Primordial hindbrain channel, CtA= Central Artery. Scale bar: 50 μm in a and b.
Extended Data Fig. 5 |
Extended Data Fig. 5 |. ppil4−/− zebrafish exhibit apoptosis in neurons and radial glia, but not in endothelial cells.
a,b, Representative confocal images of 2.5 dpf embryos, where ppil4−/− mutants exhibit an increase in TUNEL-positive cells in the head region, n=4 sets biological replicates with 30 zebrafish per set. c-j, Cross-sections of the head. Embryos at 2.5 dpf in tg(kdrl:gfp)zn1 background were stained for Caspase-3 and HU (neurons) or GFAP (radial glia). Apoptosis was detected in neurons and radial glia (white asterisks), but not in endothelial cells (white box; arrows). Confocal images, n= 3 sets biological replicates with 30 zebrafish per set. k,l, Whole mount confocal images of 2.5 dpf embryos showing no difference in (k) neuronal (HU+) and (l) radial glial (GFAP+) population in ppil4 mutant genotypes, n= 3 sets biological replicates with 30 zebrafish per set. Dorsal view of the head region (left panel), lateral view of the trunk (right panel). Individual values shown with scatter dot plot and median. Statistical test: (b) One-way ANOVA followed by Dunnett’s multiple comparison test. Abbreviations: TUNEL: Terminal deoxynucleotidyl transferase dUTP nick end labeling; Fb: forebrain; Mb: midbrain; Hb: hindbrain; e=eye. Scale bar: 50 μm.
Extended Data Fig. 6 |
Extended Data Fig. 6 |. PPIL4 expression in endothelial cells.
a, Percentile rank of 15,521 transcripts expressed (FPKM) in brain-enriched endothelial cells (EC) in wildtype zebrafish (2.5 dpf), n=4 sets of biological replicates. b, ppil4 expression in zebrafish brain-enriched EC’s at 12, 24, 72 hpf and 3 months (relative to beta actin levels), n=3 sets of biological replicates. c, ppil4 expression levels in kdrl-GFP+ endothelial cells in the brain, liver, and the heart in 3 months old tg(kdrl:gfp) zebrafish (relative to beta actin levels), n=3 sets of biological replicates. d-i, Double immunostaining with pan-endothelial marker CD31 and PPIL4 demonstrating overlap in endothelial cell layer of human middle cerebral artery, n=4 biological replicates. j,k,m, In vitro tube formation assay showing significant impairment in branch formation in shRNA-treated compared with non-target control shRNA treated HUVECs, n=5 biological replicates. l, Reduction in PPIL4 expression in shRNA treated HUVEC validated by qPCR. Values shown as fold change relative to control (relative to TATA-binding protein [TBP]); n=4 biological replicates. m, Reduced number of nodes, branches, and junctions upon PPIL4 downregulation; n=5 biological replicates. n, Expression of PPIL4 and a list of angiogenesis-associated genes in wild type HUVECs (relative to TBP); n= 3 biological replicates. Individual values shown with scatter plot as mean with standard deviation in b; and median in c,l,n. In m, the box extends between 25th-75th percentile. The whiskers show the minimum and the maximum values. Central line is median. Statistical tests: (b,c) One-way ANOVA followed by Dunnett’s multiple comparison. (l,m) Two-tailed Student t-test.
Extended Data Fig. 7 |
Extended Data Fig. 7 |. Endothelial cell-specific overexpression of PPIL4 in ppil4−/− embryos restores cerebrovascular network simplification.
a-e Maximum intensity projection (MIP) of five representative confocal z-stack images of UAS:hPPIL4-WT-tagRFP injected embryos in (ppil4−/−; Tg(kdrl:gfp) zn1; tg(fli1a:gal4)) background at 2.5 dpf (dorsal view; caudal facing left), n=6. GFP+/RFP+ brain vessels, where GFP marks native endothelial cells and RFP endothelial cells overexpressing human WT-PPIL4. a-e, showing GFP-tagged kdrl expressing embryonic endothelial cells and cerebral vessels. a′-e′, PPIL4 overexpression is restricted to endothelial cells. a″-e″ Overlay of red and green channels. a‴-e‴ Vascular tracing performed using Imaris Filament application. f, Volcano plot representing differentially expressed genes in RNA-sequencing results of brain enriched endothelial cells upon abrogation of ppil4 (2.5 hpf). Dots represent genes and colors indicate Log2 fold change (FC) and FDR thresholds with genes meeting both (red), those over Log2FC (blue), those meeting FDR (green), or neither (grey). Horizontal and vertical dashed lines indicate, respectively, thresholds for significance (FDR <0.05) and Log2 FC>0.5. See methods for details of the experiment. g,h, Significant terms from the GO-Cellular Component for significantly differentially downregulated (g) and upregulated (h) genes. Dashed lines showing threshold for significance (FDR=0.05). Scale bar: 50 μm.
Extended Data Fig. 8 |
Extended Data Fig. 8 |. Genes with strong positive statistical co-dependency with PPIL4 expression are enriched in brain arterial endothelial cells and Wnt signaling pathway.
Analysis of publicly available scRNAseq mouse brain endothelial cell datasets obtained from Vanlandewijck et al. & He, L. et al. (PMID: 29443965). a, PHATE plot identifies two major groups in brain endothelial cells, arterial and venous (top left panel). Pseudotime analysis demonstrating PPIL4 expression predominantly in arterial endothelial cells when compared to venous (SLC38A5) and arterial (GKN3) markers. b, GSEA revealing that the top 50 genes associated with venous endothelial cells are significantly enriched among the top ranked genes specifically expressed in Cluster 0. Similarly, GSEA showing significant enrichment of the top 50 arterial endothelial genes among the top ranked genes in Cluster 1. c, Expression of 200 genes with top knn-DREMI score (y axis) ordered by DREVI-based clustering and by peak expression along PPIL4 (x axis). d, Bar plots showing significantly enriched KEGG pathways for genes above 95th percentile knn-DREMI score and positive relationship with PPIL4.
Extended Data Fig. 9 |
Extended Data Fig. 9 |. PPIL4-WT binding to JMJD6 in both nucleus and cytoplasm and overlapping phenotypes in ppil4−/− and jmjd6−/− zebrafish embryos.
a, Lysates of HEK293 cells expressing HA-JMJD6, V5-PPIL4WT and V5-PPIL4G132S were separated into cytoplasmic and nuclear fractions. Cell lysate (input) and V5-IP of cytoplasmic and nuclear fractions were subjected to immunoblotting with anti-HA, anti-V5, lamin A/C (nuclear fraction [right]), tubulin (cytoplasmic fraction [left]) and actin antibodies. The blots shown are representative of three biological replicates. b,c Bright-field images showing necrosis in the head of jmjd6−/− 2.5 dpf embryos. d, Location of sgRNA designed to target jmjd6 leading to a 2bp deletion in exon 3 and a premature stop codon. e-g, Maximum intensity projection (MIP) of representative confocal z-stack images of 2.5 dpf wild type (n=16), jmjd6−/− (n=4), and ppil4−/− (n=15) embryos in the tg(kdrl:gfp)zn1 background (top panels). Brain vessel segmentation in same larvae obtained by Imaris software; colors represent vessel diameter (bottom panels). Homozygous deletion of jmjd6 or ppil4 individually results in dramatic reduction in midbrain CtA complexity and impairment in vascular morphology. Scale bar: 200 μm in b and c; 50 μm in e-g.
Extended Data Fig. 10 |
Extended Data Fig. 10 |. ppil4 depletion leads to impaired activation of Wnt signaling in brain parenchyma and brain ECs of 30 hpf zebrafish.
a-c, Maximum intensity projection (MIP) of confocal z-stack images of three representative 30 hpf ppil4−/− and d-f, ppil4++/+ embryos in double transgenic tg(kdrl:gfp; 7xTCF-Xla.Siam:nlsmCherry) background to visualize Wnt signaling activity (red) and endothelial cells (green) (dorsal view and caudal facing up). TCF reporter signal is quantified using the Spots application in Imaris demonstrating loss of TCF reporting cells in brain parenchyma as well as in midbrain CtAs of ppil4−/− embryos. Endothelial specific Wnt-activity is calculated using Spots-Mask for GFP channel in the designated area in a. See methods for details of image processing and presentation. g-i, Quantification of number of TCF reporting cells using the Spots application in Imaris software showing significant decrease in Wnt-activity in ppil4−/− embryos, in (g) overall brain and (h) brain endothelial cells compared with wild type. (i) Wnt signaling activity in overall brain after subtracting the Wnt activity in endothelial cells. n= 4, and 9 embryos for ppil4+/+ and ppil4−/− respectively. Individual values presented with scatter dot plot and median for all quantifications. Statistical tests performed: Two-tailed Student t-test. Scale bar: 100 μm.
Fig. 1 |
Fig. 1 |. Heterozygous rare and deleterious PPIL4 mutations in familial and index IA cases.
a, Pedigree structure of IA200 (arrow: index case; filled symbols: affected individuals). b, Tertiary structure of PPIL4 (left: wild-type; right: IA-variant) encompassing amino acid 132. Structural clashes are marked with red dashed lines (green: carbon; blue: nitrogen; red: oxygen). Below, molecular surface of the modeled structure (white: hydrophobic; yellow: semi-polar; cyan: polar; blue: positively charged; red: negatively charged; magenta: aromatic; pale green: proline; green: glycine residues). c, Rare and deleterious mutations (Methods) identified in patients with IA. MAFs are reported as general and population MAF. *East Asian (EAS) MAF. d, Scatter plot showing percentile rank of arterial expression enrichment ratio of 18,099 transcripts in the GtEX portal (Methods). Representative genes associated with aneurysm formation with high arterial expression (JAG1, MYH11 and TGFBR2) are indicated. e, Summary of burden analysis (two-sided Fisher’s exact test). f, Schematic of the PPIL4 protein and IA mutations. g, 3D volume-rendered computed tomography angiogram showing a left middle cerebral artery aneurysm (arrow) in a 61-year-old patient (IA577), carrying a stop-gained heterozygous mutation (R190X). n, number of alleles; WGS, whole-genome sequencing; Mut., number of mutant alleles; Nor., number of normal alleles; RRM, RNA recognition motif. EUR, European; INF, infinity; NFE, non-Finnish European.
Fig. 2 |
Fig. 2 |. Cerebrovascular simplification in ppil4-depleted zebrafish is prevented by overexpression of human PPIL4WT but not by IA-associated PPIL4G132S.
a, MIP of confocal z-stack images and vessel segmentation of ppil4+/+ (n = 16), ppil4+/− (n = 16) and ppil4−/− (n = 15) embryos in tg(kdrl:gfp)zn1 background at 2.5 dpf. b,c, Quantifications of CtA branches (b) and total length (c) in ppil4+/+ (n = 16), ppil4−/− (n = 16) and ppil4−/− (n = 15) embryos. d, Branching level of midbrain CtAs in centrifugal order n = 874, 609 and 521 vessels in ppil4+/+ (n = 16), ppil4+/− (n = 16) and ppil4−/− (n = 14), respectively. eg, Global rescue experiments. n = 15, 6 and 10 for uninjected, hPPIL4WT- and hPPIL4G132-injected ppil4−/−, respectively. e, MIP of confocal z-stack images and vessel segmentation at 2.5 dpf. f,g, Comparison of midbrain CtA branches (f) and total length (g). hj, Endothelial-specific rescue experiments. n = 15, 6, 16 and 6 for uninjected ppil4−/−, endothelial-specific rescue of ppil4−/− with hPPIL4-WT, ppil4−/− and global rescue of ppil4−/− with hPPIL4-WT. h, MIP of a representative confocal image of UAS:hPPIL4-WT-tagRFP-injected embryo in ppil4−/−;tg(kdrl:gfp)zn1;tg(fli1a:gal4) background at 2.5 dpf, n = 6. i,j, Comparison of midbrain CtA branches (i) and total length (j). Individual values shown with scatter dot plot and median for all quantifications. Statistical tests: one-way ANOVA followed by Dunnett’s multiple comparison (b,c); pairwise Fisher’s exact test with FDR correction (d). f,g,i,j, One-way ANOVA followed by Bonferroni multiple comparison test. Scale bar, 50 μm. EC, endothelial cell.
Fig. 3 |
Fig. 3 |. Depletion of ppil4 leads to cerebral hemorrhage.
a, Midbrain CtA diameter in ppil4+/+ (n = 153), ppil4+/− (n = 147) and ppil4−/− (n = 140) embryos at 2.5 dpf. Orange bar: Levene’s test. b, Vascular resistance in midbrain CtAs in ppil4+/+ (n = 143), ppil4+/− (n = 129) and ppil4−/− (n = 109) embryos at 2.5 dpf. c, Microangiography by transcardiac injection of BSA594 (2.5 dpf), n = 10 per genotype. d,e, Representative time–velocity plots (d) and comparison of blood flow (e) in midbrain CtAs at 2.5 dpf, n = 27, 26 and 33 vessels in ppil4+/+, ppil4+/− and ppil4−/−, respectively. f,g, Wall shear stress in 3D cerebrovascular models of ppil4+/+ (n = 4) and ppil4−/− (n = 6) zebrafish (2.5 dpf) using ANSYS. h, Bright-field (o-Dianisidine staining) and confocal images of tg(kdrl:GFP;gata1:dsRED) of ppil4+/+ (n = 70) and ppil4−/− zebrafish (n = 78) embryos treated with epinephrine (AA1 and AA2, first and second aortic arch arteries; HA, hypobranchial artery). i, Hemorrhagic events in brain and aortic arch arteries after epinephrine (h) versus DMSO (vehicle) treatment at 72 hpf, nepi = 70, 163 and 78 and nDMSO = 56, 121 and 66 for ppil4+/+, ppil4+/− and ppil4−/−, respectively. j, Normalized frequency of epinephrine-induced hemorrhage in brain and aortic arch arteries in uninjected, hPPIL4WT- or hPPIL4G132S-injected ppil4−/− embryos, n = 4, 4 and 5 sets of biological replicates with 200 zebrafish per set. Individual values are shown with scatter plot and median in a,b,e,g and j. Statistical tests: Kruskal-Wallis test followed by Dunn’s test (a,b); Levene’s test (based on median) (a); one-way ANOVA with Dunnett’s multiple comparison test (e,j); two-tailed Mann-Whitney test (g); pairwise Fisher’s exact test with FDR correction (i). Scale bar, 50 μm. WSS, wall shear stress.
Fig. 4 |
Fig. 4 |. Hemodynamic stress leads to intracranial hemorrhage in adult heterozygous zebrafish.
ah, Administration of epinephrine (0.5 mg kg−1) via retro-orbital injection in 3-month-old wild-type (n = 19) (a-c) and ppil4+/− (n = 51) (d-f) zebrafish in tg(kdrl:gfp;gata1:dsred) background results in intracranial hemorrhage (d-f,h; arrows) or vascular dilation (f,h) in ppil4+/− zebrafish. a,d, Dorsal view of the head. b,e, Ventral view of the brain with bright-field microscopy. c,f, Fluorescence microscopy of ventral vascular structures in the circle of Willis of the brains shown in b and e. g,h, Confocal images of the areas delineated by white squares in c and f. The images are rotated 90° clockwise. BA, basilar artery. i, Quantification of intracranial hemorrhage events in 3-month-old ppil4+/+ (n = 19) and ppil4+/− (n = 51) zebrafish upon epinephrine administration. Statistical test: two-sided Fisher’s exact test.
Fig. 5 |
Fig. 5 |. PPIL4 potentiates Wnt activity by binding to JMJD6.
a, Co-immunoprecipitation of JMJD6 with PPIL4WT or PPIL4G132S in HEK293 cells. Input: whole cell lysates, n = 3 biological replicates. b, Orthogonal section from representative confocal images of HEK293 cells expressing HA-JMJD6, V5-PPIL4WT and V5-PPIL4G132S. Lower panels: co-localization of red and green channels within the nucleus, n = 3 biological replicates. c-f, Brain vessel segmentation and phenotypic assessment in wild-type (n = 16), ppil4−/− (n = 15) and jmjd6−/− (n = 4) at 2.5 dpf. g, Effect of transient overexpression of JMJD6, PPIL4WT, PPIL4G132S or β-catenin on Wnt signaling activation (TOPFlash assay), n = 4 biological replicates. h-o, MIP of confocal z-stack images of ppil4+/+ (n = 10) and ppil4−/− (n = 11) embryos in tg(kdrl:gfp; 7xTCF-Xla.Siam:nlsmCherry) background at 60 hpf. j,n, Visualization of endothelial-specific Wnt activity using the Spots Mask application (Imaris). k,o, Higher magnification of the indicated areas in j and n, respectively. p-t, Quantification (Imaris) of TCF reporter signal in ppil4 +/+ (n = 10) and ppil4 −/− (n = 11) embryos at 60 hpf. See Methods for details of image processing and assembly. t, Number of TCF-reporting endothelial cells normalized to endothelial cell number using a coefficient of 2.04 obtained from endothelial cell abundance experiments (Methods). Individual values are shown with scatter dot plot and median in d-f and p-t. In g, the box extends from the 25th to the 75th percentile; the whiskers show the minimum and maximum values; and the line at the center is the median. Statistical tests: one-way ANOVA (d-g), followed by Dunnett’s (d-f) or Sidak’s (g) multiple comparison test. p-t, Two-tailed Student’s t-test. Scale bar, 5 μm in b and 50 μm in h-o. EC, endothelial cell.

Similar articles

Cited by

References

    1. Vlak MH, Algra A, Brandenburg R & Rinkel GJ Prevalence of unruptured intracranial aneurysms, with emphasis on sex, age, comorbidity, country, and time period: a systematic review and meta-analysis. Lancet Neurol. 10, 626–636 (2011). - PubMed
    1. Korja M, Lehto H, Juvela S & Kaprio J Incidence of subarachnoid hemorrhage is decreasing together with decreasing smoking rates. Neurology 87, 1118–1123 (2016). - PMC - PubMed
    1. Lindbohm JV, Kaprio J, Jousilahti P, Salomaa V & Korja M Risk factors of sudden death from subarachnoid hemorrhage. Stroke 48, 2399–2404 (2017). - PubMed
    1. Korja M et al. Cause-specific mortality of 1-year survivors of subarachnoid hemorrhage. Neurology 80, 481–486 (2013). - PMC - PubMed
    1. Kissela BM et al. Subarachnoid hemorrhage: a preventable disease with a heritable component. Stroke 33, 1321–1326 (2002). - PubMed

Publication types