. 2021 Nov 23:12:727741.
doi: 10.3389/fpls.2021.727741. eCollection 2021.

Differential Protein Expression Analysis of Two Sugarcane Varieties in Response to Diazotrophic Plant Growth-Promoting Endophyte Enterobacter roggenkampii ED5

Affiliations

Differential Protein Expression Analysis of Two Sugarcane Varieties in Response to Diazotrophic Plant Growth-Promoting Endophyte Enterobacter roggenkampii ED5

Dao-Jun Guo et al. Front Plant Sci. .

Abstract

Plant endophytic bacteria have many vital roles in plant growth promotion (PGP), such as nitrogen (N) fixation and resistance to biotic and abiotic stresses. In this study, the seedlings of sugarcane varieties B8 (requires a low concentration of nitrogen for growth) and GT11 (requires a high concentration of nitrogen for growth) were inoculated with endophytic diazotroph Enterobacter roggenkampii ED5, which exhibits multiple PGP traits, isolated from sugarcane roots. The results showed that the inoculation with E. roggenkampii ED5 promoted the growth of plant significantly in both sugarcane varieties. 15N detection at 60 days post-inoculation proved that the inoculation with strain ED5 increased the total nitrogen concentration in the leaf and root than control in both sugarcane varieties, which was higher in B8. Biochemical parameters and phytohormones in leaf were analyzed at 30 and 60 days after the inoculation. The results showed that the inoculation with E. roggenkampii ED5 improved the activities of superoxide dismutase (SOD), catalase (CAT), NADH-glutamate dehydrogenase (NADH-GDH), glutamine synthetase (GS), and endo-β-1,4-glucanase, and the contents of proline and indole acetic acid (IAA) in leaf, and it was generally more significant in B8 than in GT11. Tandem Mass Tags (TMT) labeling and liquid chromatography-tandem mass spectrometry (LC-MS/MS) were used to perform comparative proteomic analysis in the sugarcane leaves at 30 days after inoculation with strain ED5. A total of 27,508 proteins were detected, and 378 differentially expressed proteins (DEPs) were found in the treated sugarcane variety B8 (BE) as compared to control (BC), of which 244 were upregulated and 134 were downregulated. In contrast, a total of 177 DEPs were identified in the treated sugarcane variety GT11 (GE) as compared to control (GC), of which 103 were upregulated and 74 were downregulated. The DEPs were associated with nitrogen metabolism, photosynthesis, starch, sucrose metabolism, response to oxidative stress, hydrolase activity, oxidative phosphorylation, glutathione metabolism, phenylpropanoid metabolic process, and response to stresses in Gene Ontology (GO) and Kyoto Encyclopedia of Genes and Genomes (KEGG) database. To the best of our knowledge, this is the first proteomic approach to investigate the molecular basis of the interaction between N-fixing endophytic strain E. roggenkampii ED5 and sugarcane.

Keywords: Enterobacter roggenkampii ED5; N-fixation; PGP; TMT; endophyte; proteome; sugarcane.


Conflict of interest statement

The authors declare that the research was conducted in the absence of any commercial or financial relationships that could be construed as a potential conflict of interest.

Figures
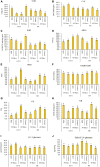
FIGURE 1
FIGURE 1
Variations in biochemical parameters in the leaf of sugarcane varieties GT11 and B8 inoculated with E. roggenkampii ED5 as compared to control. (A) Superoxide dismutase (SOD) activity, (B) catalase (CAT) activity, (C) peroxidase (POD) activity, (D) malondialdehyde (MDA) content, (E) proline (Pro) content, (F) NADH-glutamate dehydrogenase (NADH-GDH) activity, (G) glutamine synthetase (GS) activity, (H) nitrate reductase (NR) activity, (I) β-1,3-glucanase (β-1,3-GA) activity, and (J) endo-β-1,4-glucanase activity. Plant samples were collected at 30 and 60 days after the inoculation. At the level of p < 0.05, different letters indicate significant changes between treatments.
FIGURE 2
FIGURE 2
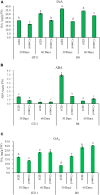
Variations in contents of phytohormones in the leaf of sugarcane varieties GT11 and B8 inoculated with E. roggenkampii ED5 as compared to control at 30 and 60 days after the treatment. (A) Indole acetic acid (IAA), (B) abscisic acid (ABA), and (C) gibberellin (GA3). At the level of p < 0.05, different letters indicate significant changes between treatments.
FIGURE 3
FIGURE 3
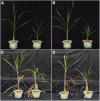
Sugarcane growth promotion by inoculation of E. roggenkampii ED5 as compared to control. (A) GT11 (30 days), (B) B8 (30 days), (C) GT11 (60 days), and (D) B8 (60 days).
FIGURE 4
FIGURE 4
Volcano plots showing the differentially expressed protein allocation in the sugarcane varieties GT11 (A) and B8 (B) after the inoculation of E. roggenkampii ED5 as compared to control. Each data point represented the differential expression of the protein in the volcano plot. Downregulated differentially expressed proteins were shown with green dots, upregulated differentially expressed proteins were marked with red dots, and non-differentially expressed proteins were labeled by gray dots. Protein ratios with p-value < 0.05, fold change > 1.20 (upregulated), or < 0.83 (downregulated) were significantly differently expressed.
FIGURE 5
FIGURE 5
Venn diagrams showing the differentially expressed protein number allocation among the high-efficiency nitrogen-fixing variety B8 and low-efficiency nitrogen-fixing variety GT11 of sugarcane after the inoculation of E. roggenkampii ED5 as compared to control.
FIGURE 6
FIGURE 6
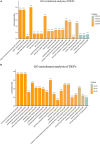
GO enrichment of differentially expressed proteins in (A) GT11 and (B) B8 varieties of sugarcane inoculated with E. roggenkampii ED5 as compared to control. The abscissa represents the GO term and the ordinate represents the enrichment rate. The color gradient of the column represents the significance of enrichment, where p or FDR < 0.001 was marked as ***, p or FDR < 0.01 was marked as **, and p or FDR < 0.05 was marked as *.
FIGURE 7
FIGURE 7
KEGG enrichment of differentially expressed proteins in (A) GT11 and (B) B8 varieties of sugarcane inoculated with E. roggenkampii ED5 as compared to control. The KEGG-enriched string diagram depicted the relationship between the target protein set and the KEGG pathway annotation and enrichment. The left side indicated the proteins and the log2FC was displayed in order from top to bottom. The larger the log2FC, the greater the difference in the expression of the upregulated proteins. The smaller the log2FC, the greater the difference in the expression of the downregulated proteins. The closer the log2FC was to 0, the smaller the difference in the fold of differential expression of the proteins. The right gave the name of the KEGG pathway that enriched the target protein and the Z score. The count represented the number of proteins associated with this pathway. For the total number of target proteins, up represented the number of upregulated proteins linked in this pathway, and down represented the number of downregulated proteins involved in this pathway. Z score > 0 meant that there were more upregulated proteins than downregulated proteins involved in this pathway, and this pathway was more likely to be activated. Z score < 0 indicated that there were fewer upregulated proteins than downregulated proteins involved in this pathway, and this pathway was more likely to be inhibited. In this enrichment chart, the top 50 target proteins with a large number of annotation pathways were selected. The pathways contained these target proteins in the enrichment and the pathways with the enrichment significance p-value of these target proteins were ranked in the top 15 for display.

Similar articles

Cited by

References

    1. Alberton D., Valdameri G., Moure V. R., Monteiro R. A., Pedrosa F. D. O., Müller-Santos M., et al. (2020). What did we learn from plant growth-promoting rhizobacteria (PGPR)-grass associations studies through proteomic and metabolomic approaches? Front. Sustain. Food Syst. 4:607343. 10.3389/fsufs.2020.607343 - DOI
    1. Antunes J. E. L., Freitas A. D. S., Oliveira L., Delyra M., Fonseca M. A., et al. (2019). Sugarcane inoculated with endophytic diazotrophic bacteria: effects on yield, biological nitrogen fixation and industrial characteristics. Anais Acad. Brasil. Ciências 91:3765201920180990. 10.1590/0001-3765201920180990 - DOI - PubMed
    1. Asghari B., Khademian R., Sedaghati B. (2020). Plant growth promoting rhizobacteria (PGPR) confer drought resistance and stimulate biosynthesis of secondary metabolites in pennyroyal (Mentha pulegium L.) under water shortage condition. Sci. Horticul. 263:109132. 10.1016/j.scienta.2019.109132 - DOI
    1. Bai L., Sun H. B., Liang R. T., Cai B. Y. (2019). iTRAQ proteomic analysis of continuously cropped soybean root inoculated with Funneliformis mosseae. Front. Microbiol. 10:61. 10.3389/fmicb.2019.00061 - DOI - PMC - PubMed
    1. Basanta M. V., Dourado-Neto D., Reichardt K., Bacchi O. O. S., Oliveira J. C. M., Trivelin P. C. O., et al. (2003). Management effects on nitrogen recovery in a sugarcane crop grown in Brazil. Geoderma 116 235–248. 10.1016/s0016-7061(03)00103-4 - DOI