. 2021 Jul:1:598-615.
doi: 10.1038/s43587-021-00082-y. Epub 2021 Jul 12.

An inflammatory aging clock (iAge) based on deep learning tracks multimorbidity, immunosenescence, frailty and cardiovascular aging

Affiliations

An inflammatory aging clock (iAge) based on deep learning tracks multimorbidity, immunosenescence, frailty and cardiovascular aging

Nazish Sayed et al. Nat Aging. 2021 Jul.

Erratum in

Abstract

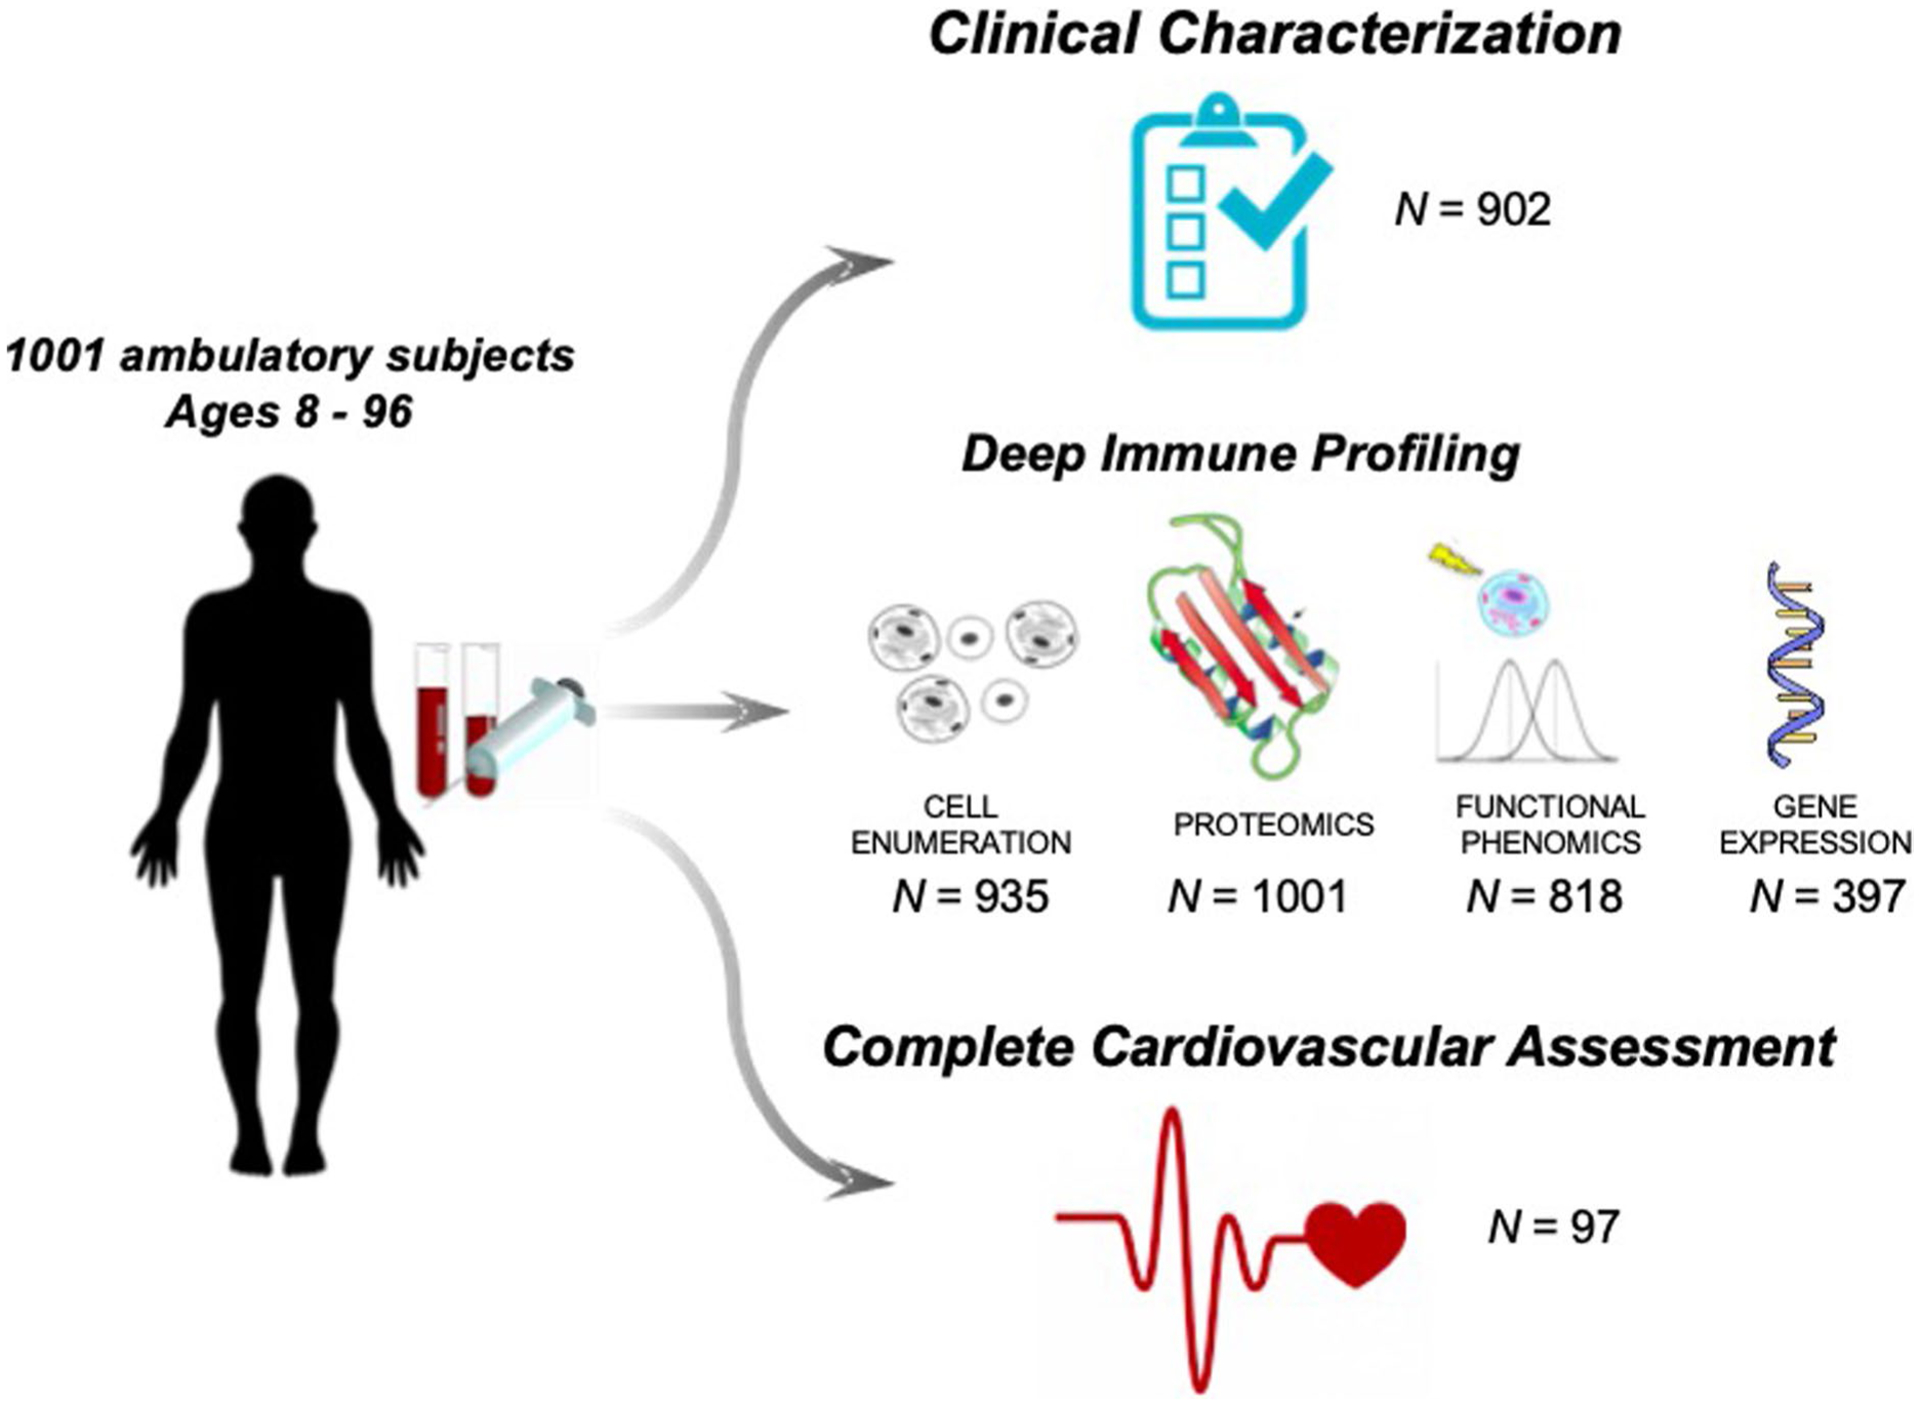
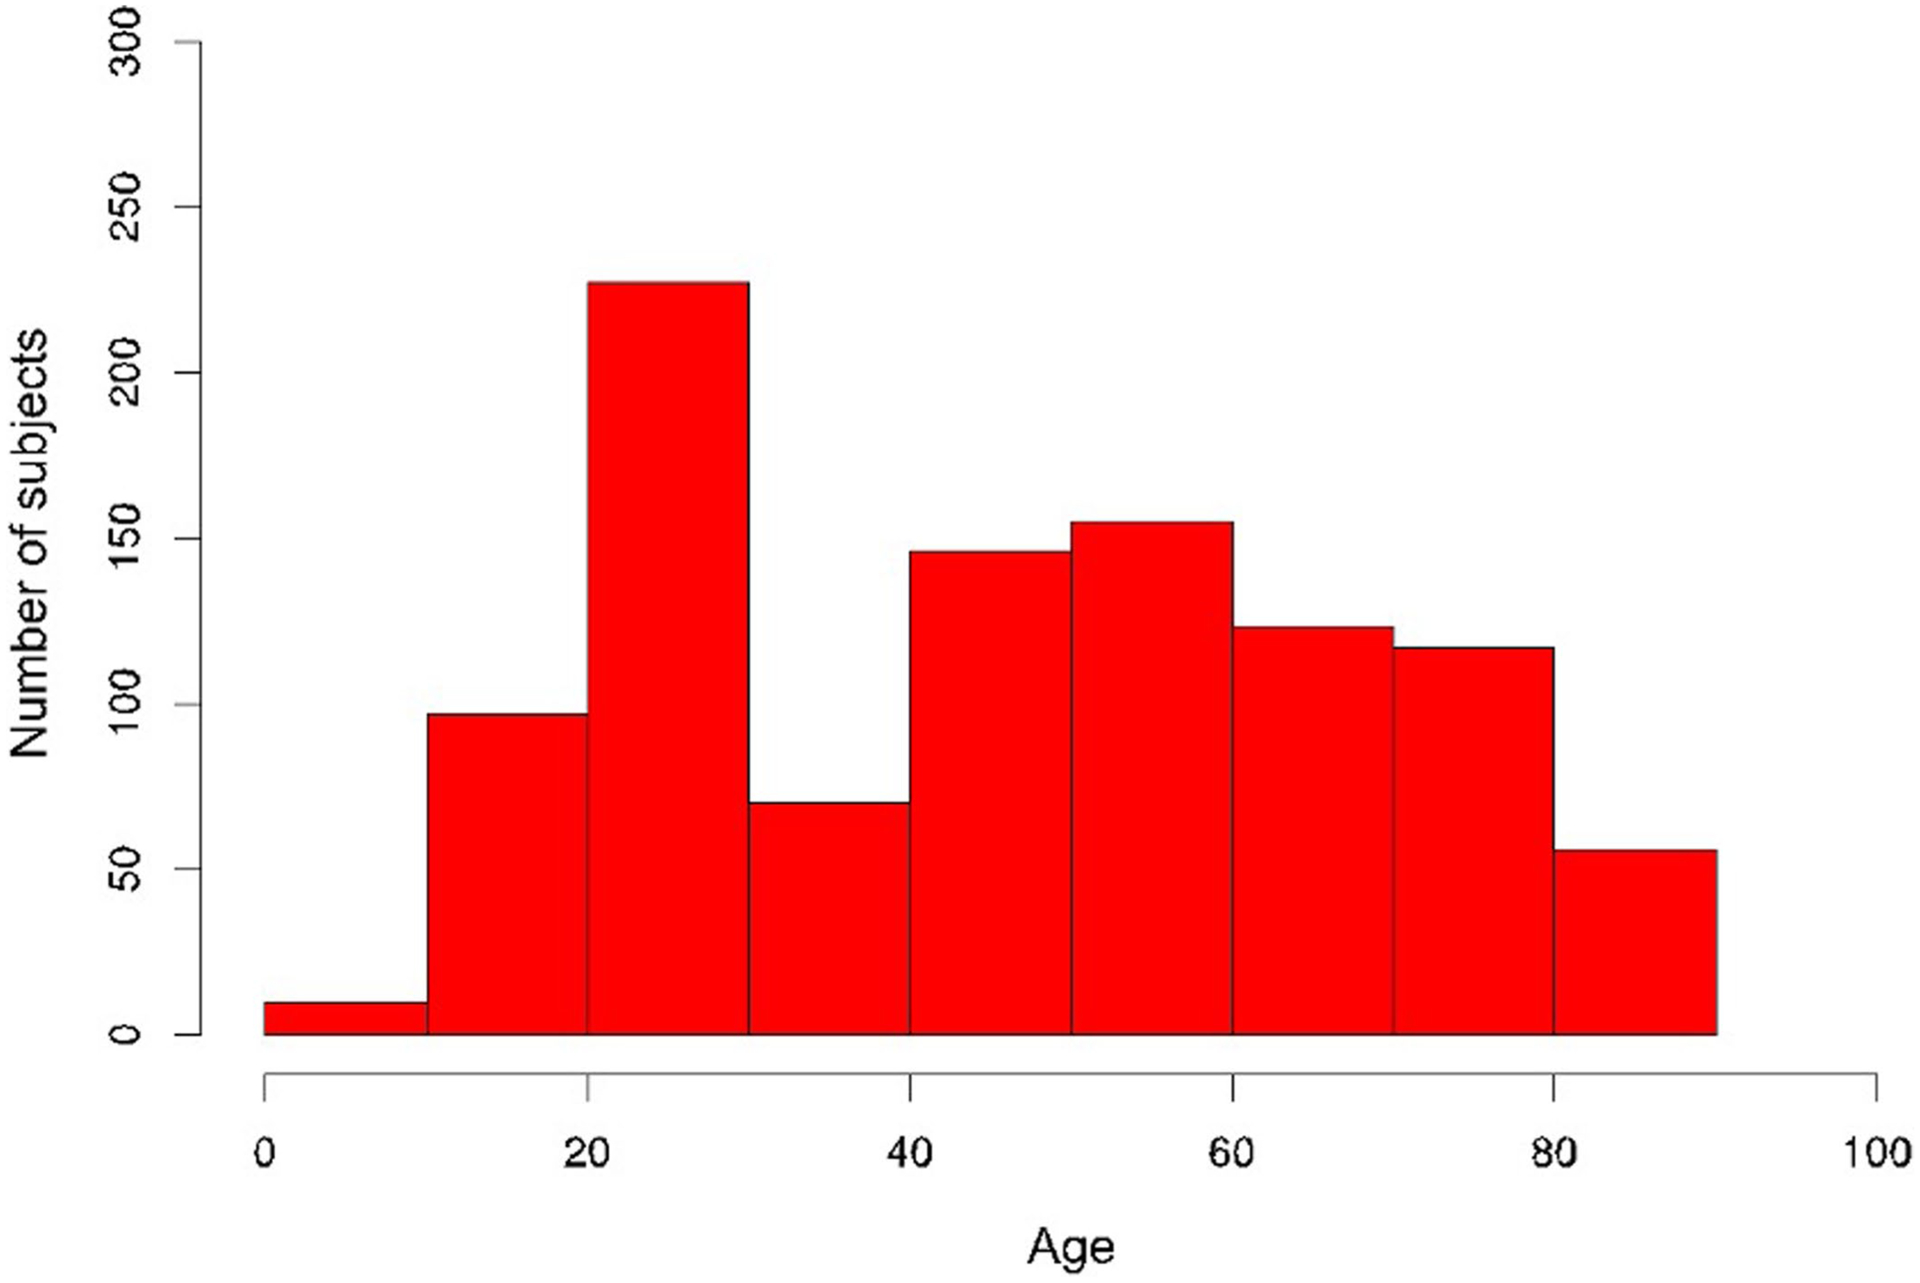
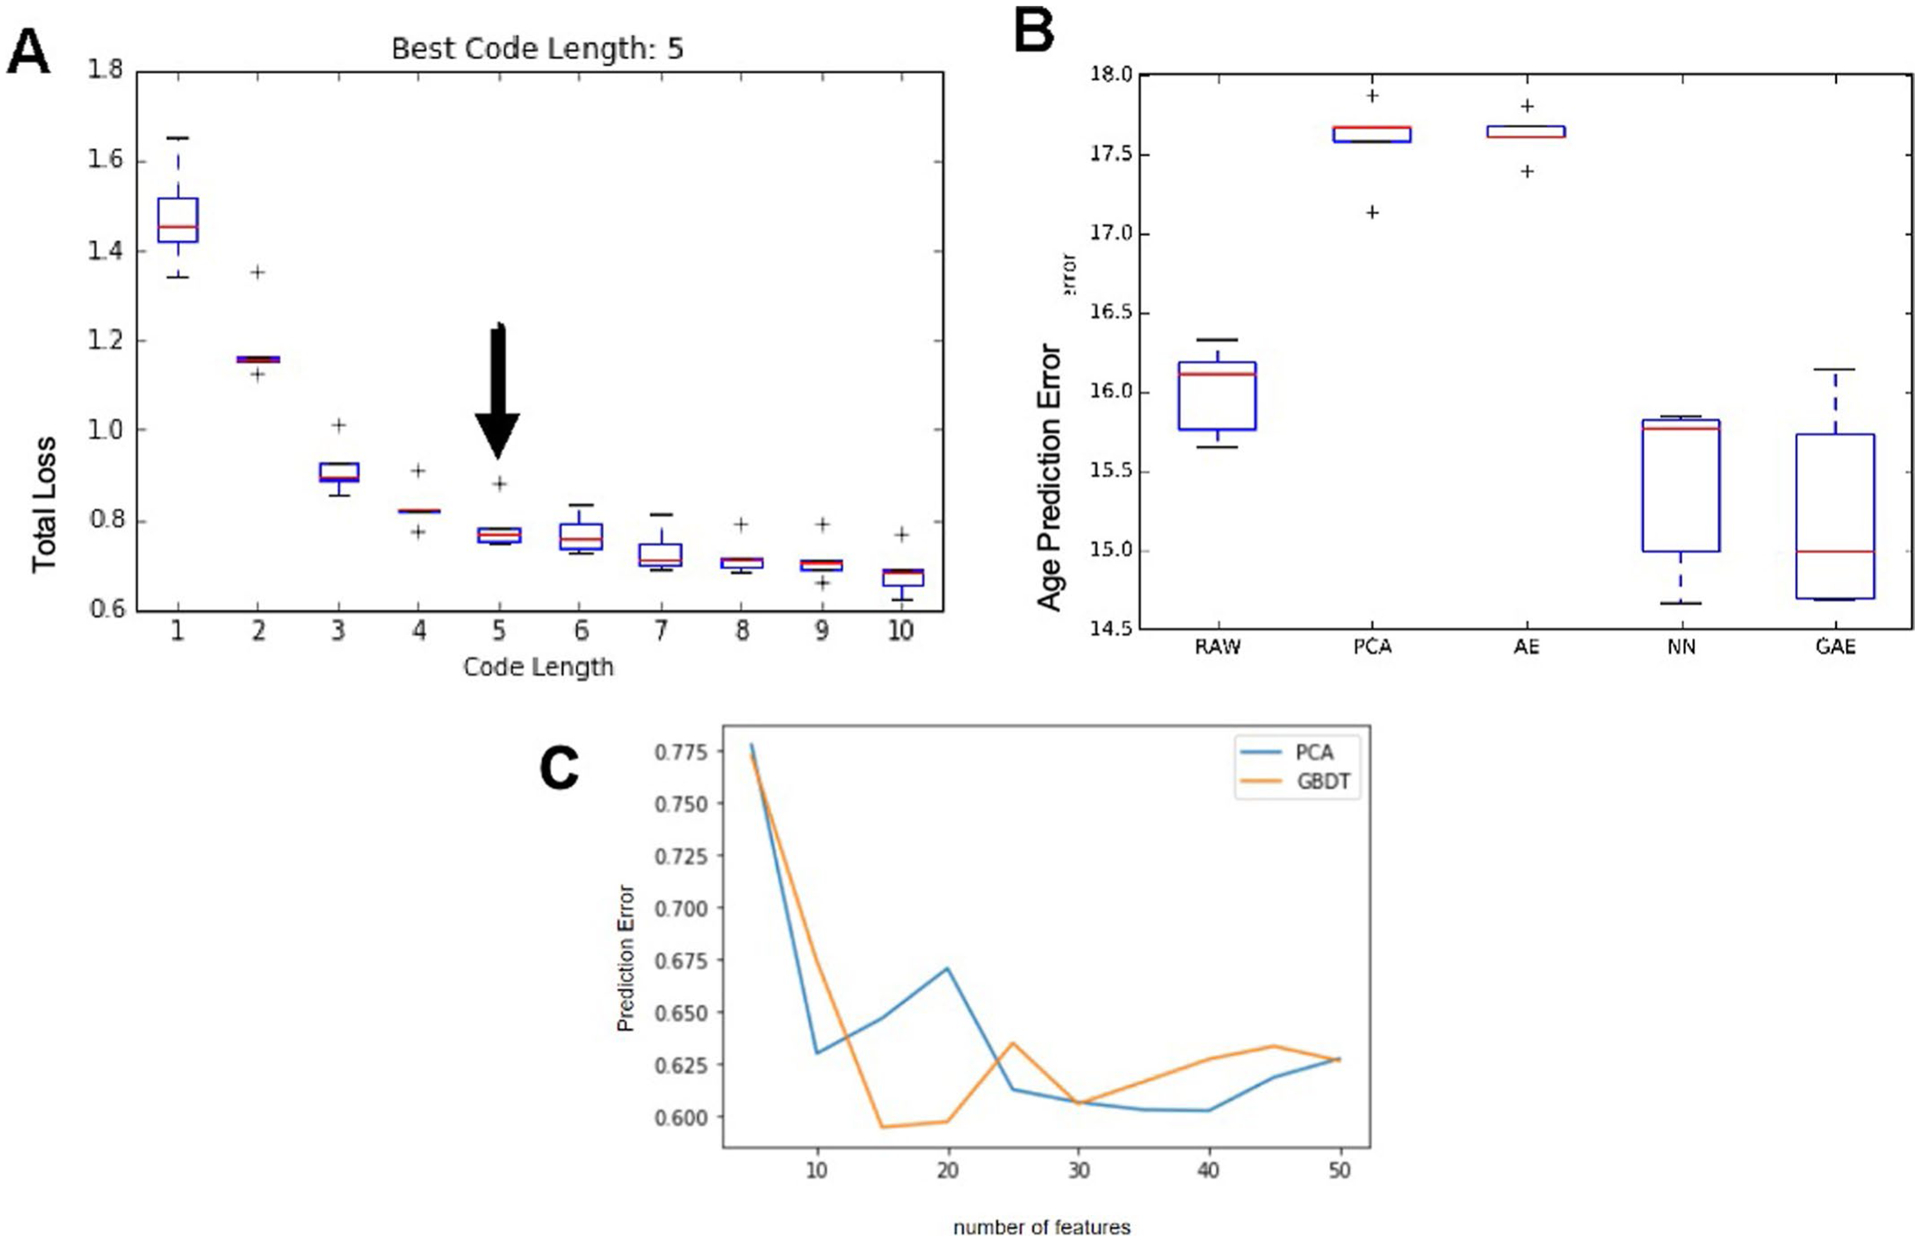
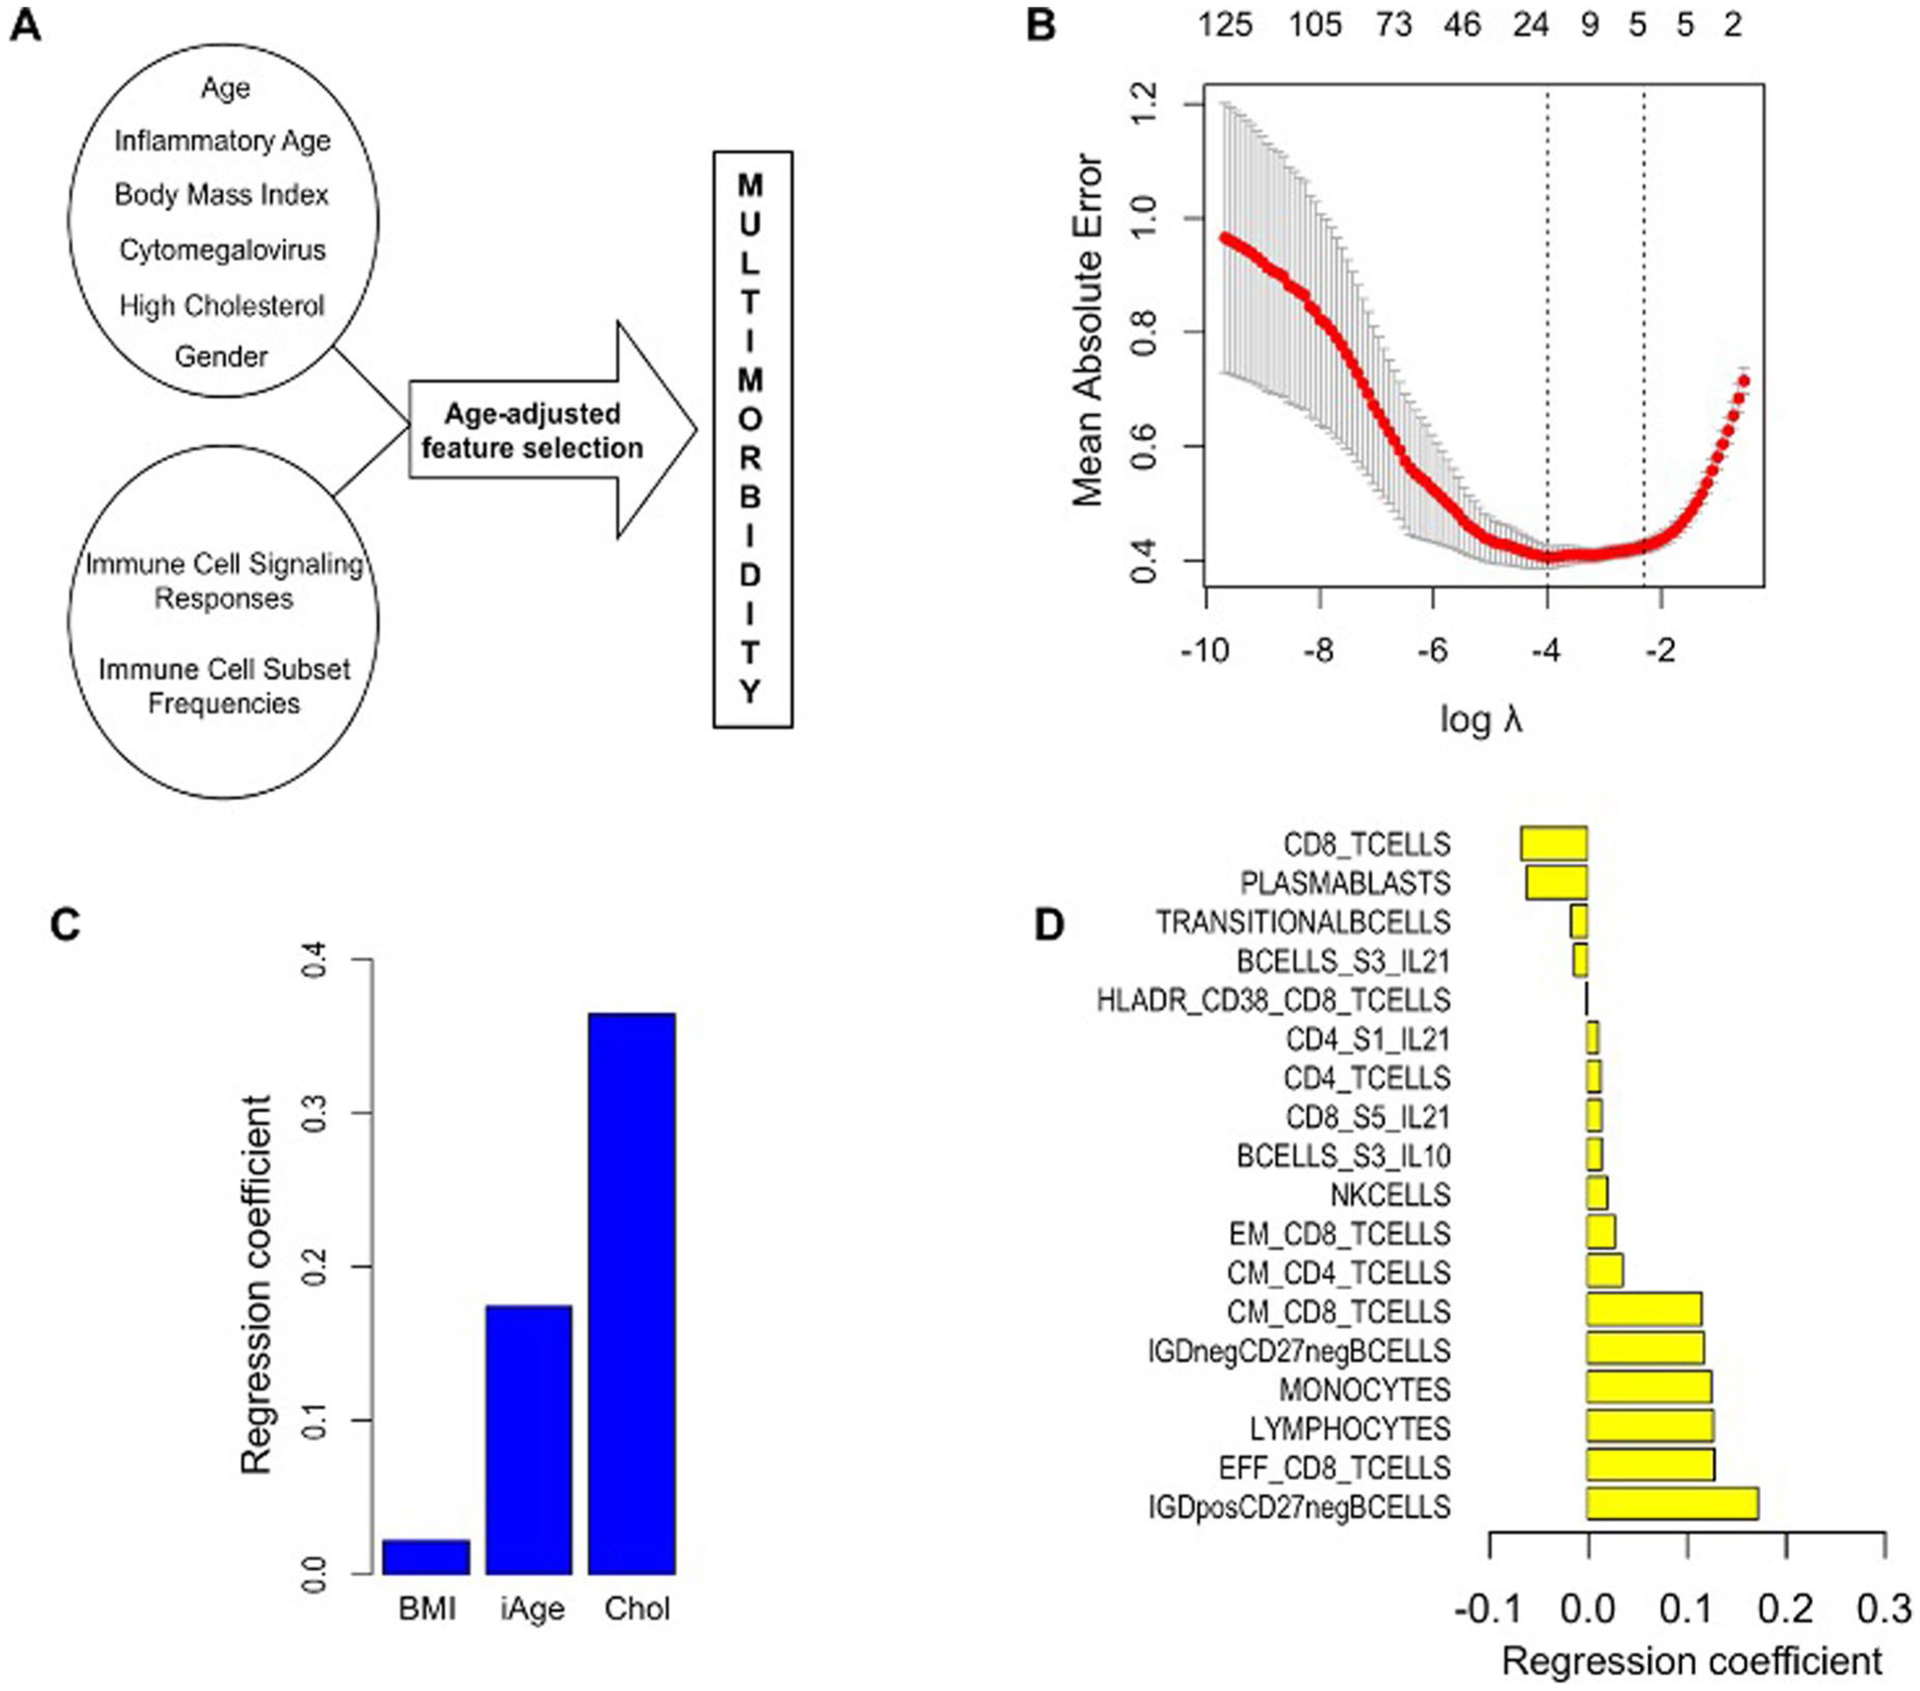
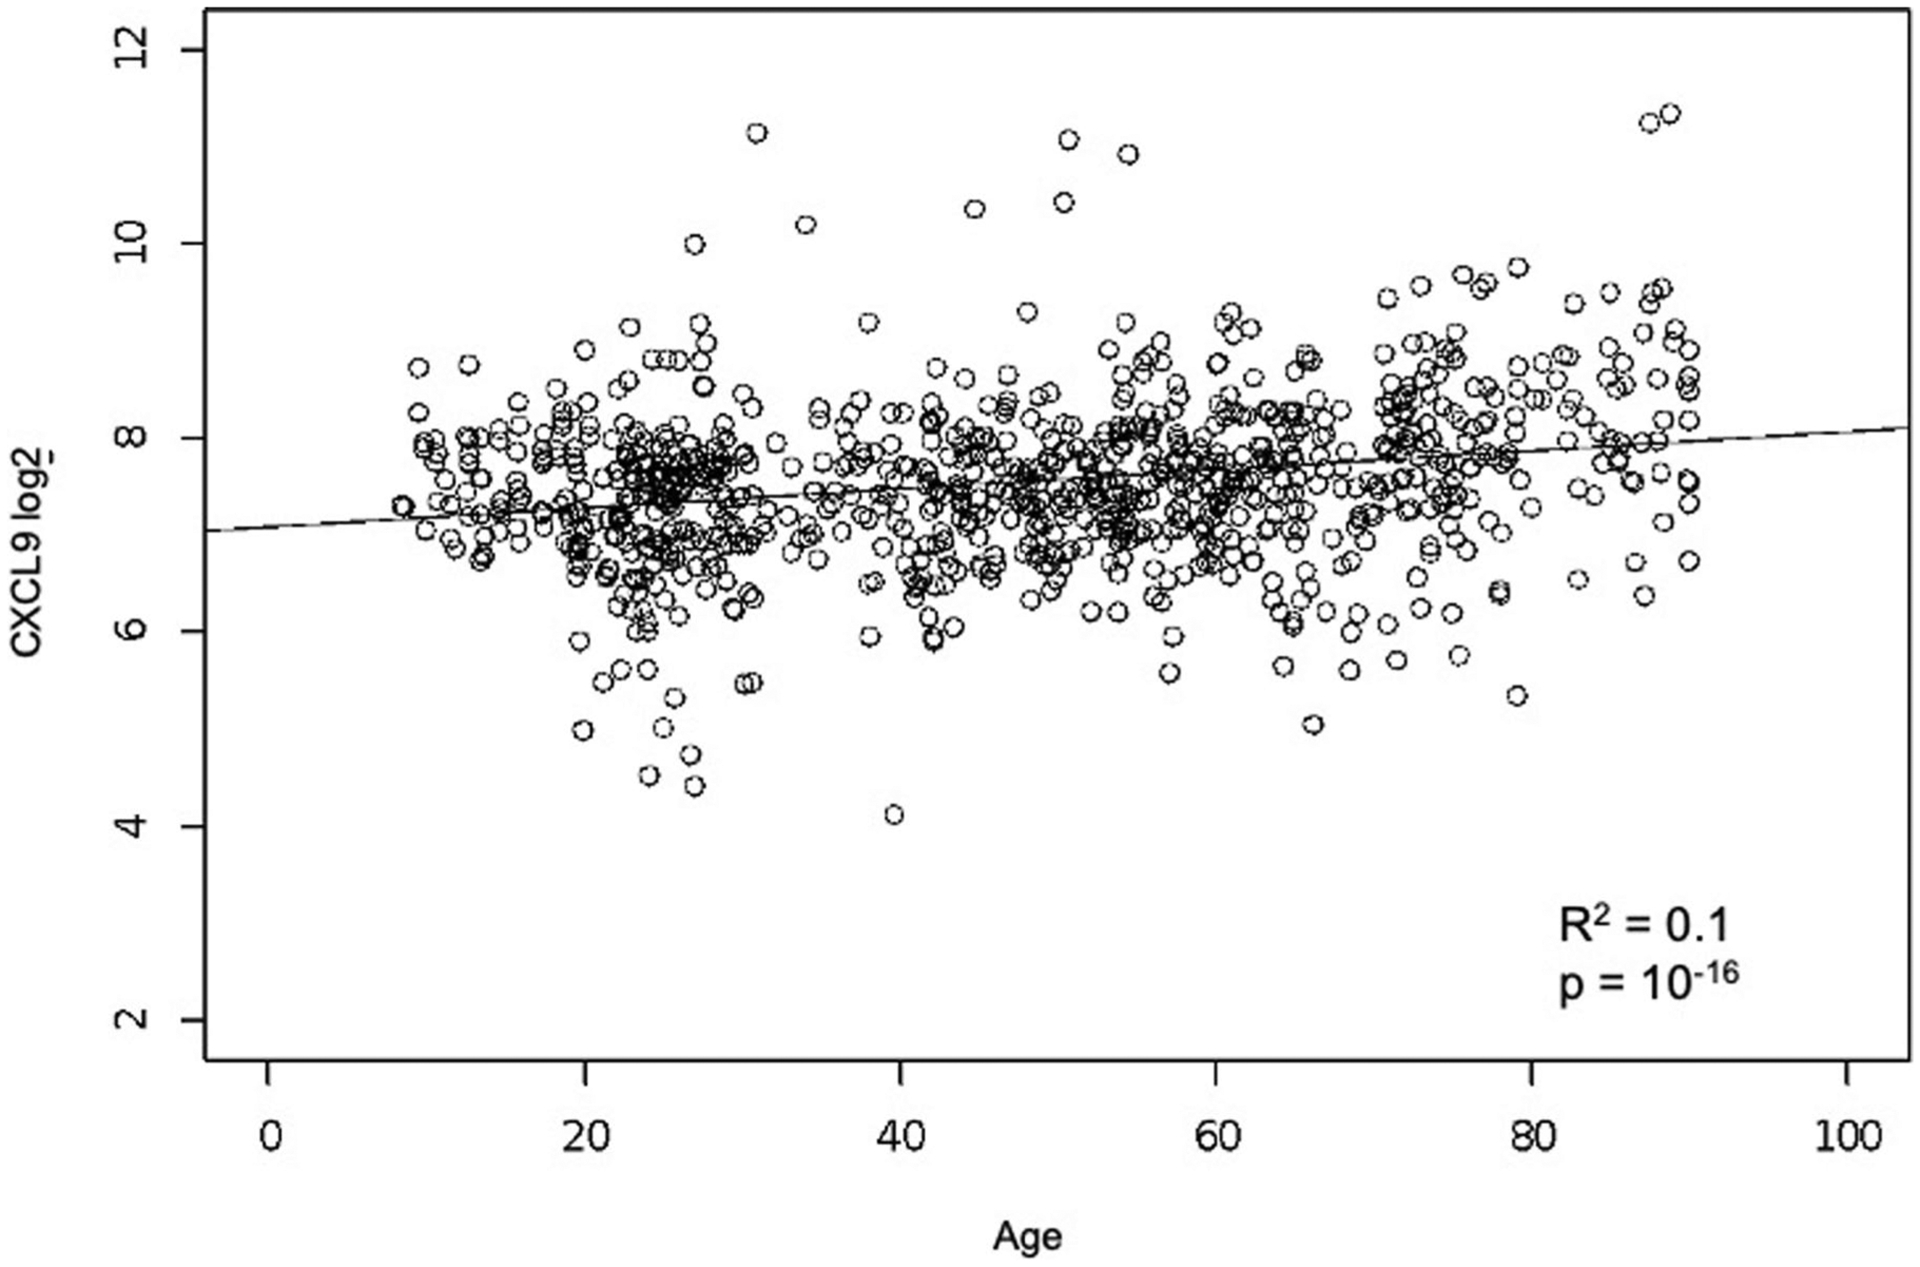
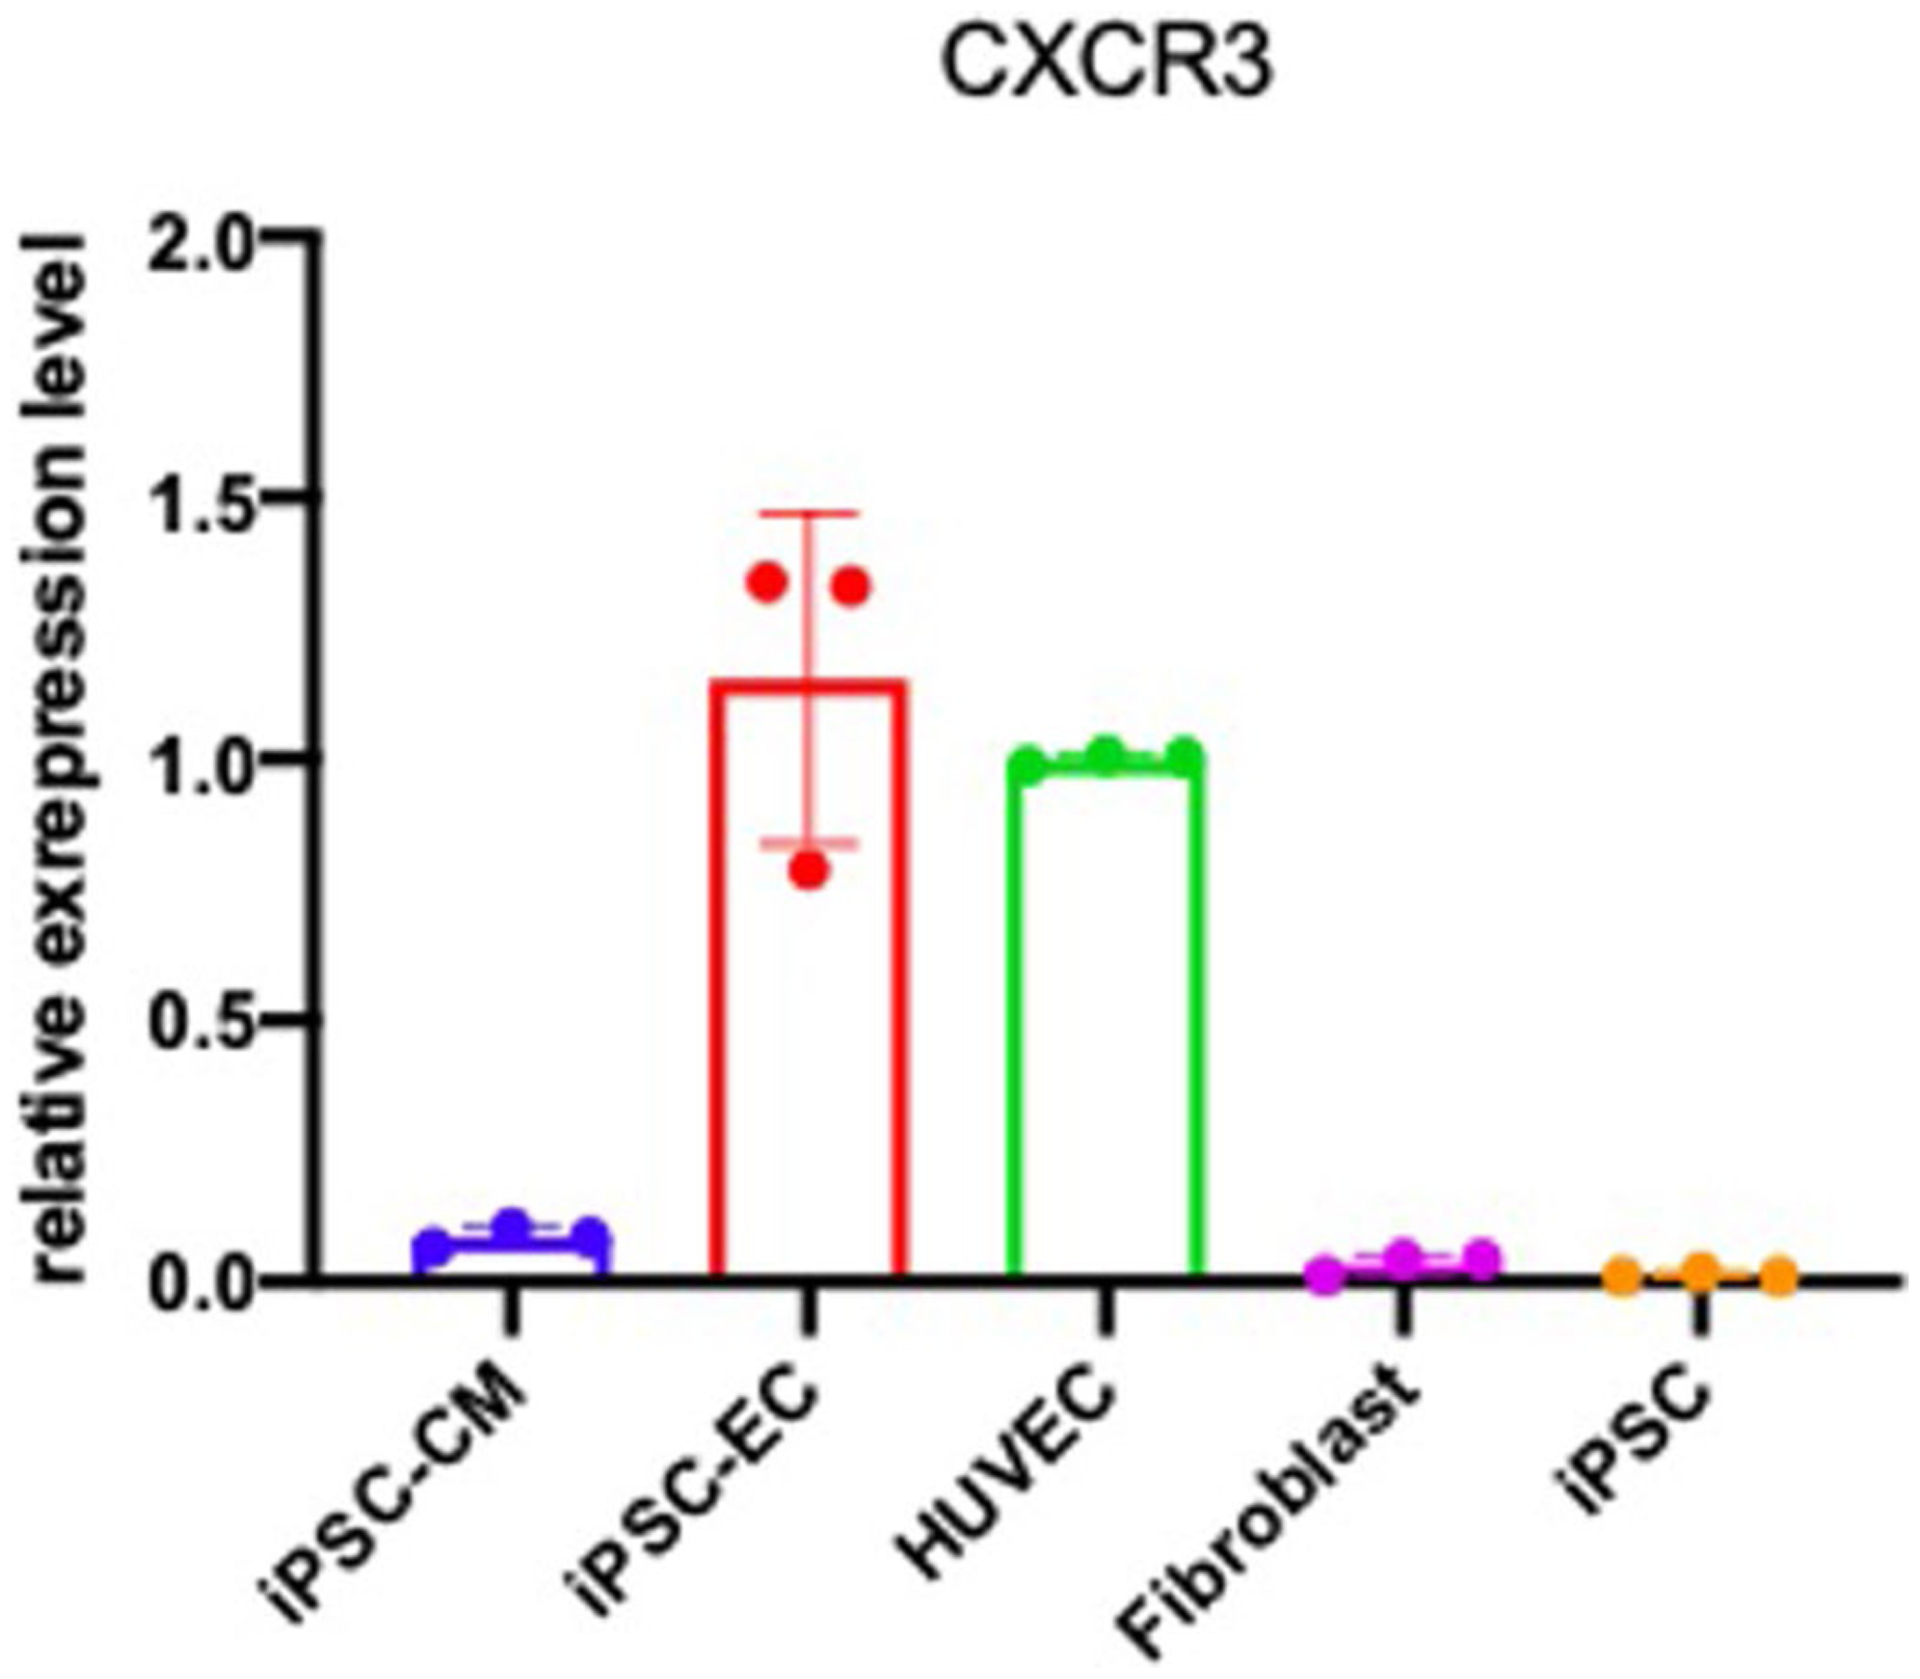
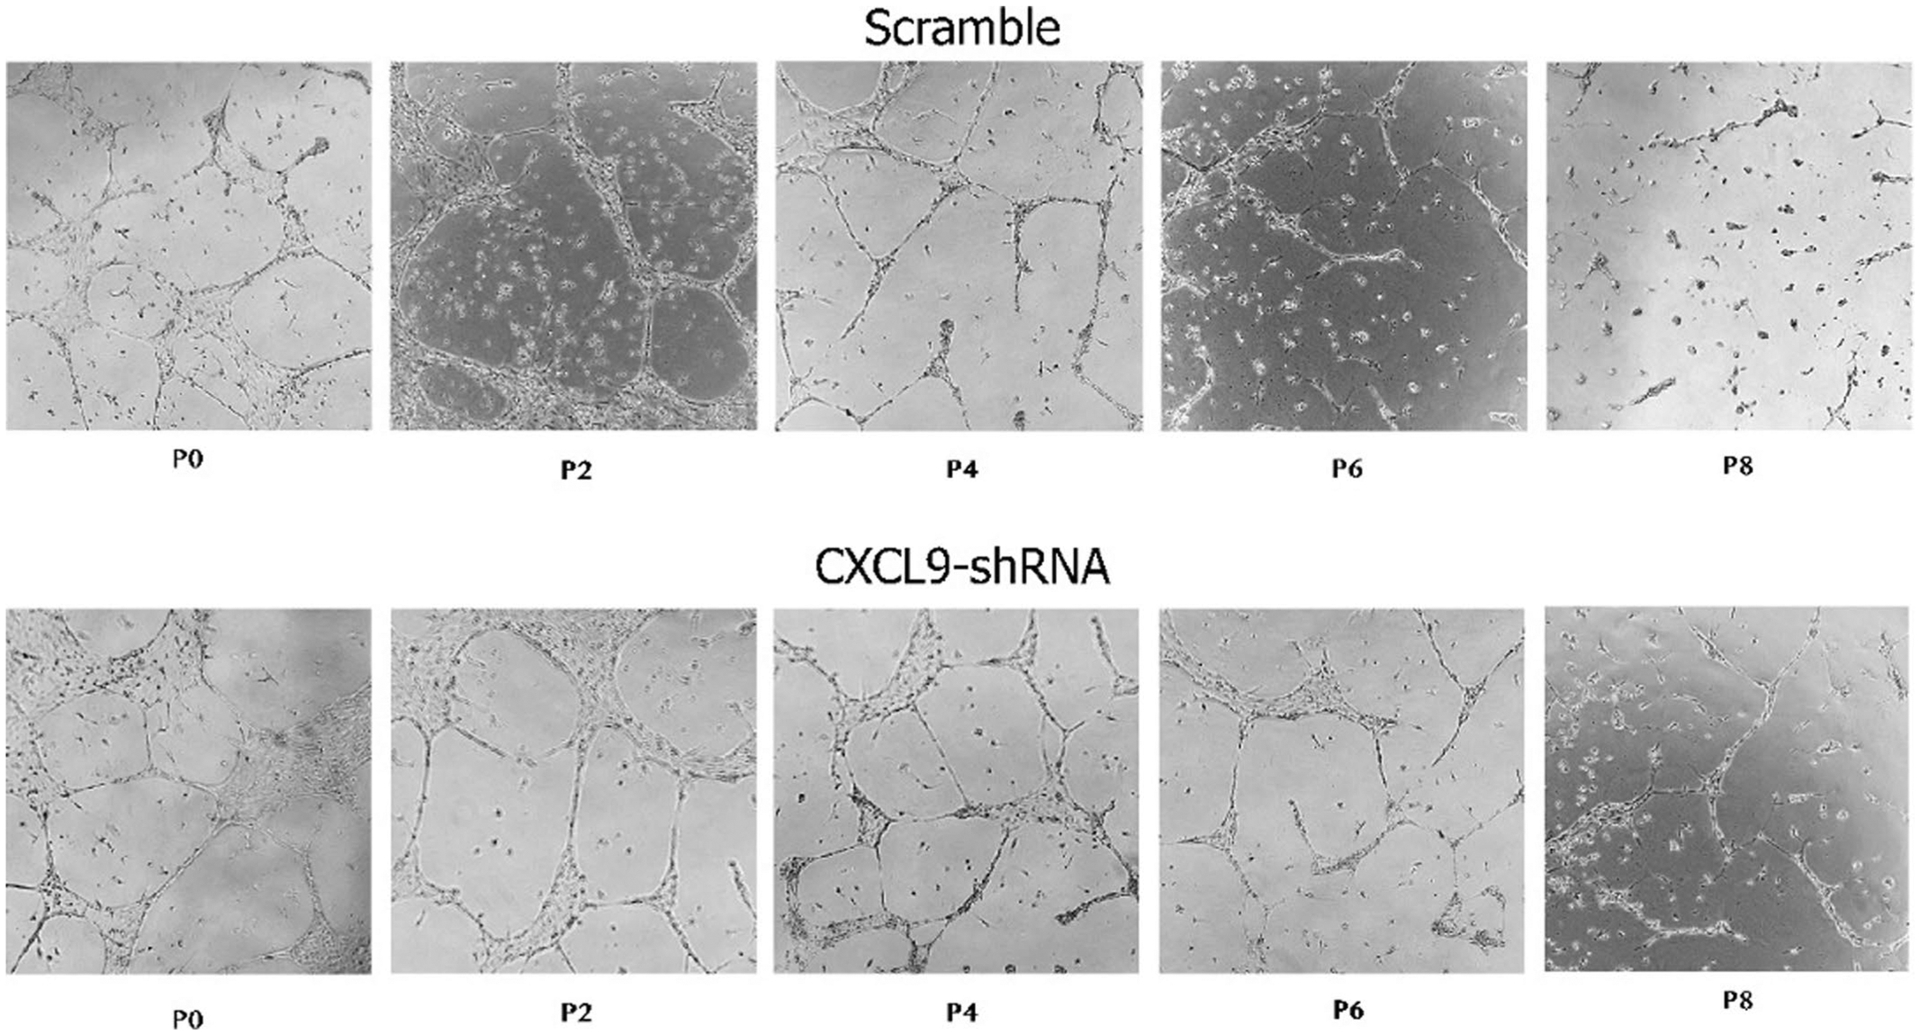
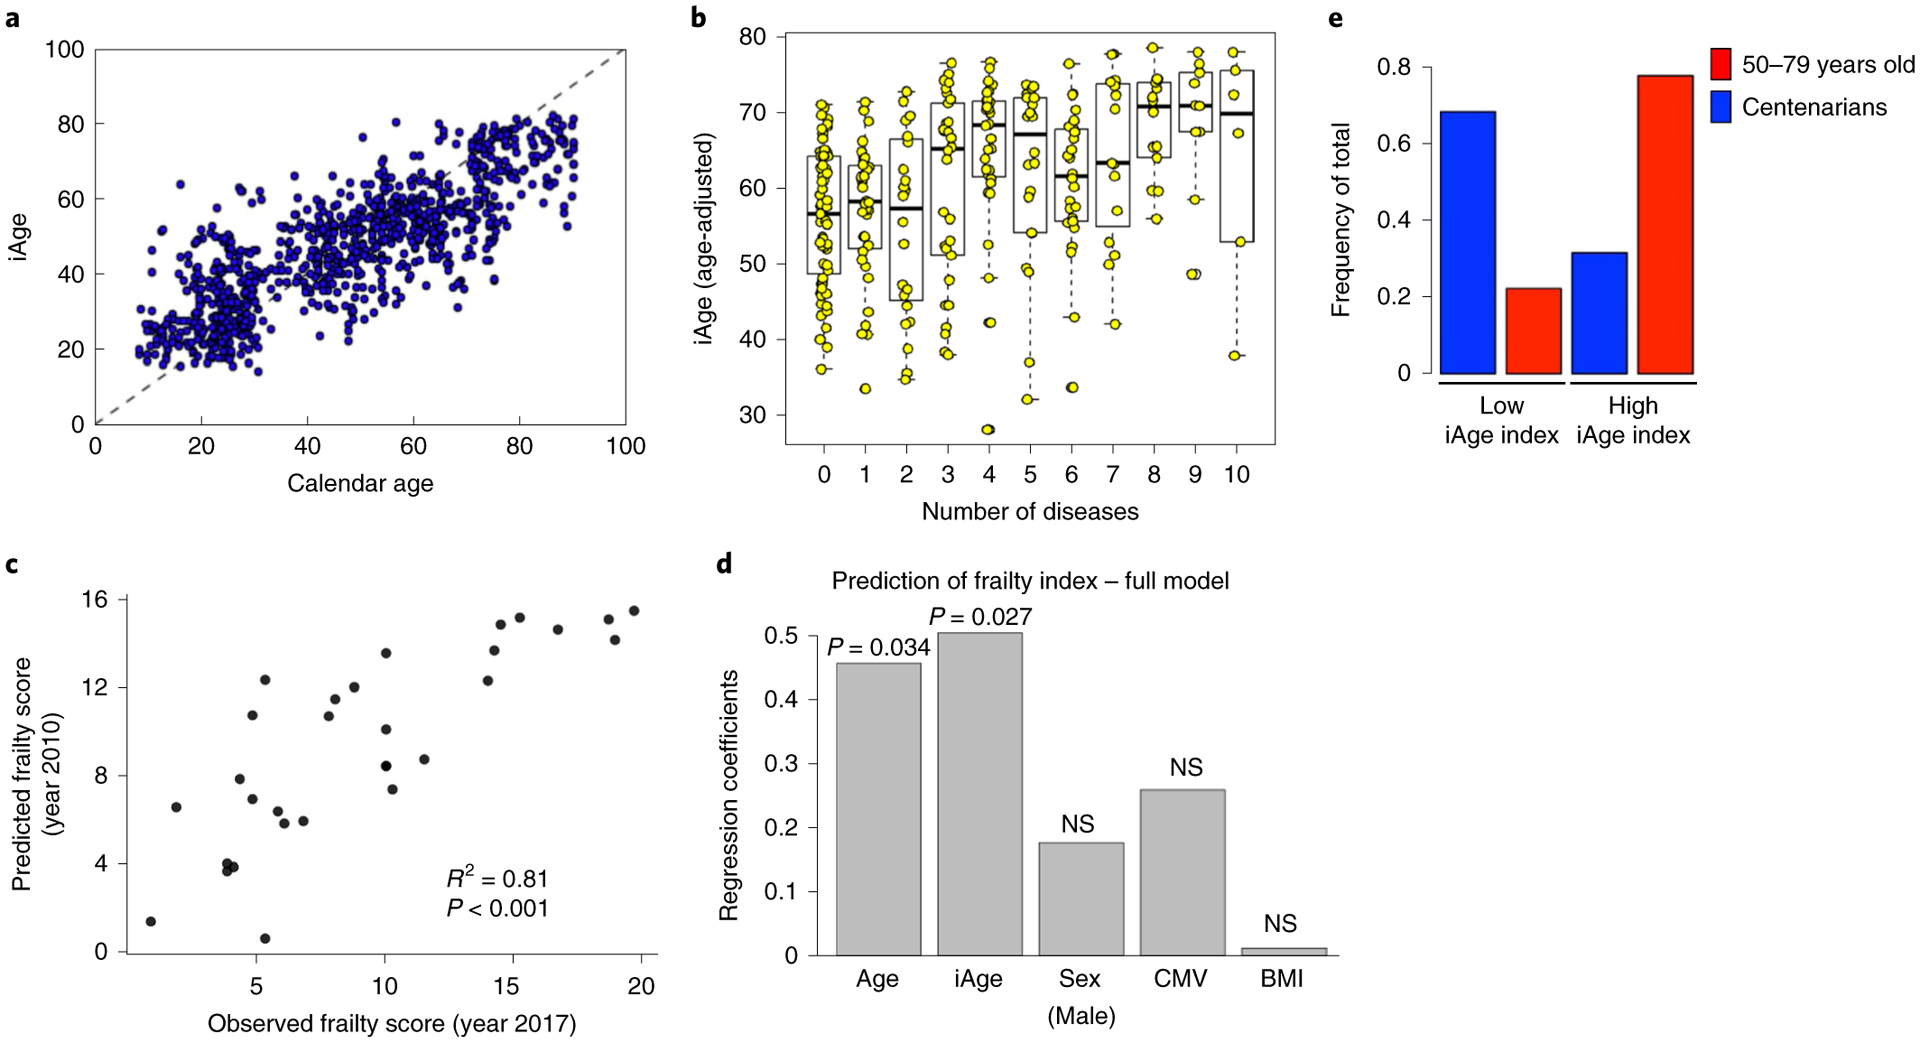
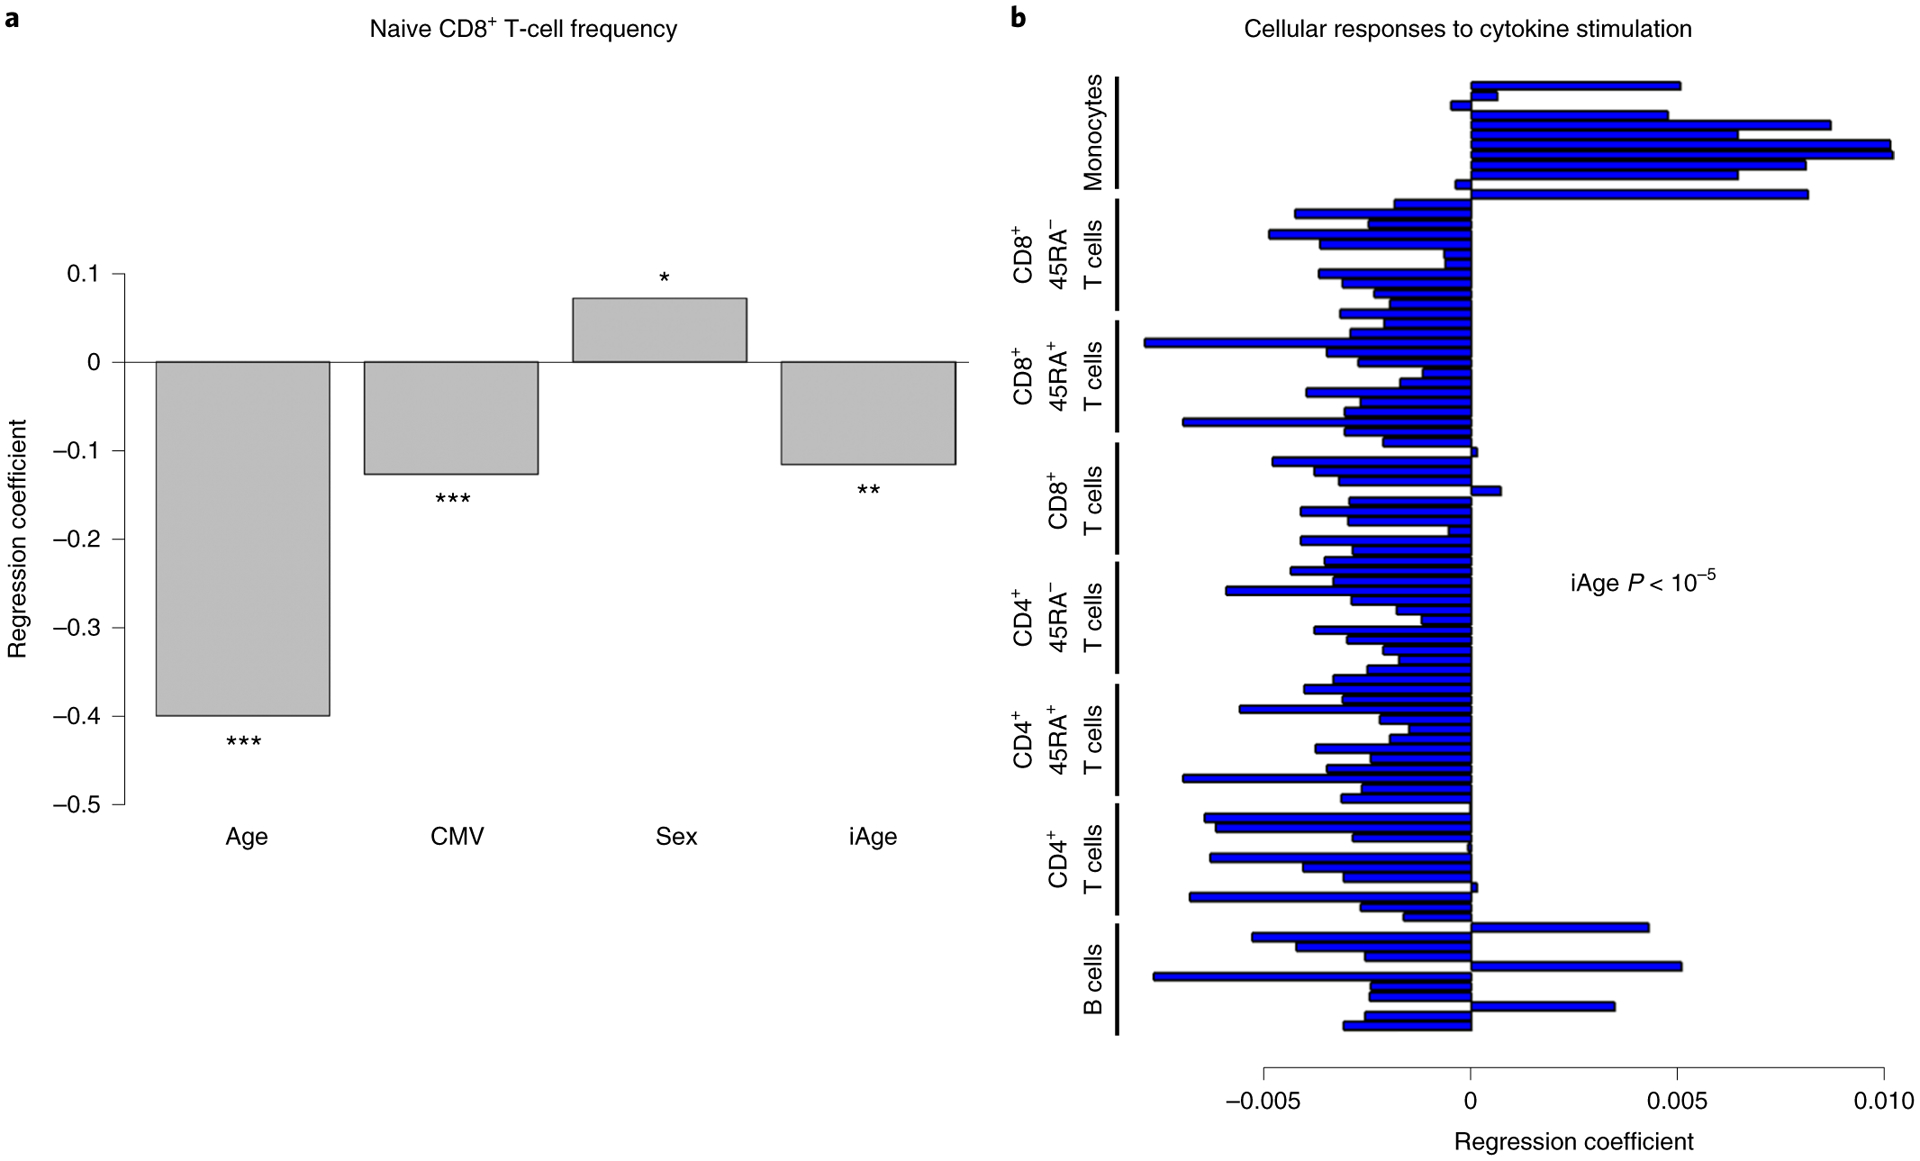
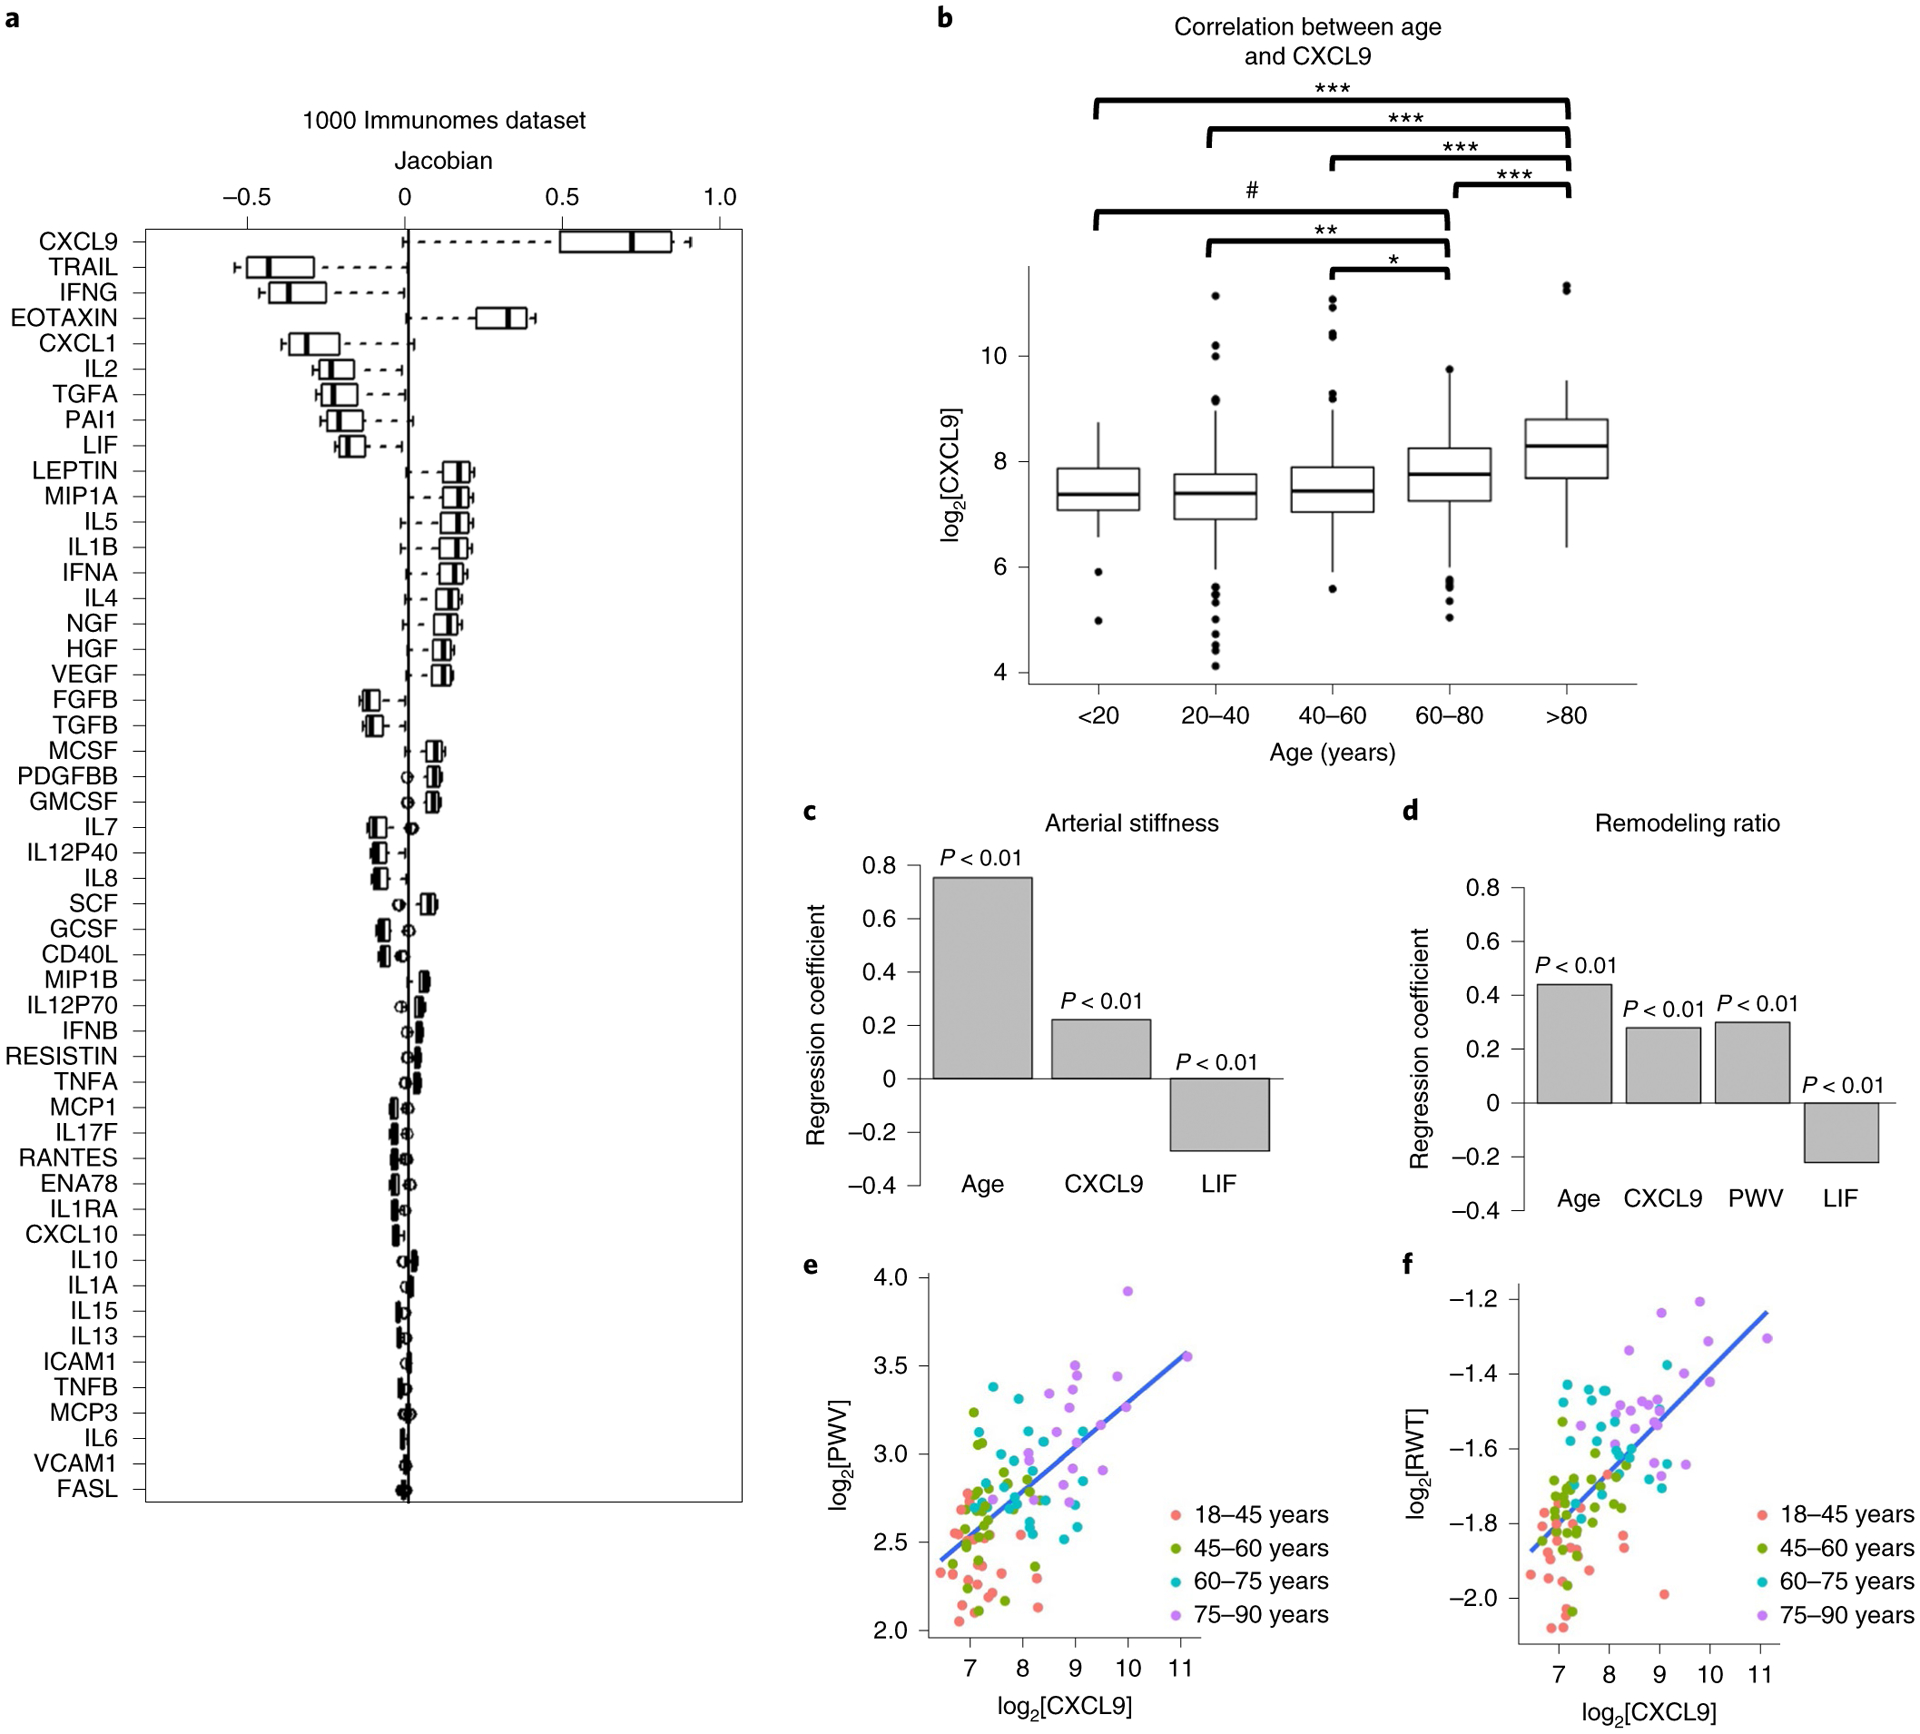
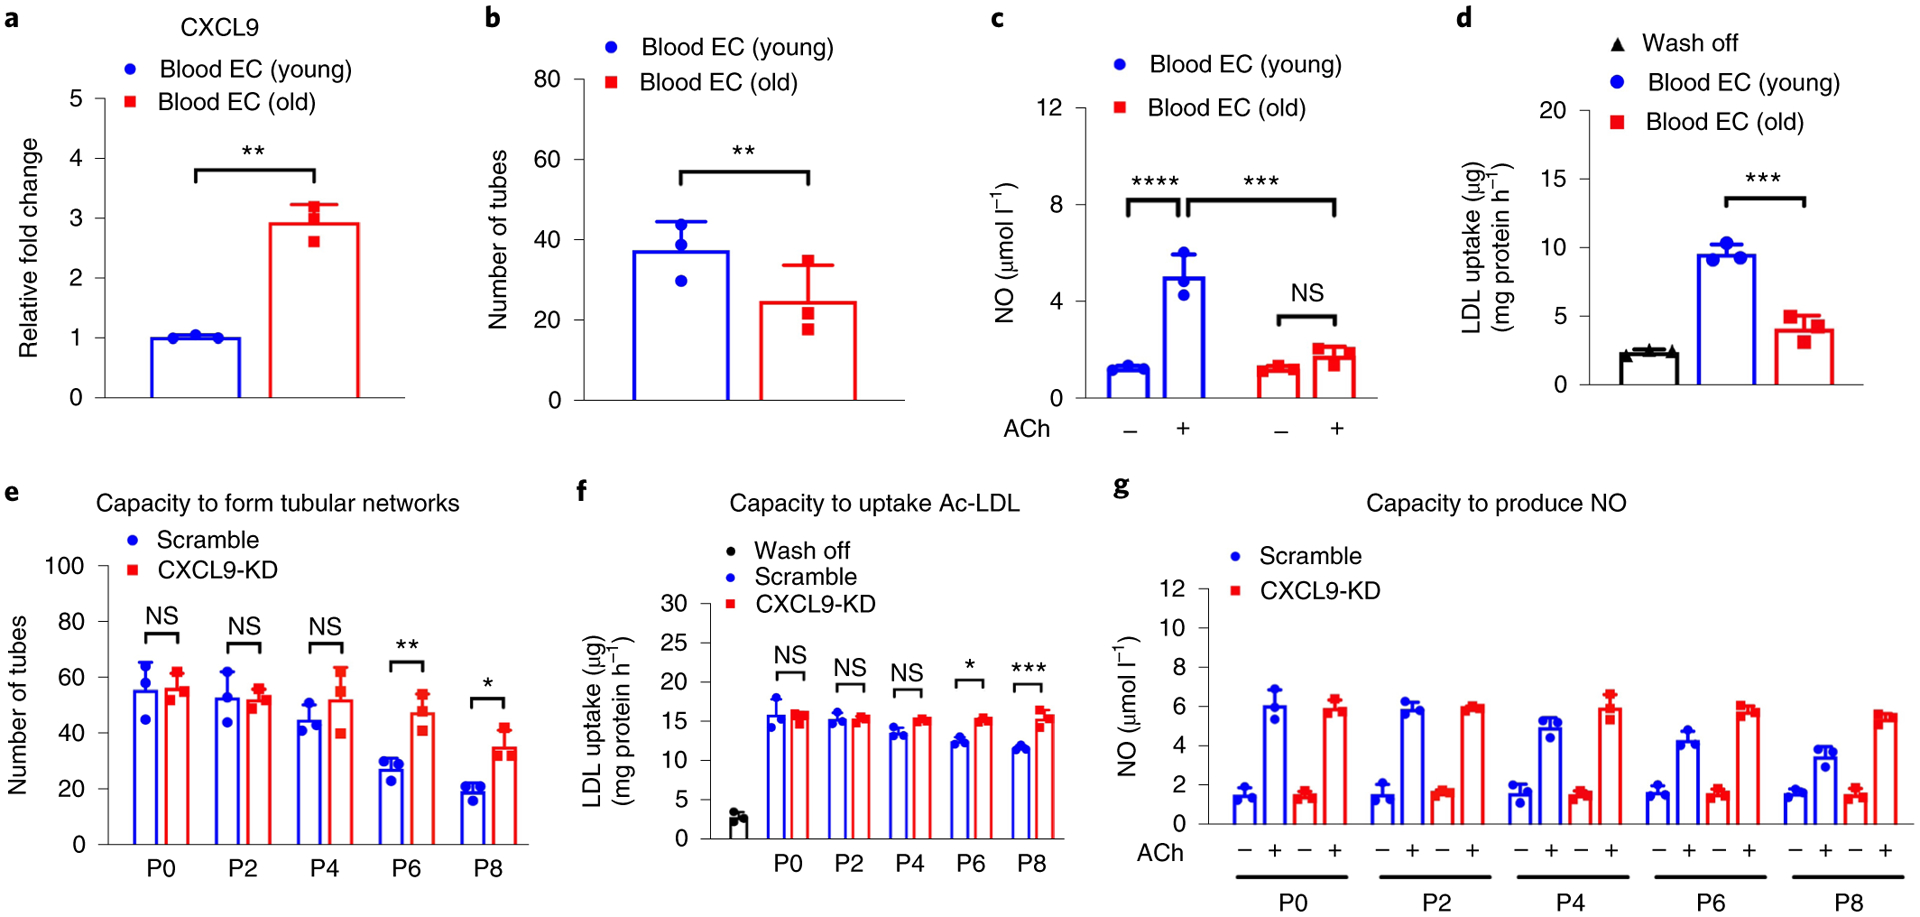
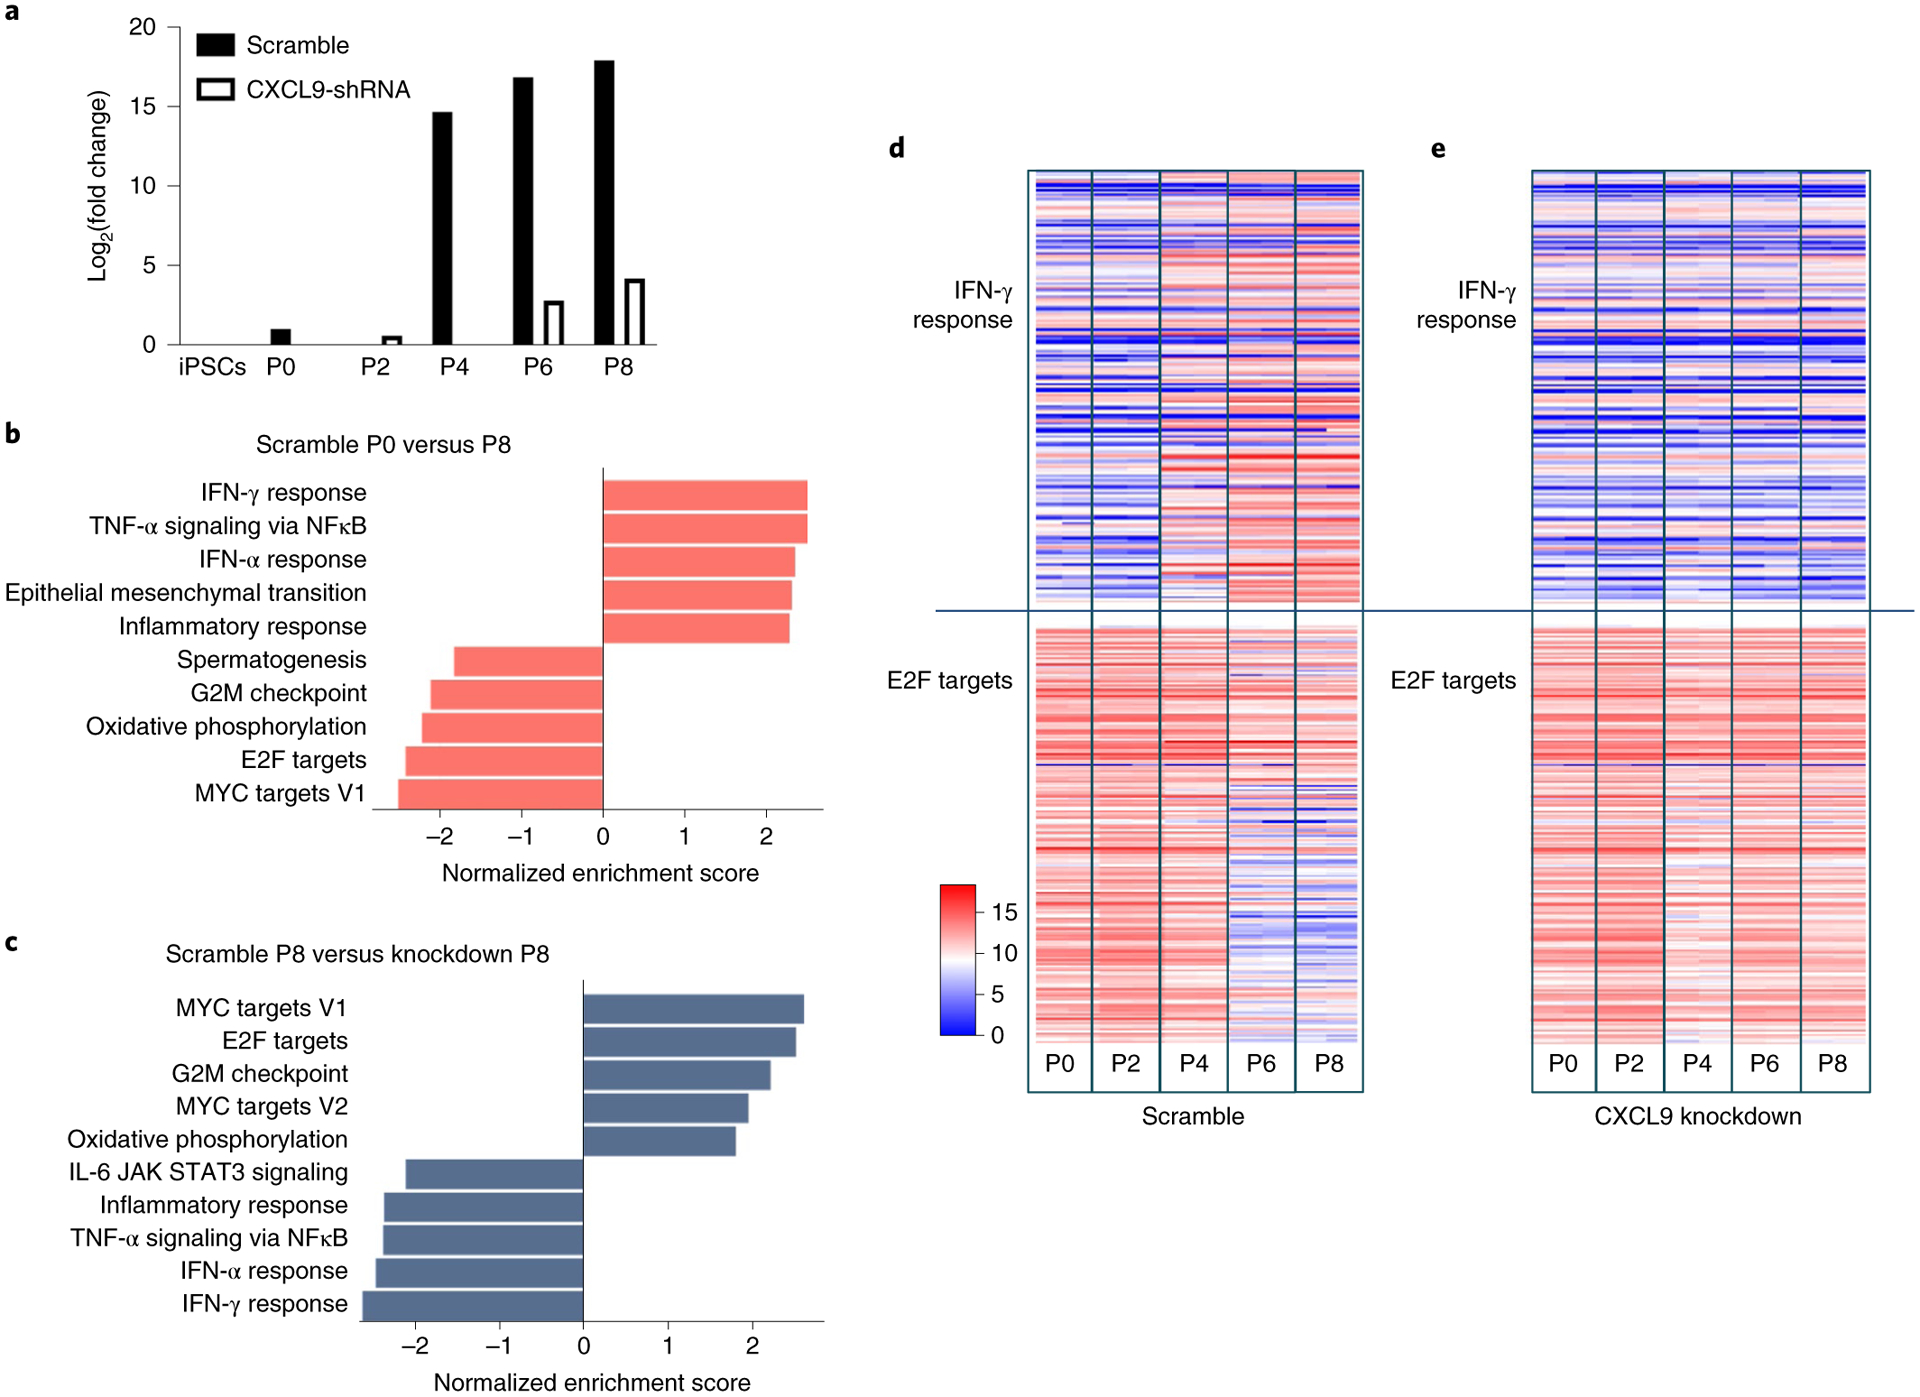
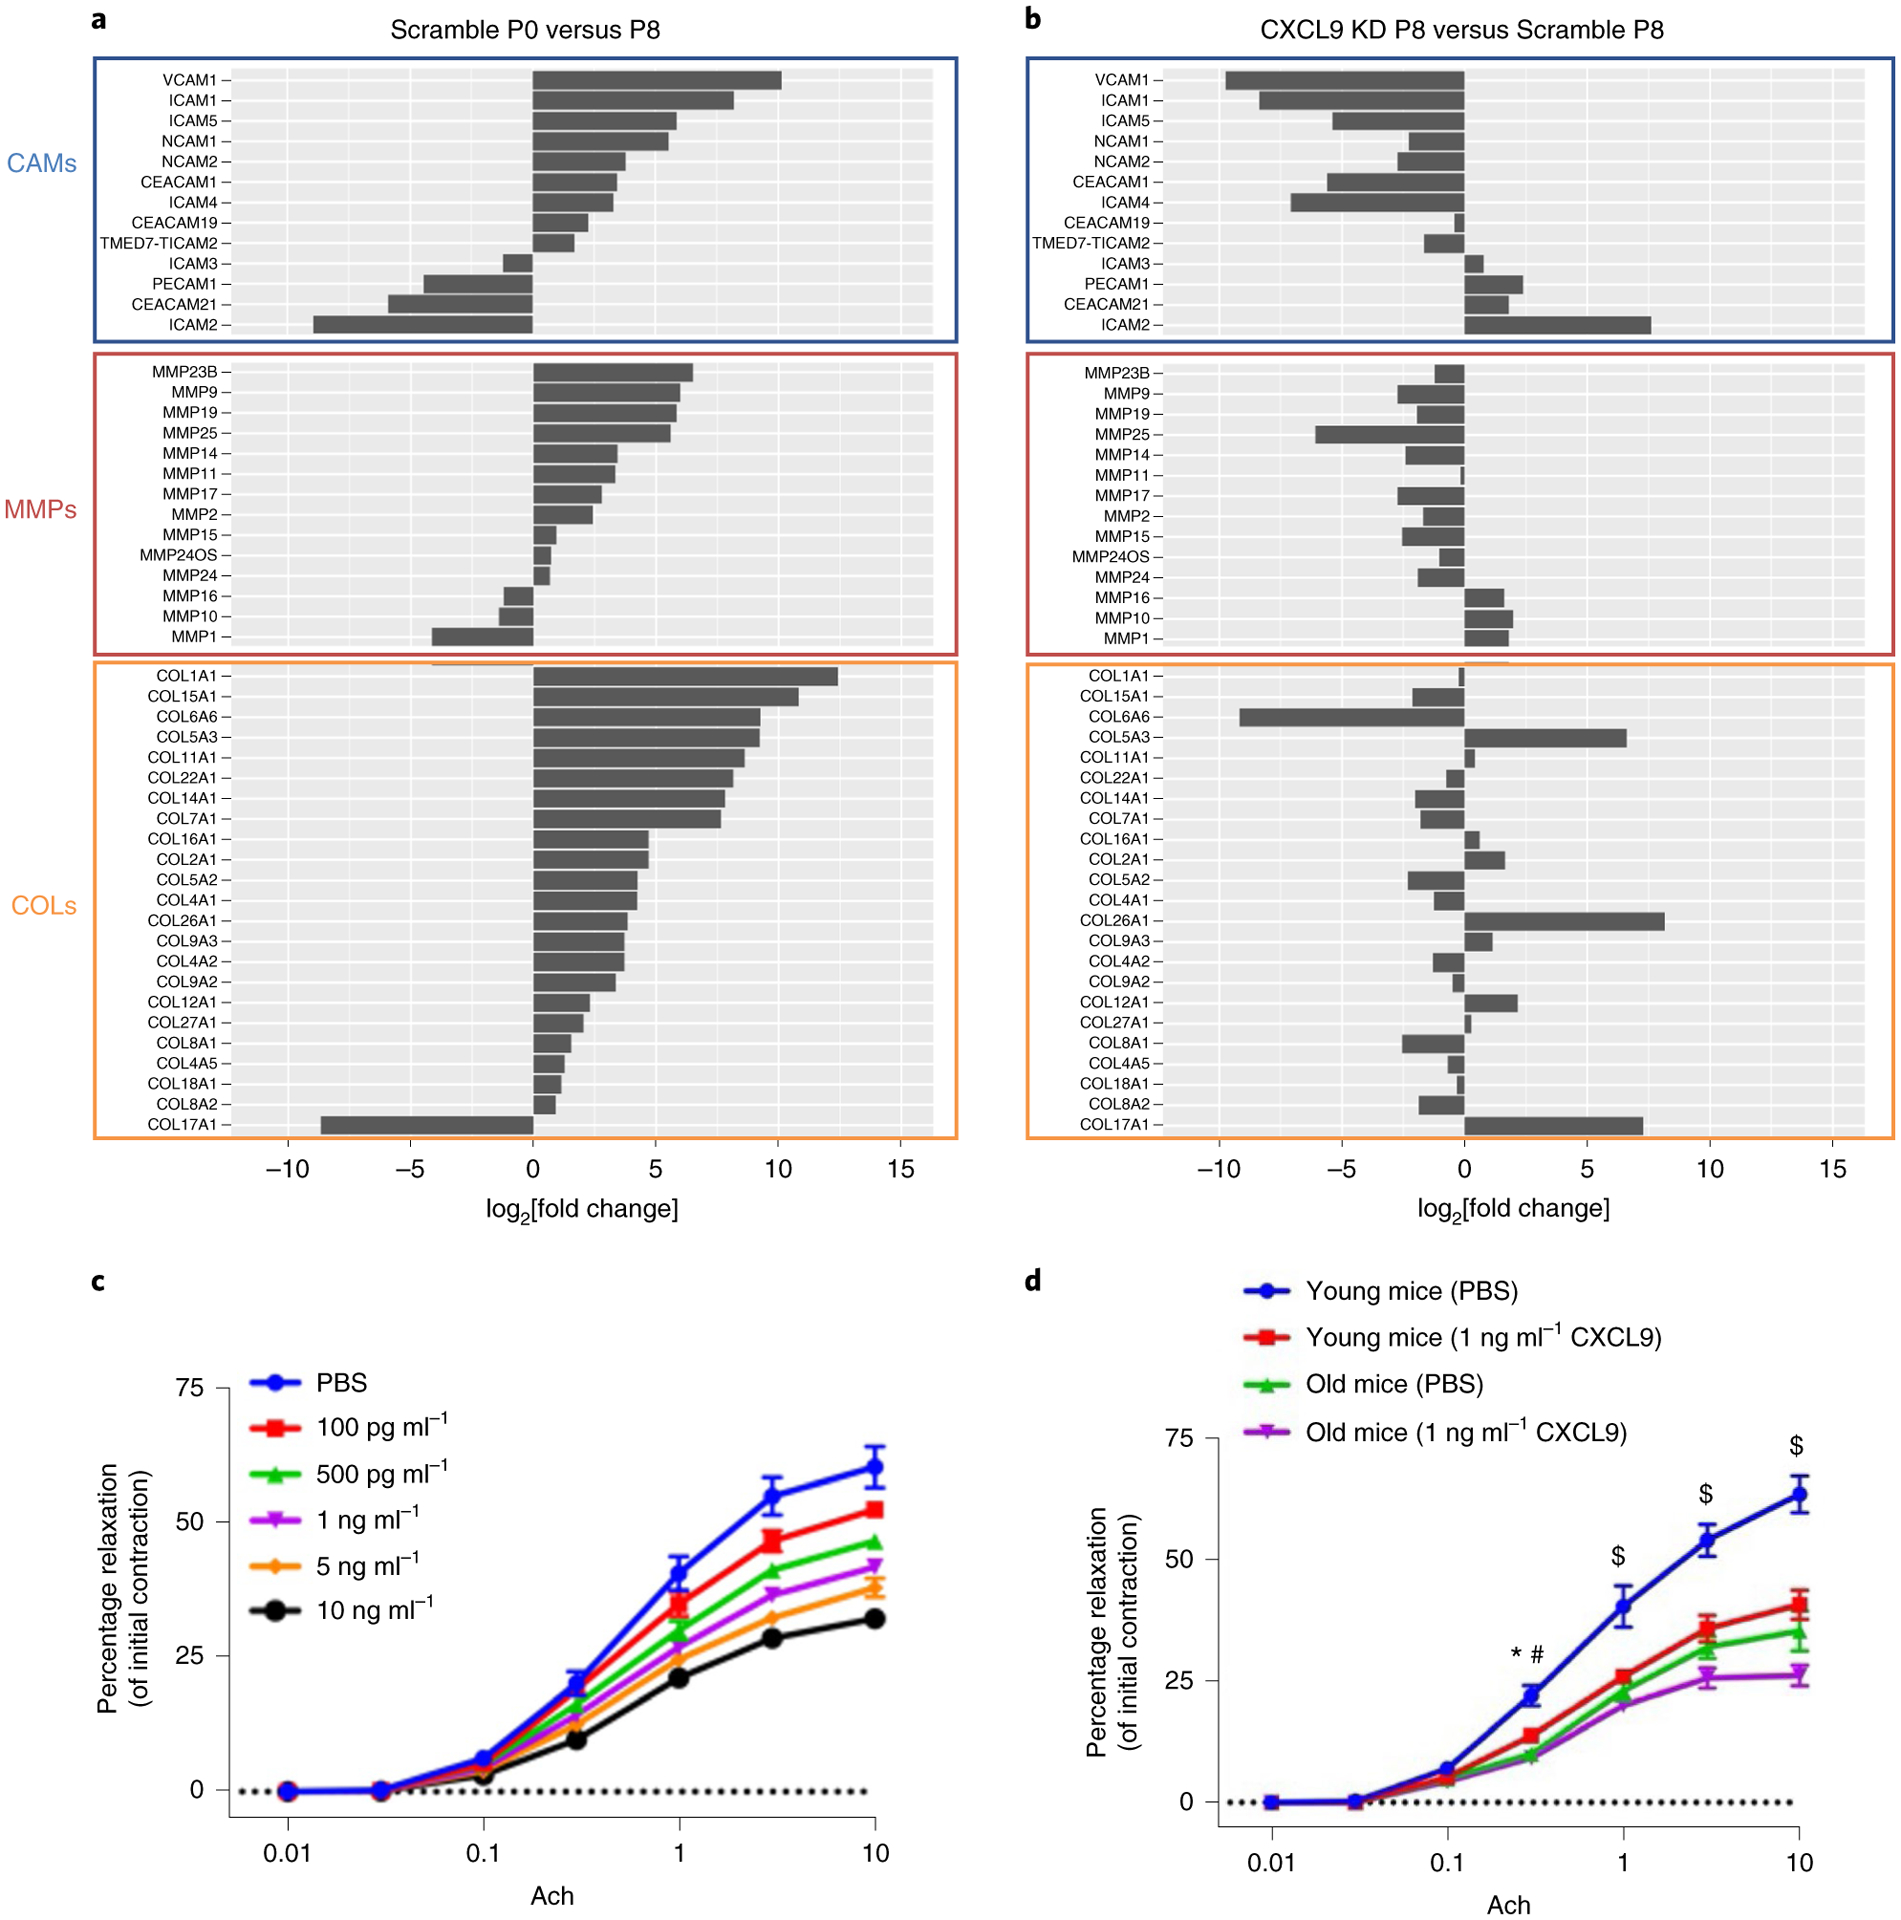
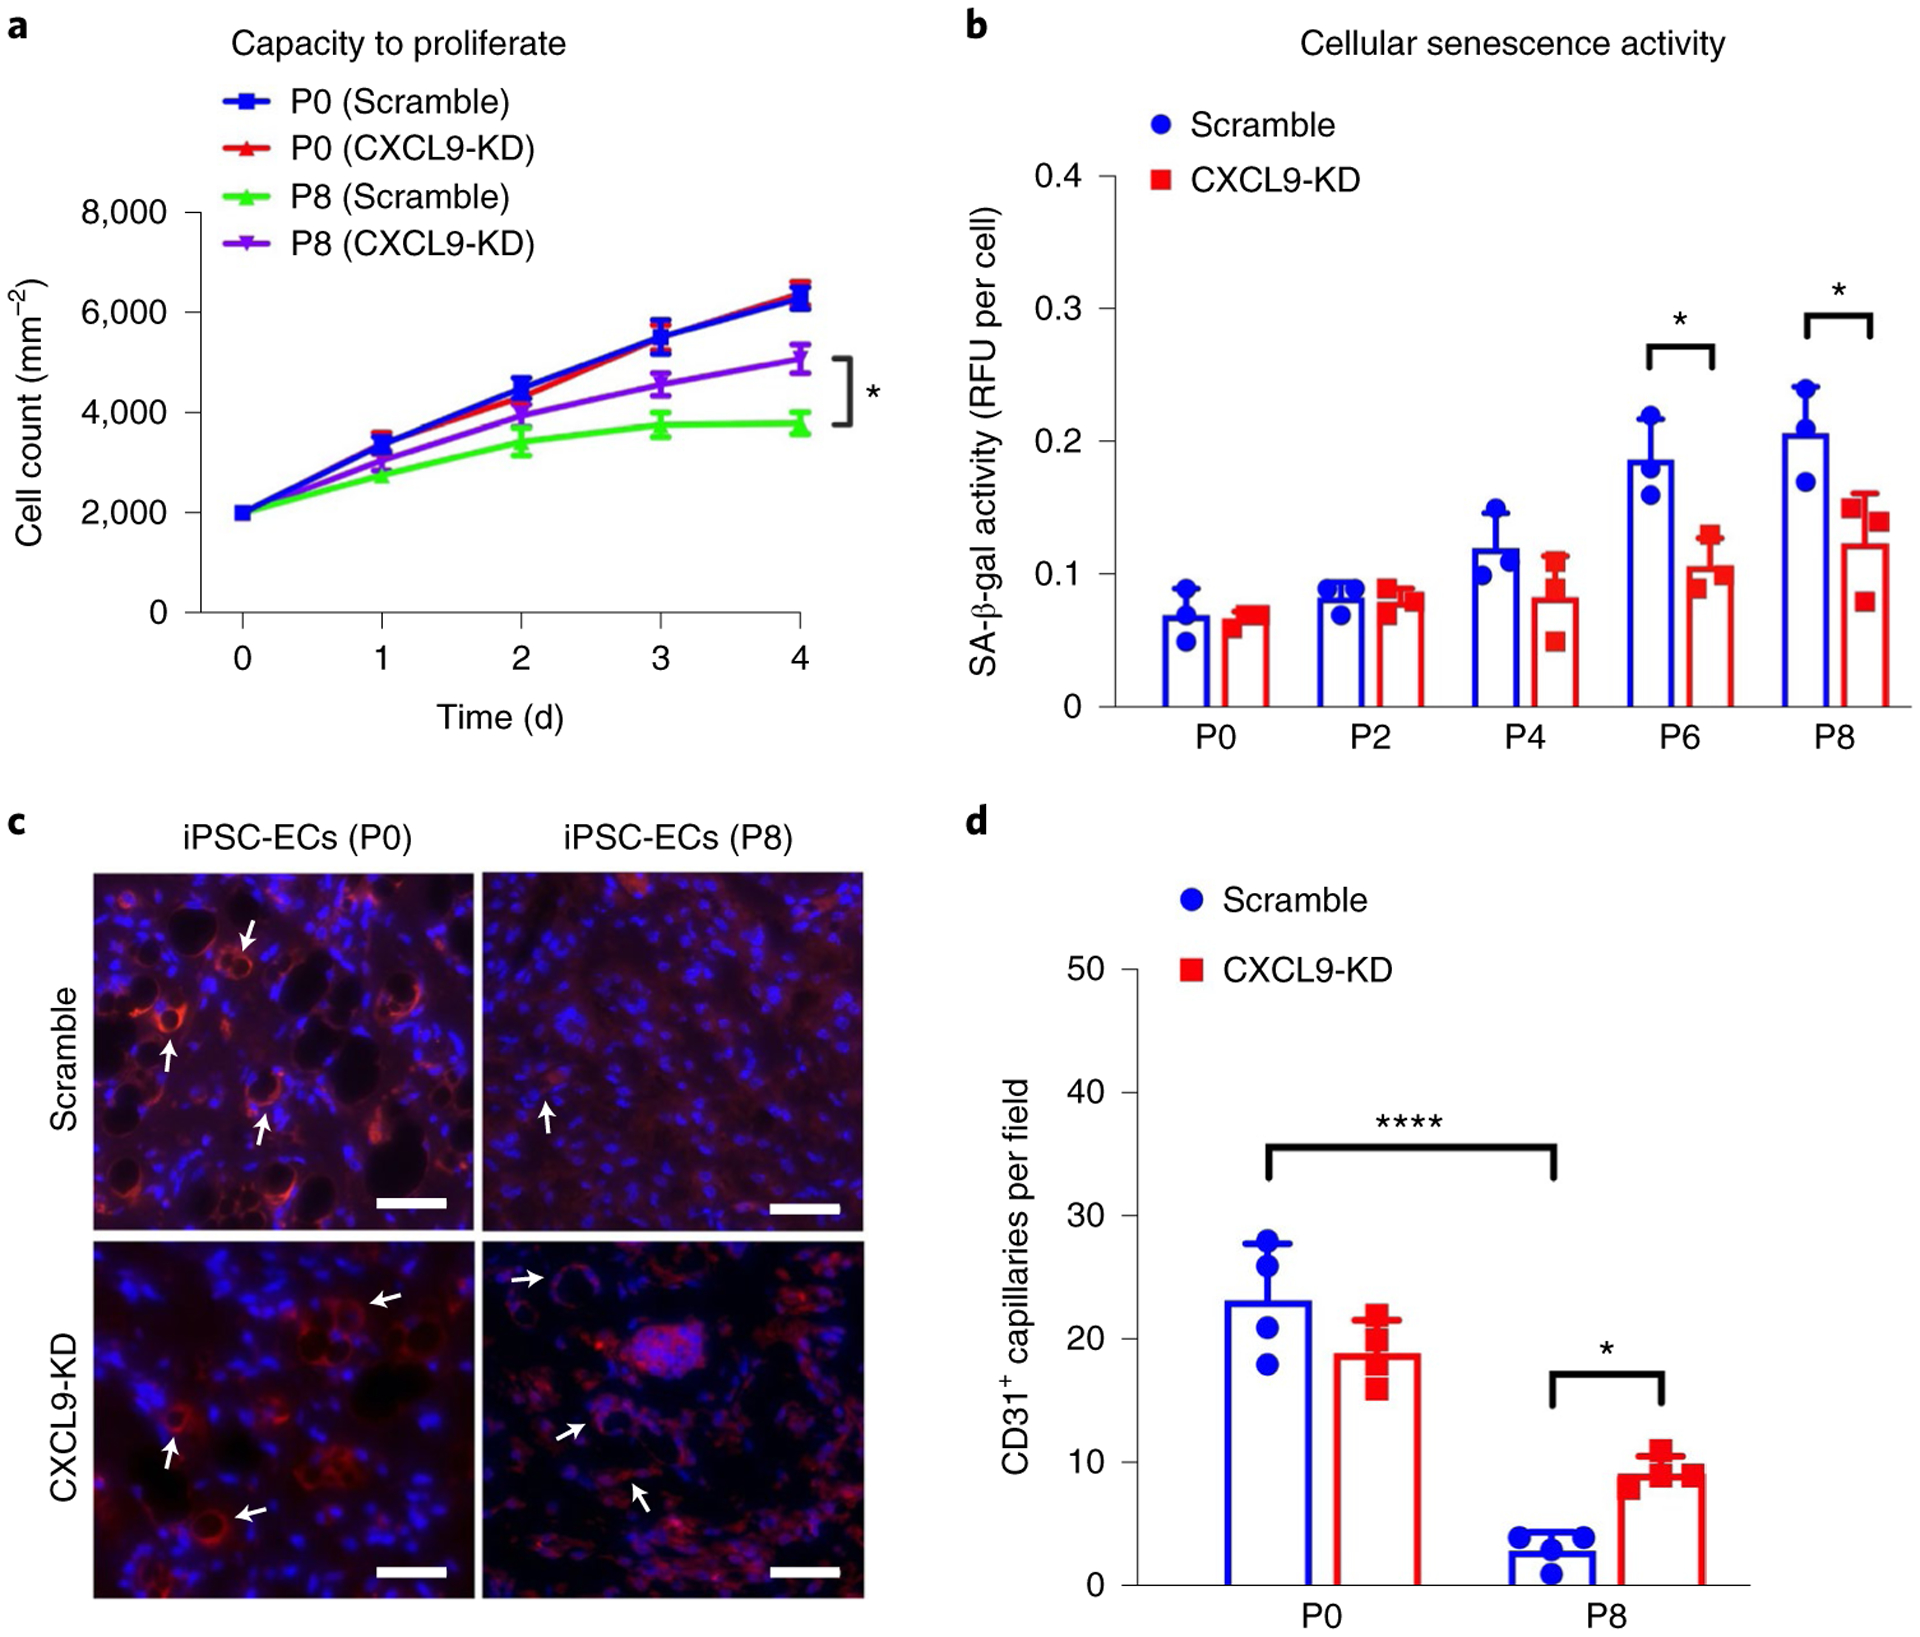
While many diseases of aging have been linked to the immunological system, immune metrics capable of identifying the most at-risk individuals are lacking. From the blood immunome of 1,001 individuals aged 8-96 years, we developed a deep-learning method based on patterns of systemic age-related inflammation. The resulting inflammatory clock of aging (iAge) tracked with multimorbidity, immunosenescence, frailty and cardiovascular aging, and is also associated with exceptional longevity in centenarians. The strongest contributor to iAge was the chemokine CXCL9, which was involved in cardiac aging, adverse cardiac remodeling and poor vascular function. Furthermore, aging endothelial cells in human and mice show loss of function, cellular senescence and hallmark phenotypes of arterial stiffness, all of which are reversed by silencing CXCL9. In conclusion, we identify a key role of CXCL9 in age-related chronic inflammation and derive a metric for multimorbidity that can be utilized for the early detection of age-related clinical phenotypes.


Conflict of interest statement

Competing interests D.F. and M.M.D. are co-founders of Edifice Health, a company that utilizes iAge. The remaining authors declare no competing interests.

Figures

Extended Data Fig. 1 |
Extended Data Fig. 1 |. 1000 Immunomes Study design: systematic analysis of immune systems via ‘OMiCS’ approaches.
The Stanford 1000 Immunomes Project consist of 1001 ambulatory subjects age 8 to 96 (34% males, 66% females) recruited during the years 2007 to 2016 for a longitudinal study of aging and vaccination, and for an independent study of chronic fatigue syndrome from which only healthy controls were included. For all samples of the Stanford 1KIP, deep immune phenotyping was conducted at the Stanford Human Immune Monitoring Center, where peripheral blood specimens were isolated and analyzed using standard procedures. Peripheral blood samples were obtained by venipuncture and peripheral blood mononuclear cells or whole blood samples were used for determination of cellular phenotypes and frequencies (N = 935) and for investigation of in vitro cellular responses to a variety of cytokine stimulations (N = 818); serum samples were obtained and used for protein content determination (including a total of 50 cytokines, chemokines and growth factors) (N = 1001). Clinical characterization was assessed via clinical questionnaire in a total of 902 subjects who completed the full set of 53 clinical items. From a total of 97 healthy young and older adults, comprehensive cardiovascular phenotyping was also conducted
Extended Data Fig. 2 |
Age distribution of the Stanford 1KIP cohort.
Extended Data Fig. 3 |
Extended Data Fig. 3 |. Estimation of the GAE code length and accuracy of age prediction.
We used 5-fold cross-validation to identify the best code length, among lengths from 1 to 10. We selected the length of code k, whose performance was not statistically significantly worse than that of longer codes (paired t-test p-value > 0.05). Within each fold we performed nested 3-fold cross-validation to select hyper-parameters (depth, weight decay and guidance-ratio). In our experiment, the best code length is 5 (a) as adding one more code (6) does not significantly improve the total loss (p = 0.18). After obtaining the best code length as 5, we used the 5-fold-cross-validation to select the best hyper-parameter setting (depth = 2, guidance-ratio = 0.2, L2 = 0.001) on all GAE with code length 5. Finally, we trained the GAE on the whole dataset with the selected best hyper-parameter setting and obtained the predictive function as the inflammatory clock predictor. GAE was compared to other machine learning methods such as autoencoder, neural networks, PCA, and RAW in (b). For the neural network, 2 fully connected layers with 5 nodes in each layer and tanh activation function were used. For PCA and RAW, we used elastic net to predict age. The GAE method outperforms linear methods for protein data reconstruction and prediction of chronological age (b). In (c), we found that the predictive performance of gradient boosting decision tree (GBDT) has similar performance as PCA. We conclude that GAE is superior to traditional machine learning methods.
Extended Data Fig. 4 |
Extended Data Fig. 4 |. Elimination of batch effect for serum immune protein data. .
Immune protein data from serum samples were subjected to normalization and batch correction procedures (See Methods) to ensure data from different sources can be combined and used as a whole. a, Spearman correlation between immune protein features and batch ID shows a strong dependency of data source on top 4 components (raw data, green line), which reaches a steady state after component 5. Data normalization and batch correction removes batch effect as indicated by lower mean absolute Spearman correlation between all features and batch id (blue line), which indicates impossibility to distinguish sample source from corrected data. b, Upper panel: immune protein expression heatmap of uncorrected data, Lower panel: immune protein expression heatmap of corrected data. The two batches come from two study cohorts, the Chronic Fatigue Syndrome Study (CFS) and Aging and vaccination study cohort (Flu).
Extended Data Fig. 5 |
Extended Data Fig. 5 |. iAge predictive of multi-mordity.
To select for predictors of comorbidity without bias, based on available data for all 902 subjects while controlling for the age effect, age-adjusted cross-validation was performed (a). By applying differential penalty values for each regressor, age variable is ‘forced in’, while imposing a stringent penalty (the lasso penalty) to all other features, so that selected variables do not correlate with age. A Mean Absolute Error (MAE) for the prediction of comorbidity of 0.41 is observed (b). Eighteen features are selected including inflammatory clock, high cholesterol and BMI (c) and immune parameters such as total CD8 (+) T cells, plasmablasts and transitional B cells (negative predictors) and IgD+CD27- and IgD-CD27-B cells, effector CD8 (+) T cells, total lymphocytes and monocytes, and central memory T cells (positive predictors) (d)
Extended Data Fig. 6 |
Extended Data Fig. 6 |. Univariate Regression between Age and CXCL9.
Significant correlation between age and CXCL9 using univariate regression analysis. We used linear regression where CXCL9 were regressed onto age. Correlation coefficient (R2) and p-value of F-test of overall significance are reported.
Extended Data Fig. 7 |
Extended Data Fig. 7 |. Luminex data for cardiovascular validation cohort.
In a validation study, 97 healthy adults (aged 25–90) well matched for cardiovascular risk factors, were selected from a total of 151 recruited subjects. Immune protein analysis was conducted in samples from these subjects. CXCL9, HGF, CXCL1, and LIF were found to change in the same direction in both the Stanford 1KIP and the validation cohort.
Extended Data Fig. 8 |
Extended Data Fig. 8 |. Human blood endothelial progenitor cells and mice endothelial cells.
a, Representative images of human blood progenitor endothelial cells from young (left) and old (right) individuals. b, Representative images of capillary-like networks show impaired tube formation by human BECs of old individuals compared to young. To further confirm the potential contribution of CXCL9 in cardiovascular aging, we assessed its expression in young (3–4 month) and old mice (2 yr.) endothelial cells (c). ECs isolated from old mice showed higher levels of CXCL9 (P value = 0.023) (d), while at the same time showed impaired EC function as evident by decreased tube formation (P value = 0.042) (a, f). Figure S8: All data represented as mean ± SEM, n = 3, *P < 0.05. Statistical analyses were performed using Student’s t-test (paired). Scale bar: 50 μm.
Extended Data Fig. 9 |
Extended Data Fig. 9 |. Expression of CXCR3 RNA in different tissue types.
CXCR3 was not expressed in iPSC induced cardiomyocytes (iPSC-CM), Fibroblast, or iPSC. However, it is highly expressed in iPSC induced endothelial cells and Human Umbilical Vein Endothelial Cells (HUVEC). All data represented as mean ± SEM.
Extended Data Fig. 10 |
Extended Data Fig. 10 |. Validation of the effects of CXCL9 on endothelial function.
Representative images of capillary-like networks from scramble- and CXCL9-KD hiPSC-ECs show that CXCL9-KD hiPSC-ECs retain their capacity to form tubes even at later passages when compared to scramble that showed impaired tube formation towards later passages of hiPSC-ECs. Scale bar: 50 μm. Experiment was repeated 3 times.
Fig. 1 |
Fig. 1 |. The inflammatory clock of aging tracks with multimorbidity, frailty and exceptional longevity.
a, Using a GAE method on 50 circulating immune proteins, we derived iAge to predict cAge. Ten age-related disease items were selected to characterize the clinical significance of iAge. The items analyzed included different diseases and physiological systems: cancer, cardiovascular, respiratory, gastrointestinal, urologic, neurologic, endocrine–metabolic, musculoskeletal, genital–reproductive and psychiatric. All these disease features were binary. b, After adjusting for covariates, iAge was significantly correlated with multimorbidity in the older population analyzed (>60 years old, n = 285) (boxes represent 25th and 75th percentiles around the median (line); whiskers represent 1.5× interquartile range). c, For a subset of older adults (n = 29), frailty was assessed in 2017 using a modified frailty score (Methods). iAge measured in 2010 predicted the frailty score 7 years in advance. d, We applied linear regression where predicted frailty scores from 2010 were regressed onto observed frailty scores from 2017. Correlation coefficient (R2) and P value of F-test of overall significance are reported. iAge was shown to be better than calendar age (P < 0.05 by likelihood ratio test for model comparison). P values are derived from univariate linear regression and inferential statistics where the P value for the independent variable tests the null hypothesis that the variable has no correlation with the dependent variable. NS, not significant. e, Comparison of the inflammatory index (rank cAge minus rank iAge) was computed between a healthy group of older adults (n = 18, age range 50–79 years) and centenarian participants (n = 19, age range 99–107 years). Centenarians were over-represented in individuals with low iAge index (protective phenotype), whereas the control older adults group were over-represented in individuals with high iAge index.
Fig. 2 |
Fig. 2 |. The inflammatory clock of aging correlates with immunosenescence.
a, A hallmark of immunosenescence (naive CD8+ T cells) was used to examine the potential contribution of iAge to this condition. In a multiple regression model, iAge was significantly correlated with the frequency of naive CD8+ T cells to a similar extent to CMV positivity. cAge was the strongest contributor (P < 10−15), followed by CMV (P < 10−5), iAge (P < 10−3) and sex (P = 0.012). ***P <0.001, **P < 0.01, *P < 0.05. P values are derived from hypothesis testing, where the null hypothesis is that the variable has no correlation with the dependent variable. b, The activation of multiple intracellular pathways was measured using the phosphoflow method in B cells, CD4+ T cells (CD45RA+ and CD45RA subsets), CD8+ T cells (CD45RA+ and CD45RA subsets) and in monocytes. In this method, PBMCs are plated ex vivo and activated with a variety of cytokine stimuli to measure phosphorylation events in STAT proteins (specifically STAT1, STAT3 and STAT5). iAge is consistently negatively correlated with B-cell and T-cell responses to cytokine stimuli and positively correlated with monocyte responses (P < 10−5 by self-contained test of modified Fisher’s combined probability).
Fig. 3 |
Fig. 3 |. CXCL9 is a major contributor to iAge.
a, Decomposition of the inflammatory score was conducted by estimating the most variable Jacobians (first-order partial derivative of the inflammatory clock). Boxes represent 25th and 75th percentiles around the median (line); whiskers represent 1.5× interquartile range. Both positive and negative contributors to the inflammatory clock are observed. b, The top 15 most variable Jacobians were CXCL9, EOTAXIN, Mip-1α, LEPTIN, IL-1β, IL-5, IFN-α and IL-4 (positive contributors), and TRAIL, IFN-γ, CXCL1, IL-2, TGF-α, PAI-1 and LIF (negative contributors). Significant differences in the levels of CXCL9 were observed between age groups (P < 0.001, by one-way ANOVA). The pairwise differences between groups were evaluated with the Tukey’s honest significant differences test. Significant differences were shown for older age groups (60–80 years and >80 years) and younger age groups (<20 years, 20–40 years, 40–60 years). ***P < 0.001; **P < 0.01; *P < 0.05; #P < 0.1. Exact P values for each pairwise comparisons are as follows: <20 versus 20–40, 0.72; <20 versus 40–60, 0.99; <20 versus 60–80, 0.09; <20 versus >80, 0; 20–40 versus 40–60, 0.13; 20–40 versus 60–80, 3.5 × 10⁻⁶; 20–40 versus >80, 0; 40–60 versus 60–80, 0.023; 40–60 versus >80, 0; 60–80 versus >80, 7.7 × 10⁻⁶. Boxes represent 25th and 75th percentiles around the median (line); whiskers denote 1.5× interquartile range. c,d, In a validation study, 97 healthy adults (aged 25–90 years) well matched for cardiovascular risk factors were selected from a total of 151 recruited participants. Cardiovascular age was estimated using aortic PWV and RWT. Using multiple linear regression analysis after adjusting for age, sex, BMI, heart rate, systolic blood pressure, fasting glucose and total cholesterol to HDL ratio, positive correlations were obtained between CXCL9 and PWV (R = 0.22) and RWT (R = 0.3) (P < 0.01), and negative correlations were observed between LIF and PWV (R = −0.27) (c) and RWT (R = −0.22) (d). P values are derived from hypothesis testing, where the null hypothesis is that the variable has no correlation with the dependent variable. e,f, Direct comparisons between CXCL9 and the two cardiovascular aging phenotypes (PWV (e) and RWT (f)) are depicted. No other variable included in the models had high co-linearity as suggested by variance inflation factors (VIF) <3 for each factor.
Fig. 4 |
Fig. 4 |. CXCL9 is an important regulator of endothelial cell aging.
a, Quantitative PCR data show increased expression of CXCL9 in BECs of older individuals compared to younger individuals (P = 0.0075). b, Significant differences in tube formation capacity are observed in BECs from older and younger individuals (P = 0.0323). c, Quantification of NO production shows impaired capacity of BECs from older individuals to produce NO when compared to younger individuals in response to acetylcholine (Ach) (adjusted P value (Padj) of BECs (young) versus BECs (old), P <0.0001; Padj value of BECs (young) Ach versus BECs (old) Ach, 0.0002). d, Quantification of LDL uptake show impaired capacity of BECs from older individuals to uptake Ac-LDL when compared to younger individuals (Padj = 0.0002). eg, Quantification of number of tubes, LDL uptake and NO production in response to Ach in Scramble and CXCL9-KD iPSC-ECs shows a significant improvement in aging phenotypes in ECs at passage 6 and 8 with silencing of the CXCL9 gene. Padj values for P6 (Scramble) versus P6 (CXCL9 shRNA) = 0.008 (e); P8 (Scramble) versus P8 (CXCL9 shRNA) = 0.0475. Padj values for P6 (Scramble) versus P6 (CXCL9 shRNA) = 0.044; P8 (Scramble) versus P8 (CXCL9 shRNA) = 0.001 (f). Padj values for P6 (Scramble) Ach versus P6 (CXCL9-KD) Ach = 0.0116; P8 (Scramble) Ach versus P8 (CXCL9-KD) Ach = 0.0001 (g). Scramble are hiPSCs infected with lentivirus carrying nonsense-sequence shRNA. CXCL9-KD are hiPSCs infected with lentivirus carrying sequence-specific shRNA to knockdown expression of CXCL9. All data are represented as mean ± s.e.m., n = 3, *P < 0.05, **P < 0.01, ***P < 0.001; ****P < 0.0001; NS, not significant. Statistical analyses were performed using Student’s t-test or one-way ANOVA corrected with the Bonferroni method.
Fig. 5 |
Fig. 5 |. Early cellular senescence and loss of angiogenesis capacity in iPSC-derived aging endothelia is reversed by silencing CXCL9.
a, Pathway enrichment analysis and tube network formation of Scramble versus CXCL9-KD were analyzed. hiPSCs infected with lentivirus carrying nonsense-sequence shRNA (Scramble) and hiPSCs infected with lentivirus carrying sequence-specific shRNA to knockdown expression of CXCL9 (CXCL9-KD) were both induced to ECs (Methods). RNA-seq analysis was conducted on cells at passage 0, 2, 4, 6 and 8 for both conditions. CXCL9 messenger RNA in Scramble was highly upregulated as early as passage 4, whereas CXCL9 mRNA expression in CXCL9-KD did not significantly change with in vitro cellular aging. b, Pathway enrichment comparing Scramble at passage 0 and passage 8. Upregulated inflammatory pathways and downregulated proliferation pathways are depicted (P8 versus P0). c, Comparing Scramble at P8 with CXCL9-KD at P8 shows that silencing of CXCL9 leads to a complete reversal of the early EC senescence phenotype. An example of inflammatory pathway (IFN-γ) and an example of proliferation pathway (E2F targets) is shown in d. d, Relative expression of genes in the hallmark pathways for Scramble at passage 0, 2, 4, 6 and 8 (S0, S2, S4, S6 and S8) are shown. e, Example of inflammatory pathway (IFN-γ) and an example of proliferation pathway (E2F targets) for CXCL9-KD at passage 0, 2, 4, 6 and 8 (KD0, KD2, KD4, KD6 and KD8) are shown. ***P < 0.001; **P < 0.01; *P < 0.05.
Fig. 6 |
Fig. 6 |. CXCL9 promotes a vascular stiffness gene expression signature in the aging endothelium and impairs endothelial function.
The expression levels of hallmark vascular stiffness genes—CAMs, MMPs and COLs—were analyzed in Scramble and CXCL9-KD aging cells. a, CAMs, MMPs and COLs are highly expressed in Scramble passage 8 compared to passage 0. b, Knockdown of CXCL9 completely restores the expression of CAMs and MMPs, but not COLs. c, Line graph of percent relaxation of mouse thoracic aortic sections incubated with increasing concentrations of CXCL9 shows impaired vascular reactivity to acetylcholine, suggesting that CXCL9 dampens vascular function. d, A similar trend is observed when CXCL9 is given to either young or old mice. CXCL9 disrupts the relaxation supposedly induced by acetylcholine. All data are represented as mean ± s.e.m., n = 3, *Padj value of young mice (PBS) versus young mice (CXCL9) = 0.0237; #Padj value of young mice (PBS) versus old mice (PBS) = 0.0003, $Padj value of young mice (PBS) versus young mice (CXCL9) < 0.0001. Statistical analyses were performed using two-way ANOVA followed by a Bonferroni post hoc test; n = 3 (three separate segments of aortas).
Fig. 7 |
Fig. 7 |. CXCL9 regulates endothelial cell senescence and capillary network formation in vivo.
a, Growth curves over 4 d show recovery of cell proliferation in CXCL9-KD iPSC-ECs in later passages when compared to Scramble iPSC-ECs (Padj value of P8 Scramble (day 4) versus P8 CXCL9-KD (day 4) = 0.0232). b, Cellular senescence activity assay shows restoration of SA-β-gal activity in CXCL9-KD iPSC-ECs at later passages when compared to Scramble iPSC-ECs (Padj value of P6 (Scramble) versus P6 (CXCL9 shRNA) = 0.0406; Padj value of P8 (Scramble) versus P8 (CXCL9 shRNA) = 0.0278). c, Representative immunohistochemical images showing CD31+ human capillaries from serially passaged Scramble and CXCL9-KD iPSC-ECs. Arrows denote CD31 staining on iPSC-EC indicating capillary formation. d, Quantification of CD31+ capillaries show improved capacity of late passaged CXCL9-KD iPSC-ECs to form in vivo capillary networks (Padj value of P0 (Scramble) versus P8 (Scramble) <0.0001; Padj value of P8 (Scramble) versus P8 (CXCL9 shRNA) = 0.0487). All data are represented as mean ± s.e.m., n = 3, *P < 0.05, ****P < 0.001. Statistical analyses were performed using one-way ANOVA corrected with the Bonferroni method. Scale bars, 100 μm.

Comment in

References

    1. Kotas ME & Medzhitov R Homeostasis, inflammation, and disease susceptibility. Cell 160, 816–827 (2015). - PMC - PubMed
    1. Liu F et al. Mechanosignaling through YAP and TAZ drives fibroblast activation and fibrosis. Am. J. Physiol. Lung Cell Mol. Physiol 308, L344–L357 (2015). - PMC - PubMed
    1. Crusz SM & Balkwill FR Inflammation and cancer: advances and new agents. Nat. Rev. Clin. Oncol 12, 584–596 (2015). - PubMed
    1. Franceschi C & Campisi J Chronic inflammation (inflammaging) and its potential contribution to age-associated diseases. J. Gerontol. A Biol. Sci. Med. Sci 69, S4–S9 (2014). - PubMed
    1. Furman D et al. Expression of specific inflammasome gene modules stratifies older individuals into two extreme clinical and immunological states. Nat. Med 23, 174–184 (2017). - PMC - PubMed

Publication types