. 2022 Jan 7;39(1):msab332.
doi: 10.1093/molbev/msab332.

A Deep-Learning Approach for Inference of Selective Sweeps from the Ancestral Recombination Graph

Affiliations

A Deep-Learning Approach for Inference of Selective Sweeps from the Ancestral Recombination Graph

Hussein A Hejase et al. Mol Biol Evol. .

Abstract

Detecting signals of selection from genomic data is a central problem in population genetics. Coupling the rich information in the ancestral recombination graph (ARG) with a powerful and scalable deep-learning framework, we developed a novel method to detect and quantify positive selection: Selection Inference using the Ancestral recombination graph (SIA). Built on a Long Short-Term Memory (LSTM) architecture, a particular type of a Recurrent Neural Network (RNN), SIA can be trained to explicitly infer a full range of selection coefficients, as well as the allele frequency trajectory and time of selection onset. We benchmarked SIA extensively on simulations under a European human demographic model, and found that it performs as well or better as some of the best available methods, including state-of-the-art machine-learning and ARG-based methods. In addition, we used SIA to estimate selection coefficients at several loci associated with human phenotypes of interest. SIA detected novel signals of selection particular to the European (CEU) population at the MC1R and ABCC11 loci. In addition, it recapitulated signals of selection at the LCT locus and several pigmentation-related genes. Finally, we reanalyzed polymorphism data of a collection of recently radiated southern capuchino seedeater taxa in the genus Sporophila to quantify the strength of selection and improved the power of our previous methods to detect partial soft sweeps. Overall, SIA uses deep learning to leverage the ARG and thereby provides new insight into how selective sweeps shape genomic diversity.

Keywords: ancestral recombination graph; machine learning; positive selection; selective sweep.


Figures

Fig. 1.
Fig. 1.
A high-level framework for automating the detection of selective sweeps. We first estimate the demographic history for the population of interest, then based on the estimated demographic history, we simulate neutral regions and sweeps using the discoal simulator (Kern and Schrider 2016). We proceed with ARG inference and then extract ARG-level statistics from each simulated region. The ARG-level statistics are used as features for a deep-learning RNN model. Finally, the trained model is applied to the empirical data to infer sweeps, selection coefficients, and AF trajectories.
Fig. 2.
Fig. 2.
Classification performance of SIA and other methods on simulated data. Sequence data were simulated under a variety of selection regimes (s, shown horizontally) and DAFs for the beneficial mutation under selection (f, shown vertically) (see Materials and Methods for more details). The prediction task distinguished neutral regions and sweeps. The methods were tested on a set of 200 regions per panel (100 per class), and the ROC curve records the true positive rate (TPR) as a function of the false positive rate (FPR). The curve is obtained by varying the prediction threshold from 0 to 1 and recording for each threshold the number of regions correctly assigned (TPs) or misassigned (FPs) as positives (with prediction probability above the threshold). The performance of each method was evaluated based on the area under its ROC curve, or AUROC (shown in parenthesis in figure legend). Note that inferred genealogies were used as input to SIA.
Fig. 3.
Fig. 3.
Predictions of selection coefficients on simulated regions using SIA and CLUES based on true genealogies. (A) The distribution of inferred selection coefficients for each method under each model condition are reported using a box plot. The box plot for each method reports these five statistics (from bottom to top): minimum, first quartile, median, third quartile, and maximum. The y-axis shows the inferred selection coefficient, whereas the x-axis shows the true selection coefficient. The dashed-black line indicates the true selection coefficient for each model condition. The simulations are based on the CEU demographic model and true genealogies were used as input to both methods. Each model condition (i.e., box plot) represents a set of 400 independent simulations. The mean ranks and variances of the distributions of inferred s were compared using the Wilcoxon signed-rank test (pW) and the Brown–Forsythe test (pBF), respectively. (B) The root mean square error (RMSE) for each method under each model condition evaluated on 400 independent simulations.
Fig. 4.
Fig. 4.
Predictions of selection coefficient on simulated regions using SIA and CLUES based on inferred genealogies, and ImaGene. (A) The distribution of inferred selection coefficients and (B) root mean square error (RMSE) for each method under each model condition. The simulations are based on the CEU demographic model where inferred genealogies were used as input to SIA and CLUES, whereas sequence alignments were used as input to ImaGene. Figure layout and description are otherwise similar to figure 3.
Fig. 5.
Fig. 5.
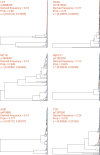
Local genealogies at six loci inferred to be under positive selection in the 1000 Genomes CEU population. Gene name, RefSNP number, derived AF, SIA-inferred sweep probability and SIA-inferred selection coefficient range for each locus are indicated at the top of each panel (see table 1 for more details). Taxa carrying the ancestral and derived alleles are colored in blue and orange, respectively.
Fig. 6.
Fig. 6.
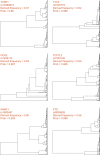
Local genealogies at six loci lacking signal of positive selection in the 1000 Genomes CEU population. Gene name, RefSNP number, derived AF and probability of neutrality inferred by SIA for each locus are indicated at the top of each panel (see table 1 for more details). Taxa carrying the ancestral and derived alleles are colored in blue and orange, respectively.
Fig. 7.
Fig. 7.
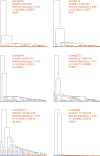
Local genealogies at six loci inferred to be under positive selection in S. hypoxantha. Contig name, position of SNP, derived AF, SIA-inferred selection coefficient range, and the pigmentation gene closest to the locus in question are indicated at the top of each panel. Haploid genomes carrying the ancestral and derived alleles are colored in blue and orange, respectively.

References

    1. Arenas M. 2013. The importance and application of the ancestral recombination graph. Front Genet. 4:206. - PMC - PubMed
    1. Auton A, Brooks LD, Durbin RM, Garrison EP, Kang HM, Korbel JO, Marchini JL, McCarthy S, McVean GA, Abecasis GR; 1000 Genomes Project Consortium. 2015. A global reference for human genetic variation. Nature 526(7571):68–74. - PMC - PubMed
    1. Bersaglieri T, Sabeti PC, Patterson N, Vanderploeg T, Schaffner SF, Drake JA, Rhodes M, Reich DE, Hirschhorn JN.. 2004. Genetic signatures of strong recent positive selection at the lactase gene. Am J Hum Genet. 74(6):1111–1120. - PMC - PubMed
    1. Campagna L, Gronau I, Silveira LF, Siepel A, Lovette IJ.. 2015. Distinguishing noise from signal in patterns of genomic divergence in a highly polymorphic avian radiation. Mol Ecol. 24(16):4238–4251. - PubMed
    1. Campagna L, Repenning M, Silveira LF, Fontana CS, Tubaro PL, Lovette IJ.. 2017. Repeated divergent selection on pigmentation genes in a rapid finch radiation. Sci Adv. 3(5):e1602404. - PMC - PubMed

Publication types