

De Novo Assembly of the Nearly Complete Fathead Minnow Reference Genome Reveals a Repetitive but Compact Genome
- PMID: 34888930
- PMCID: PMC9560796
- DOI: 10.1002/etc.5266
De Novo Assembly of the Nearly Complete Fathead Minnow Reference Genome Reveals a Repetitive but Compact Genome
Abstract
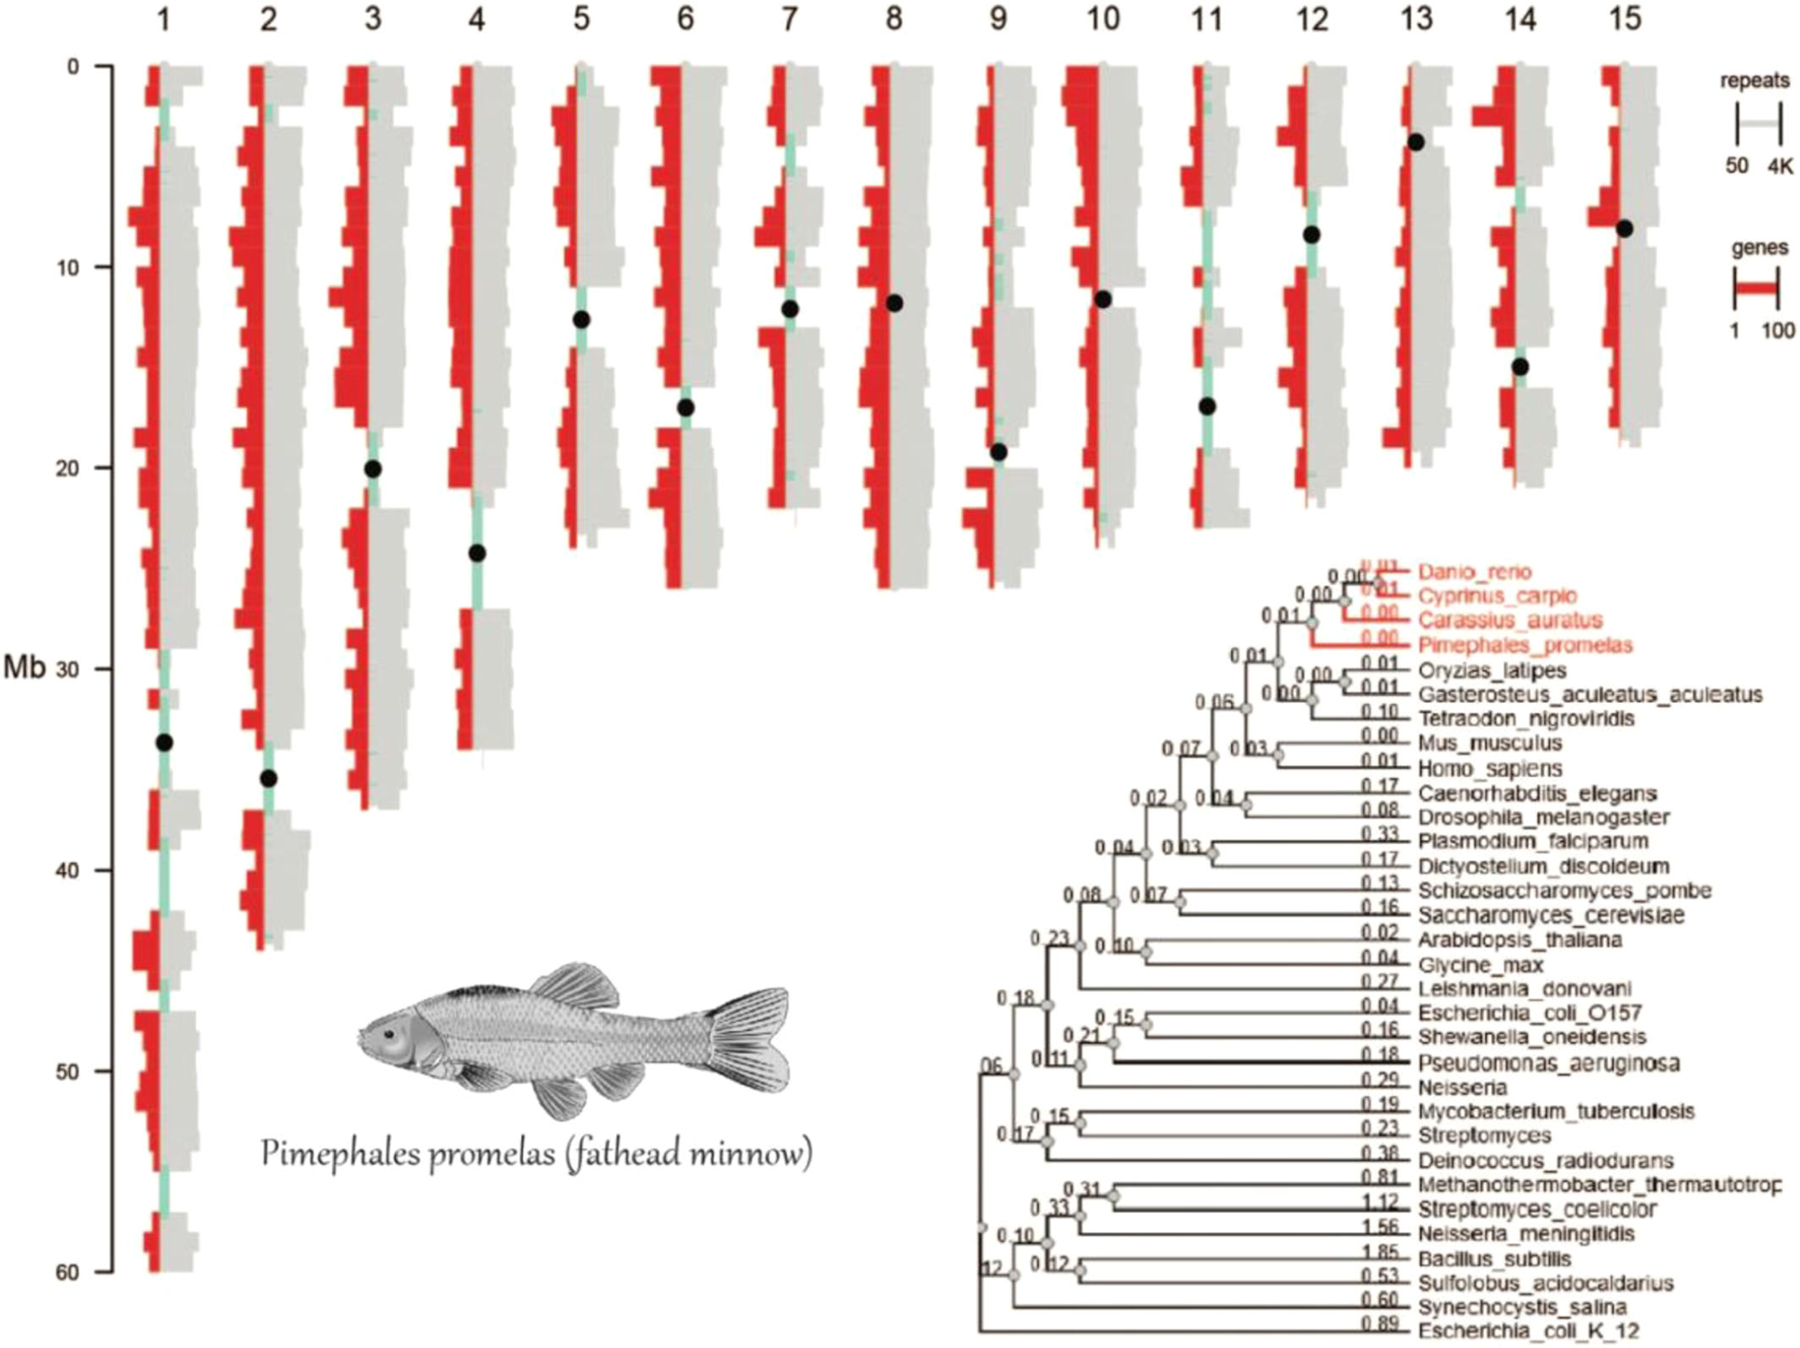
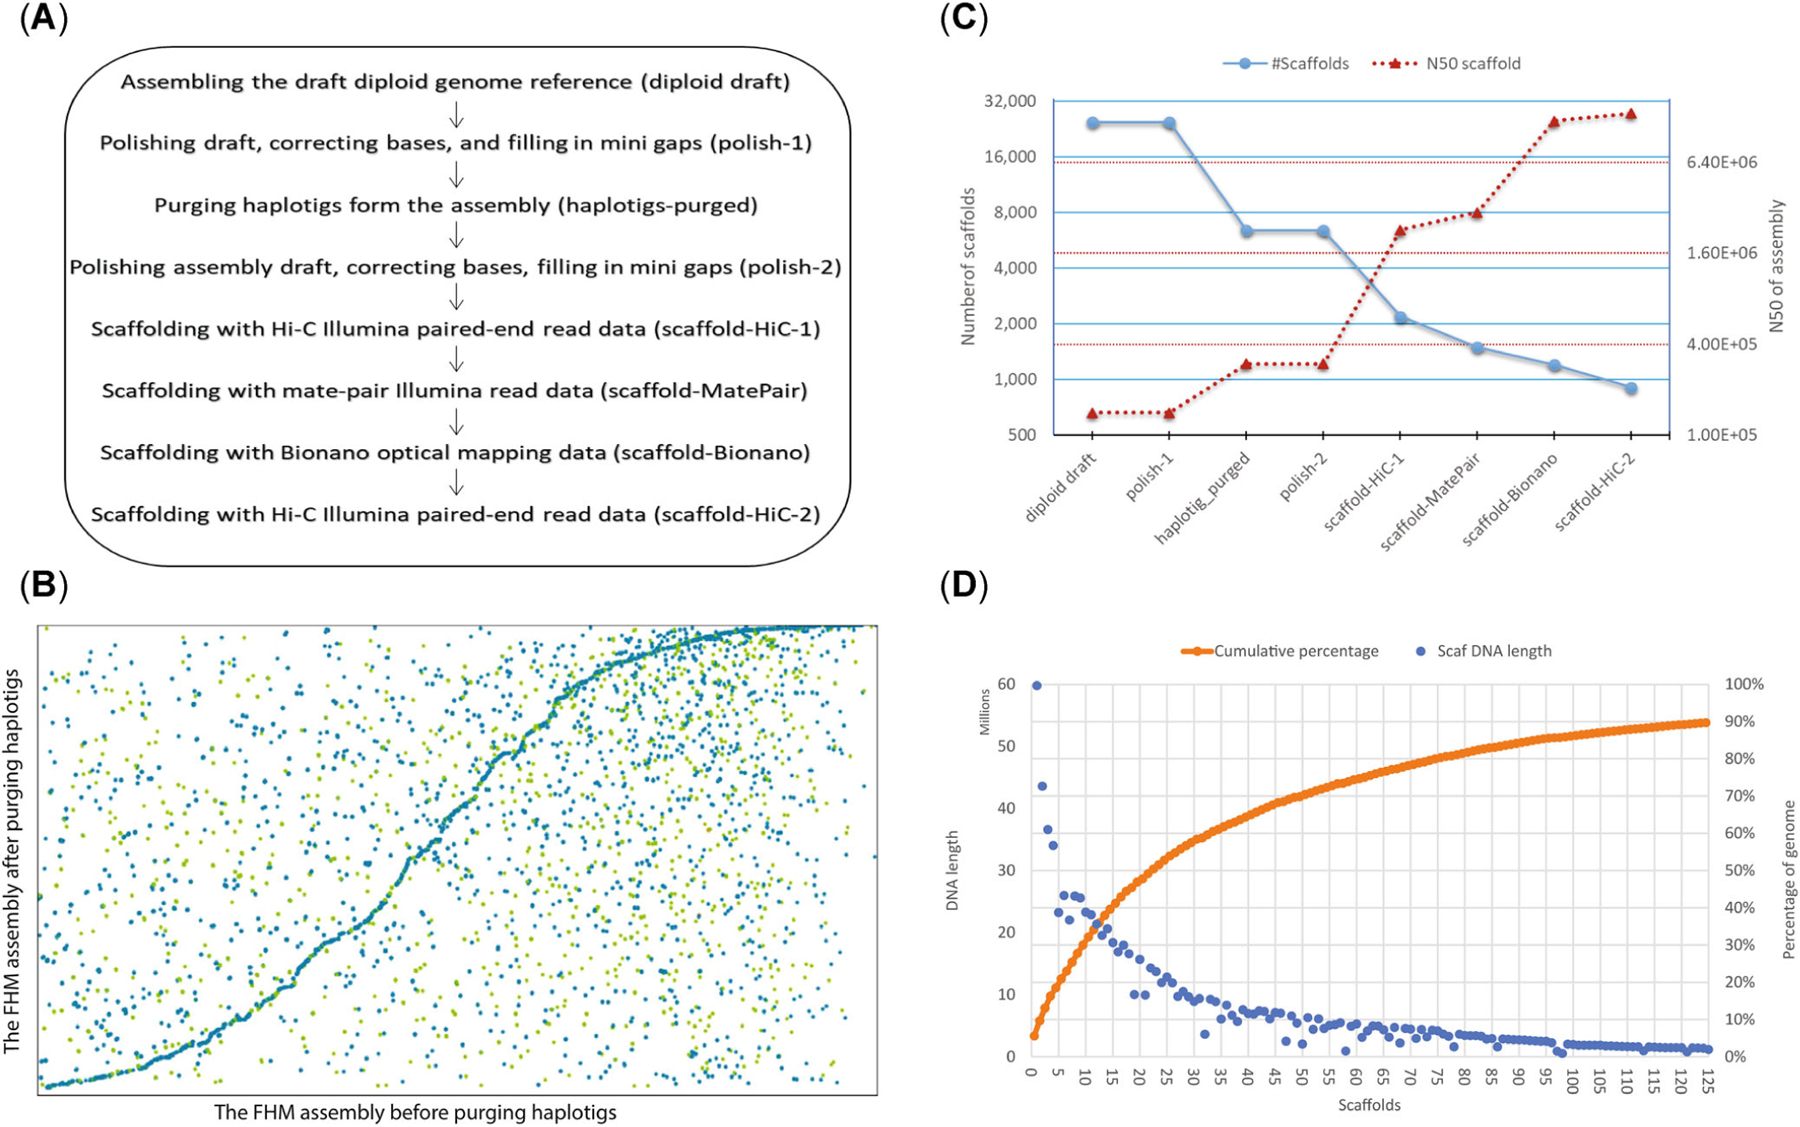
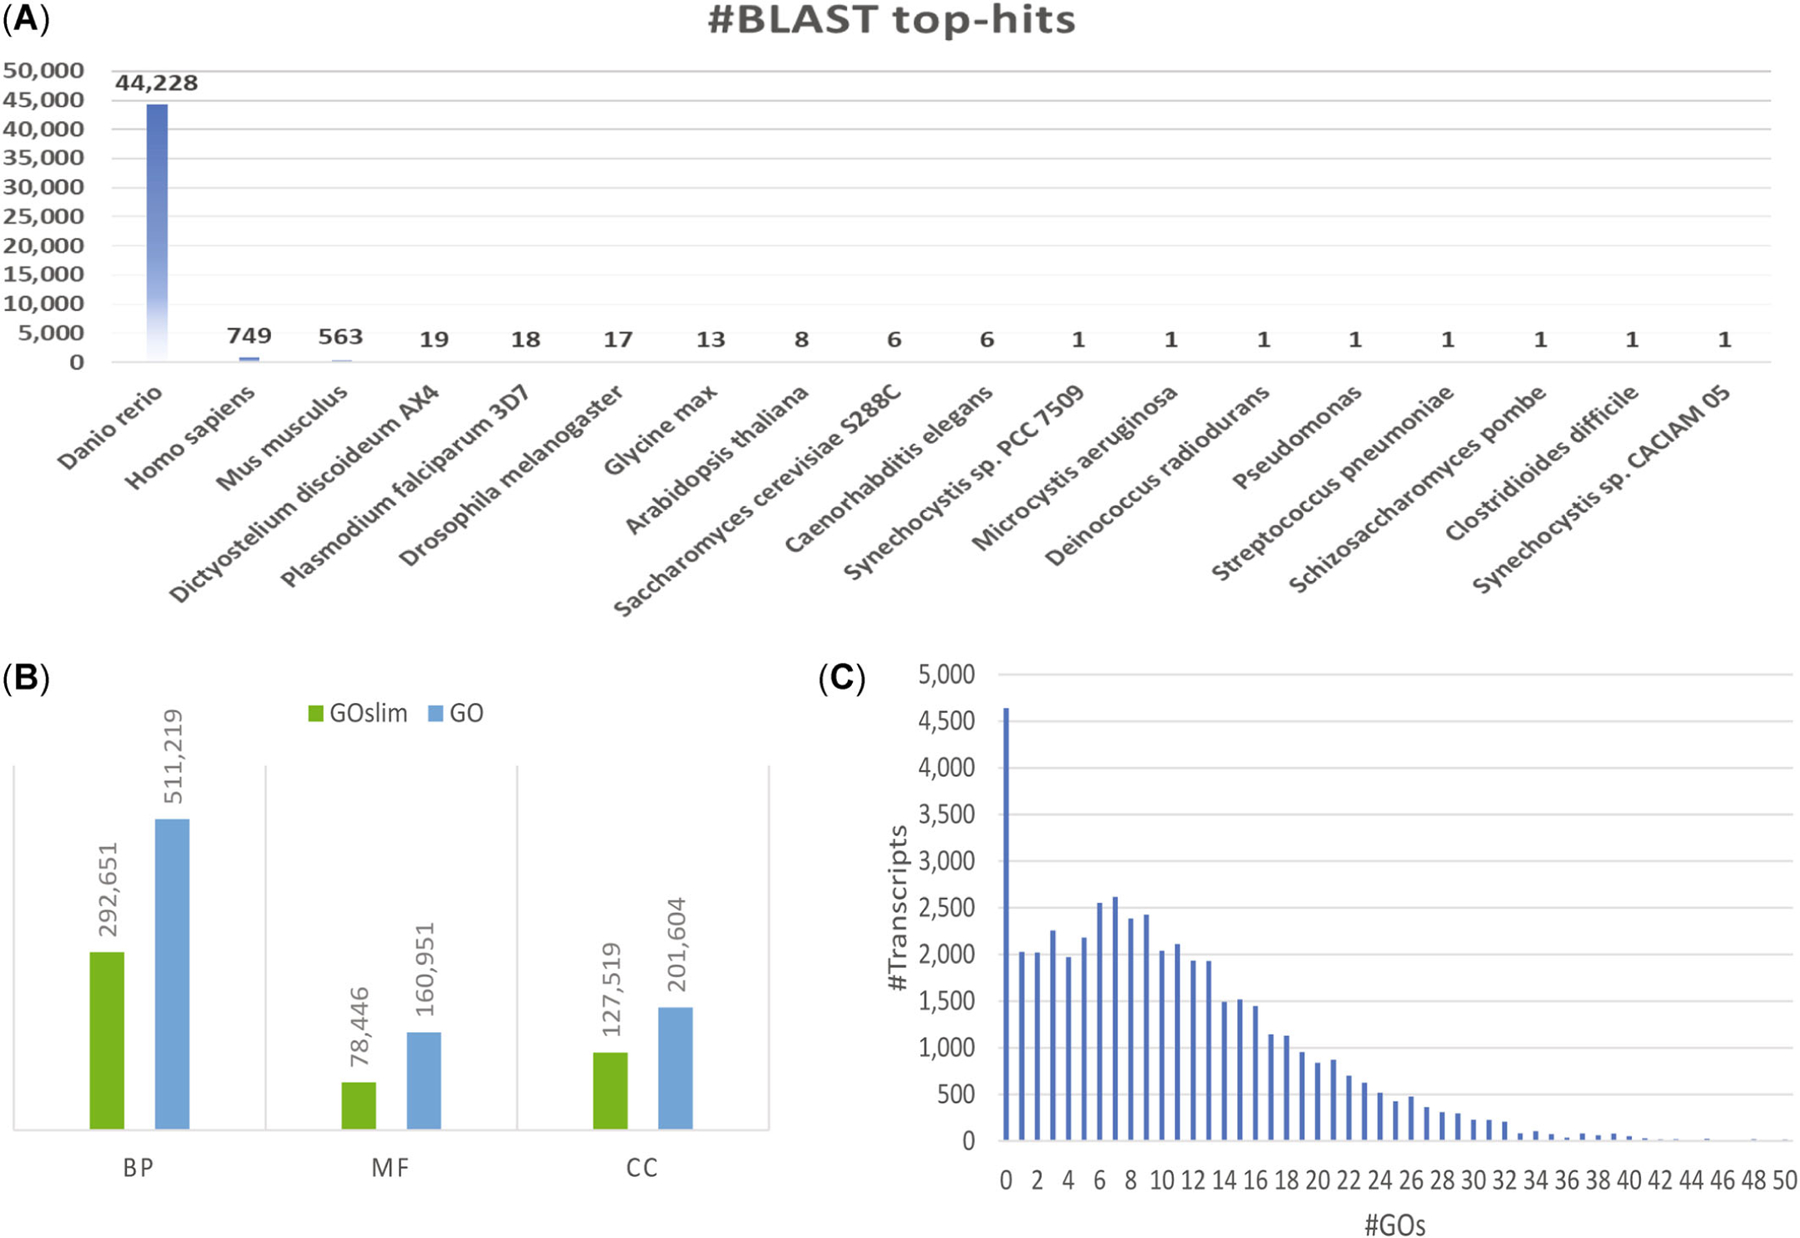
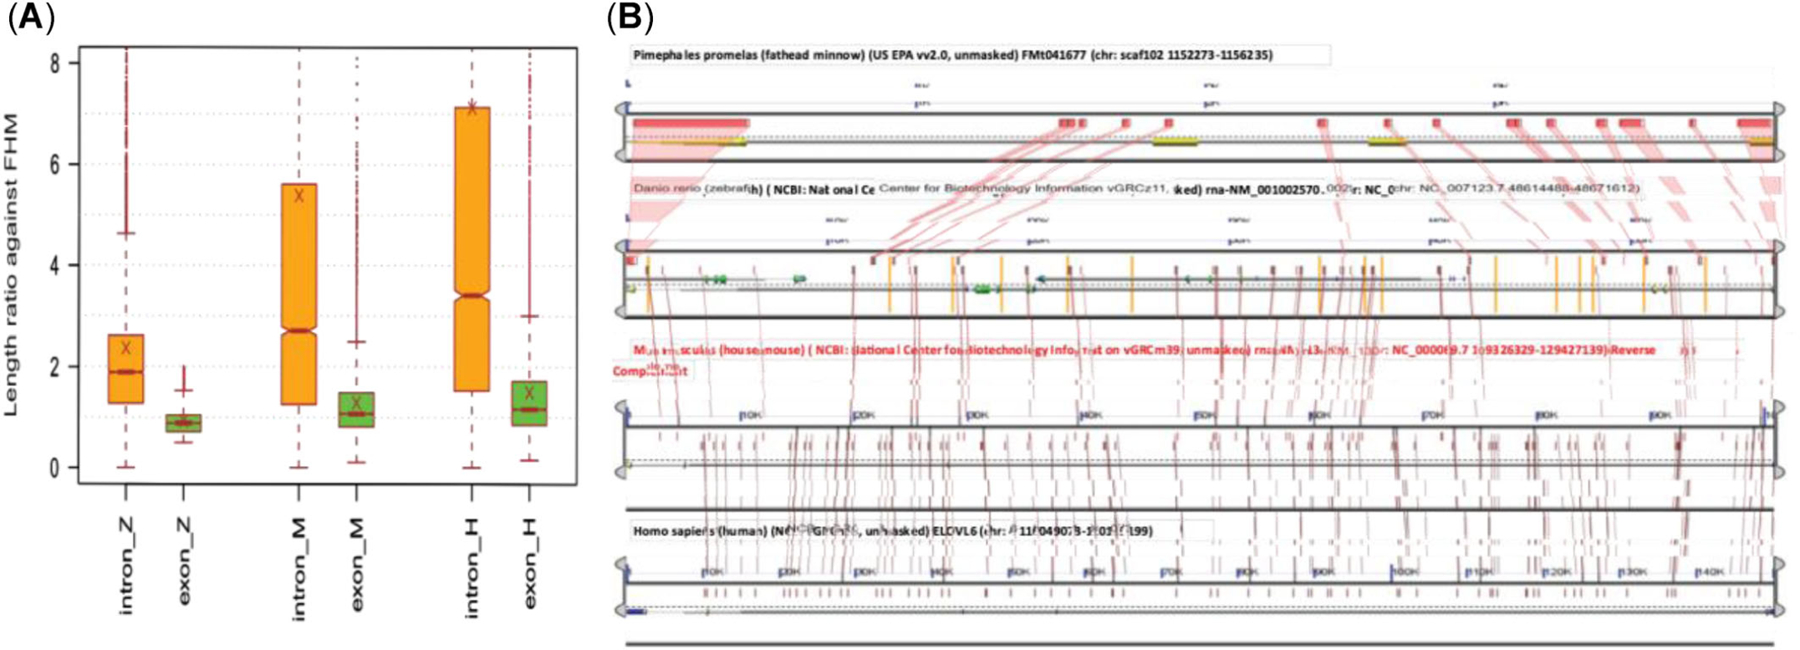
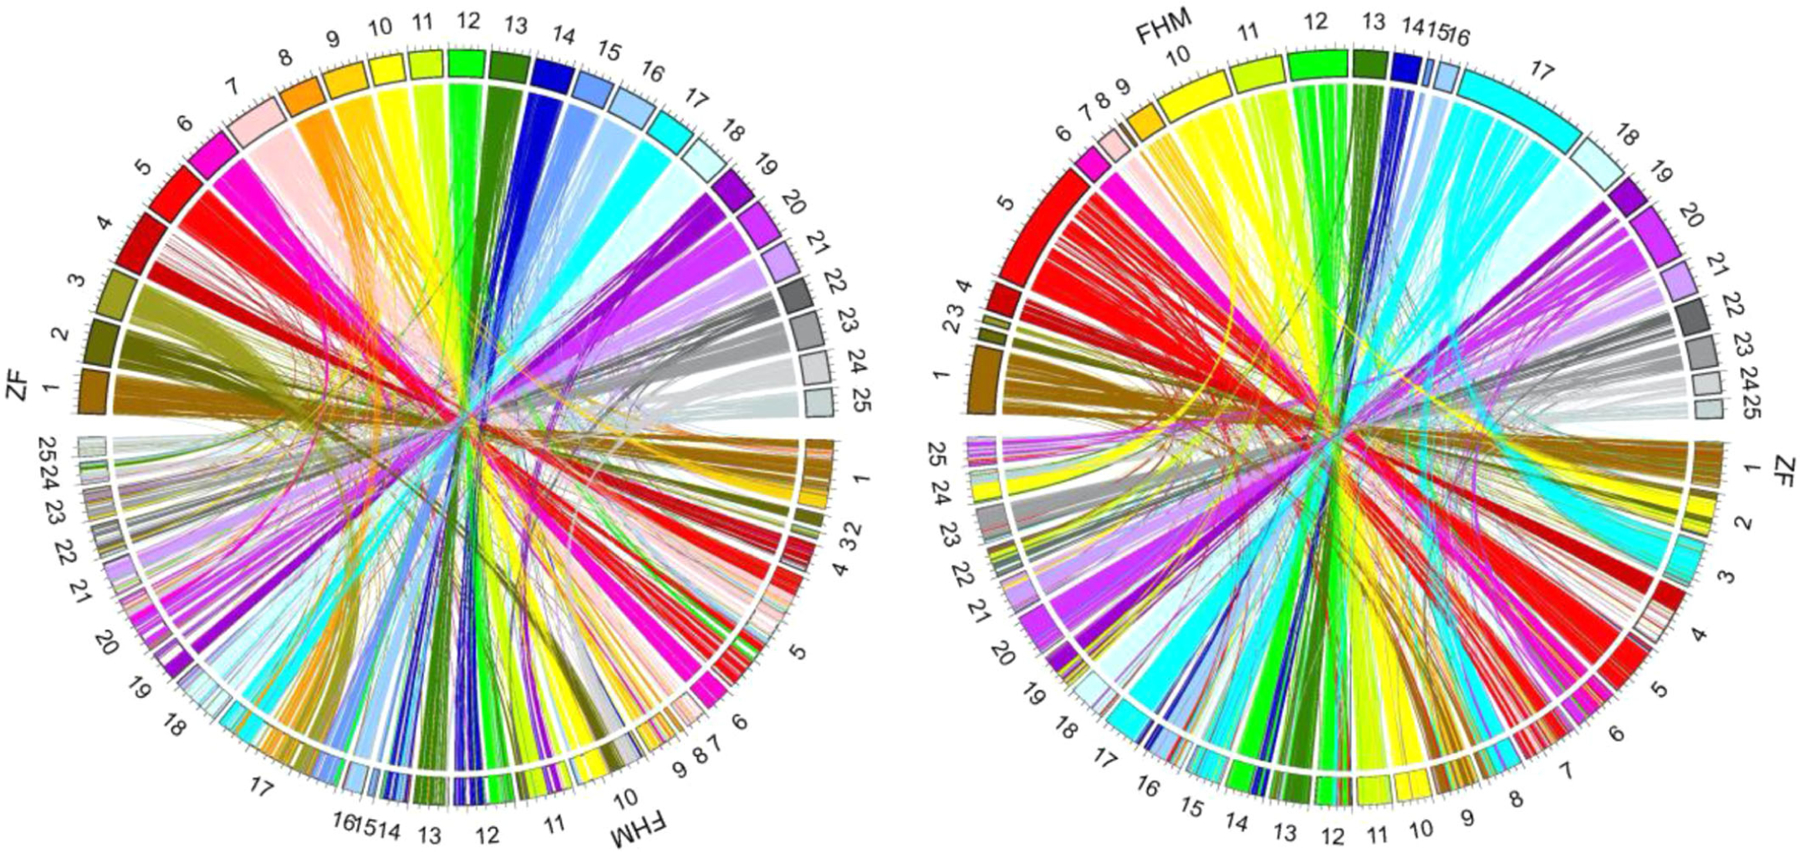
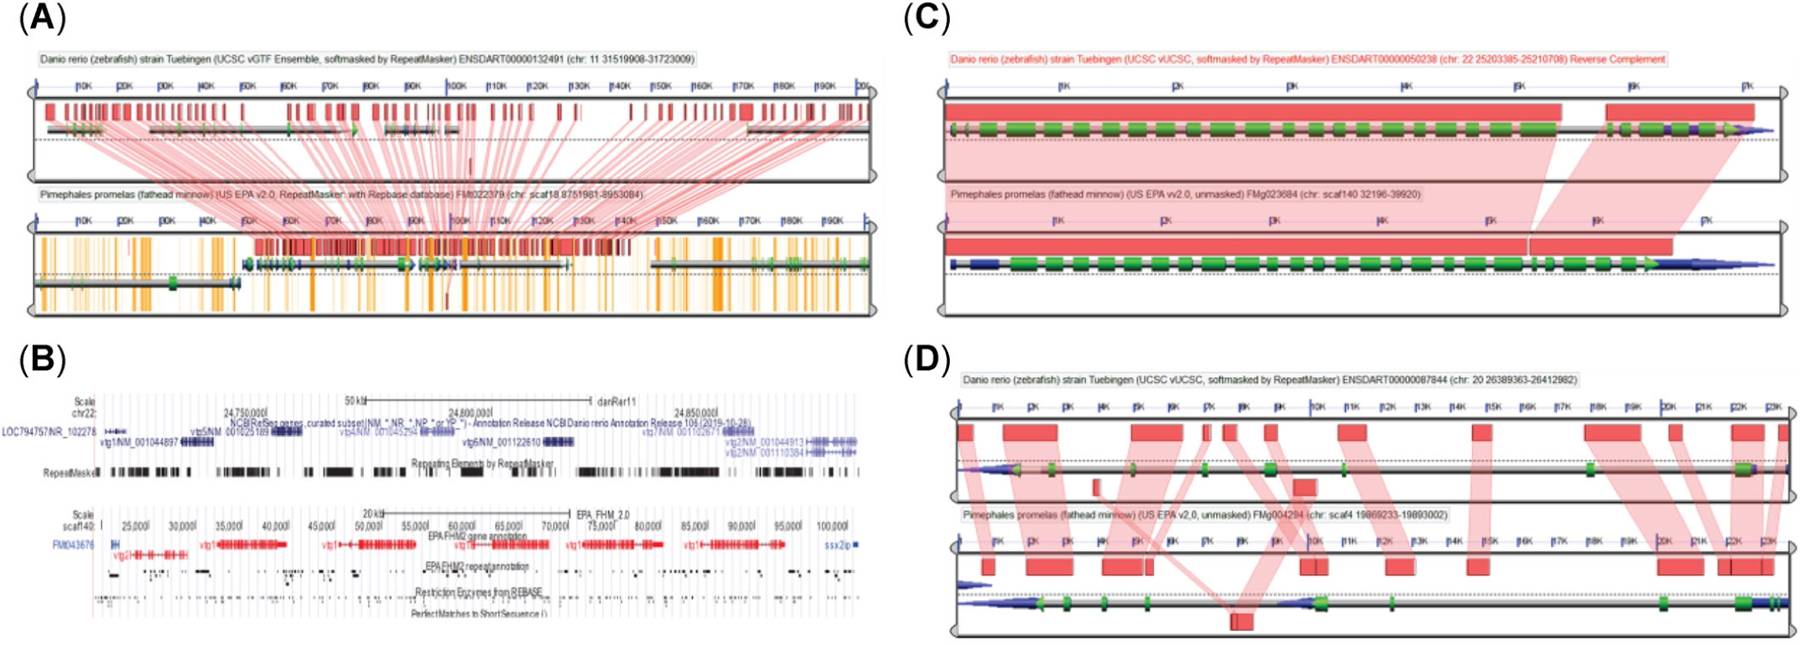
The fathead minnow is a widely used model organism in environmental toxicology. The lack of a high-quality fathead minnow reference genome, however, has severely hampered its uses in toxicogenomics. We present the de novo assembly and annotation of the fathead minnow genome using long PacBio reads, Bionano and Hi-C scaffolding data, and large RNA-sequencing data sets from different tissues and life stages. The new annotated fathead minnow reference genome has a scaffold N50 of 12.0 Mbp and a complete benchmarking universal single-copy orthologs score of 95.1%. The completeness of annotation for the new reference genome is comparable to that of the zebrafish GRCz11 reference genome. The fathead minnow genome, revealed to be highly repetitive and sharing extensive syntenic regions with the zebrafish genome, has a much more compact gene structure than the zebrafish genome. Particularly, comparative genomic analysis with zebrafish, mouse, and human showed that fathead minnow homologous genes are relatively conserved in exon regions but had strikingly shorter intron regions. The new fathead minnow reference genome and annotation data, publicly available from the National Center for Biotechnology Information and the University of California Santa Cruz genome browser, provides an essential resource for aquatic toxicogenomic studies in ecotoxicology and public health. Environ Toxicol Chem 2022;41:448-461. Published 2021. This article is a U.S. Government work and is in the public domain in the USA.
Keywords: Comparative genomics; Fathead minnow; Gene structure; Genome assembly; Toxicogenomics; Zebrafish.
Published 2021. This article is a U.S. Government work and is in the public domain in the USA.
Figures
Similar articles
-
First-generation annotations for the fathead minnow (Pimephales promelas) genome.Environ Toxicol Chem. 2017 Dec;36(12):3436-3442. doi: 10.1002/etc.3929. Epub 2017 Aug 29. Environ Toxicol Chem. 2017. PMID: 28853170 Free PMC article.
-
A high-quality reference genome for the common creek chub, Semotilus atromaculatus.G3 (Bethesda). 2024 Feb 7;14(2):jkad283. doi: 10.1093/g3journal/jkad283. G3 (Bethesda). 2024. PMID: 38128526 Free PMC article.
-
Sequencing and de novo draft assemblies of a fathead minnow (Pimephales promelas) reference genome.Environ Toxicol Chem. 2016 Jan;35(1):212-7. doi: 10.1002/etc.3186. Epub 2015 Oct 29. Environ Toxicol Chem. 2016. PMID: 26513338
-
The fathead minnow in aquatic toxicology: past, present and future.Aquat Toxicol. 2006 Jun 10;78(1):91-102. doi: 10.1016/j.aquatox.2006.01.018. Epub 2006 Feb 21. Aquat Toxicol. 2006. PMID: 16494955 Review.
-
Species and Life-Stage Sensitivity of Chinese Rare Minnow (Gobiocypris rarus) to Chemical Exposure: A Critical Review.Environ Toxicol Chem. 2021 Oct;40(10):2680-2692. doi: 10.1002/etc.5165. Epub 2021 Sep 9. Environ Toxicol Chem. 2021. PMID: 34265131 Review.
Cited by
-
Effects of Age and Exposure Duration on the Sensitivity of Early Life Stage Fathead Minnow (Pimephales promelas) to Waterborne Propranolol Exposure.Environ Toxicol Chem. 2024 Apr;43(4):807-820. doi: 10.1002/etc.5814. Epub 2024 Jan 31. Environ Toxicol Chem. 2024. PMID: 38146914 Free PMC article.
-
The Highly Repetitive Genome of Myxobolus rasmusseni, an Emerging Myxozoan Parasite of Fathead Minnows.Genome Biol Evol. 2024 Nov 1;16(11):evae220. doi: 10.1093/gbe/evae220. Genome Biol Evol. 2024. PMID: 39403974 Free PMC article.
-
Pilot testing and optimization of a larval fathead minnow high throughput transcriptomics assay.Curr Res Toxicol. 2022 Dec 22;4:100099. doi: 10.1016/j.crtox.2022.100099. eCollection 2023. Curr Res Toxicol. 2022. PMID: 36619288 Free PMC article.
-
Effects of Metformin and its Metabolite Guanylurea on Fathead Minnow (Pimephales promelas) Reproduction.Environ Toxicol Chem. 2022 Nov;41(11):2708-2720. doi: 10.1002/etc.5450. Epub 2022 Sep 14. Environ Toxicol Chem. 2022. PMID: 35920346 Free PMC article.
-
Comparing Transcriptomic Points of Departure to Apical Effect Concentrations For Larval Fathead Minnow Exposed to Chemicals with Four Different Modes Of Action.Arch Environ Contam Toxicol. 2024 May;86(4):346-362. doi: 10.1007/s00244-024-01064-y. Epub 2024 May 14. Arch Environ Contam Toxicol. 2024. PMID: 38743081 Free PMC article.
References
-
- Altschul SF, Gish W, Miller W, Myers EW, & Lipman DJ (1990). Basic local alignment search tool. Journal of Molecular Biology, 215(3), 403–410. - PubMed
-
- Ankley GT, Jensen KM, Kahl MD, Korte JJ, & Makynen EA (2001). Description and evaluation of a short-term reproduction test with the fathead minnow (Pimephales promelas). Environmental Toxicology and Chemistry, 20(6), 1276–1290. - PubMed
-
- Ankley GT, & Johnson RD (2004). Small fish models for identifying and assessing the effects of endocrine-disrupting chemicals. Institute for Laboratory Animal Research Journal, 45(4), 469–483. - PubMed
-
- Ankley GT, Kuehl DW, Kahl MD, Jensen KM, Linnum A, Leino RL, & Villeneuvet DA (2005). Reproductive and developmental toxicity and bioconcentration of perfluorooctanesulfonate in a partial life-cycle test with the fathead minnow (Pimephales promelas). Environmental Toxicology and Chemistry, 24(9), 2316–2324. - PubMed
-
- Biran J, Golan M, Mizrahi N, Ogawa S, Parhar IS, & Levavi-Sivan B (2014). Direct regulation of gonadotropin release by neurokinin B in tilapia (Oreochromis niloticus). Endocrinology, 155(12), 4831–4842. - PubMed
MeSH terms
Grants and funding
LinkOut - more resources
Full Text Sources
Miscellaneous
