. 2022 Jan;36(1):e22094.
doi: 10.1096/fj.202101194RRR.

Alterations in sphingolipid composition and mitochondrial bioenergetics represent synergistic therapeutic vulnerabilities linked to multidrug resistance in leukemia

Affiliations

Alterations in sphingolipid composition and mitochondrial bioenergetics represent synergistic therapeutic vulnerabilities linked to multidrug resistance in leukemia

Kelsey H Fisher-Wellman et al. FASEB J. 2022 Jan.

Abstract

Modifications in sphingolipid (SL) metabolism and mitochondrial bioenergetics are key factors implicated in cancer cell response to chemotherapy, including chemotherapy resistance. In the present work, we utilized acute myeloid leukemia (AML) cell lines, selected to be refractory to various chemotherapeutics, to explore the interplay between SL metabolism and mitochondrial biology supportive of multidrug resistance (MDR). In agreement with previous findings in cytarabine or daunorubicin resistant AML cells, relative to chemosensitive wildtype controls, HL-60 cells refractory to vincristine (HL60/VCR) presented with alterations in SL enzyme expression and lipidome composition. Such changes were typified by upregulated expression of various ceramide detoxifying enzymes, as well as corresponding shifts in ceramide, glucosylceramide, and sphingomyelin (SM) molecular species. With respect to mitochondria, despite consistent increases in both basal respiration and maximal respiratory capacity, direct interrogation of the oxidative phosphorylation (OXPHOS) system revealed intrinsic deficiencies in HL60/VCR, as well as across multiple MDR model systems. Based on the apparent requirement for augmented SL and mitochondrial flux to support the MDR phenotype, we explored a combinatorial therapeutic paradigm designed to target each pathway. Remarkably, despite minimal cytotoxicity in peripheral blood mononuclear cells (PBMC), co-targeting SL metabolism, and respiratory complex I (CI) induced synergistic cytotoxicity consistently across multiple MDR leukemia models. Together, these data underscore the intimate connection between cellular sphingolipids and mitochondrial metabolism and suggest that pharmacological intervention across both pathways may represent a novel treatment strategy against MDR.

Keywords: HL-60 cells; acute myeloid leukemia; chemotherapy resistance; mitochondrial bioenergetics; sphingolipids; vincristine.


Conflict of interest statement

DISCLOSURES

Authors declare that they have no conflicts of interest with the contents of this article. MK is Chief Medical Officer and co-founder of Keystone Nano, Inc., and TPL is a member of the scientific advisory board. TPL is on the Scientific Advisory Board and has stock options for Keystone Nano, Bioniz Therapeutics, and Dren Bio. TPL and DF received honoraria from Kymera Therapeutics.

Figures
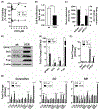
FIGURE 1
FIGURE 1
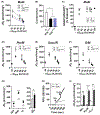
Alterations in sphingolipid metabolism underlie vincristine (VCR) resistance in HL-60 cells. (A) VCR cytotoxicity. HL-60 and HL-60/VCR cells were seeded in 96-well plates (50 000 cells/well) and exposed to VCR concentrations indicated for 48 h. Viability was determined by MTS assay. (B) Cell growth rates determined by viable cell counts. VCR was present in HL-60/VCR growth medium. (C) ABC transporter gene expression profile. Changes in gene expression in HL-60/VCR cells are represented as fold-increase over levels measured in wt cells. (D) Representative immunoblots for SPHK1, GCS, AC, P-gp, and β-actin. (E) Immunoblot quantification represented by fold-increases in blot density over wt. (F) Long-chain bases and S1P profiles. (G) Ceramide, GC, and SM molecular species profiled in wt and HL-60/VCR cells. Figures generated using GraphPad Prism 8 software (Version 8.4.2). Data are Mean ± SEM, (A,B) N = 6/group, (C–F) N = 3/group, (G) N = 4–7/group. *p < .05, **p < .01, ***p < .001, ****p < .0001
FIGURE 2
FIGURE 2
Increased basal and maximal respiration along with low fractional oxidative phosphorylation (OXPHOS) characterizes multidrug resistance leukemia. (A) Oxygen consumption in intact HL-60 wt and HL-60/VCR cells under basal conditions, as well as following the addition of oligomycin (Oligo), FCCP (max rate depicted based on titrations of 0.5, 1, 2, and 3μM), rotenone (Rot), and antimycin A (Ant). (B) Percent decrease in basal respiration induced by oligomycin in wt cells, as well as vehicle or verapamil (10 μM)-treated HL-60/VCR cells. (C) FCCP stimulated respiration corrected for oxygen consumption remaining following rotenone/antimycin. Indicated throughout as total respiratory capacity—JH+Total. (D) Oxygen consumption in digitonin (0.02 mg/ml) permeabilized cells in the absence of substrates (Digi), as well as following the addition of P/M (5 mM/1 mM), ATP-free energy (−54.16 kJ/mol), additional substrate G/O/S (5 mM/0.2 mM/5 mM), cytochrome C (Cyt), phosphocreatine titration to manipulate ATP-free energy. Data displayed were corrected for respiration remaining following Rot/Ant. Maximal respiration in the presence of saturating substrate and minimal ATP-free energy was denoted as maximal OXPHOS flux (i.e., JH+oxphos). (E) Ratio of JH+oxphos to JH+Total—Fractional OXPHOS. (F) Intact cellular respiration to assess basal and JH+Total in wildtype HL-60 and HL60DNR. (G) OXPHOS kinetics assay, like panel D. (H) Intact cellular respiration to assess basal and JH+Total in wildtype MV411 and MV411Vclax. (I) OXPHOS kinetics assay, like panel D. (J) Calculated Fractional OXPHOS. Figures generated using GraphPad Prism 8 software (Version 8.4.2). Data are Mean ± SEM, (A, B, D, E) N = 4–10/group, (C, F–J) N = 3–5/group. *p < .05, **p < .01, ***p < .001, ****p < .0001
FIGURE 3
FIGURE 3
Mitochondrial phenotyping links low fractional oxidative phosphorylation to CI partial loss-of-function. All experiments were performed in isolated mitochondria. (A) Relationship between JO2 and ATP-free energy (ΔGATP) clamped with the CK clamp in mitochondria energized with Multi. (B) Respiratory conductance—the slope of the relationship between JO2 and ΔGATP. (C) Relationship between NAD(P)H/NAD(P)+ redox and ATP-free energy (ΔGATP) clamped with the CK clamp in mitochondria energized with Multi. (D–F) Relationship between JO2 and ATP-free energy (ΔGATP) clamped with the CK clamp in mitochondria energized with Pyr/M, Succ/R, and G/M. (G) Respiration experiments in mitochondria exposed to saturating ADP, followed by the addition of DHO, and teriflunomide. Bar graph inset displays DHO-specific flux calculated from comparing respiration in the presence of DHO minus that observed in the presence of teriflunomide. (H) Representative trace of a mitochondrial H2O2 emission experiment in wt and HL-60/VCR mitochondria. Data depict fluorescence in response to mitochondrial addition, as well as Pyr/M. (I) Quantified mitochondrial H2O2 emission. (A–I) Data normalized to protein corrected for each sample’s mitochondrial enrichment factor (MEF), assessed via nLC-MS/MS (see methods). Figures generated using GraphPad Prism 8 software (Version 8.4.2). Data are Mean ± SEM, (A–C) N = 3–11/group, (D–E) N = 9–10/group, (F) N = 4/group, (G) N = 7–8/group, (I) N = 5/group. *p < .05, **p < .01, ***p < .001, ****p < .0001
FIGURE 4
FIGURE 4
Decreased CI expression underlies vincristine (VCR) resistance. (A) Label-free nLC-MS/MS was performed on mitochondrial lysates from each sample. Volcano plot depicting changes in the mitochondrial proteome between HL-60/VCR and wt. Protein subunits of each respiratory complex (CI, CII, CIII, CIV) are indicated by color. (B) Cartoon depicting CI inhibition by rotenone. (C) Cell viability in response to 24 h of exposure to increasing concentrations of rotenone in wt and HL-60/VCR cells. Viability assessed via counting in the presence of trypan blue. Figures generated using GraphPad Prism 8 software (Version 8.4.2) and Biorender. Data are Mean ± SEM, (A) N = 5/group, (C) N = 6/group. *p < .05, **p < .01, ***p < .001, ****p < .0001
FIGURE 5
FIGURE 5
Mitochondrial CI inhibition in conjunction with administration of short-chain nanoliposomal ceramide results in synergistic cytotoxicity. (A) Respiration in permeabilized HL-60 wt cells following exposure to vehicle C6 (10 μM) or CNL (10 μM) for 7-days. Cells were permeabilized with digitonin (0.02 mg/ml) and respiration was assessed in response to the indicated additions. Data normalized to viable cell count. (B–D) All experiments were done in HL-60/VCR cells. (B) Cell viability, determined by viable cell count, in HL-60/VCR cells exposed for 48h to CNL (20 μM), ghost (20 μM), phenformin (0.5 mM), CNL (20 μM) + phenformin (0.5 mM), or ghost (20 μM) + phenformin (0.5 mM). (C) Caspase activation in HL-60/VCR cells exposed for 24 h to vehicle (Ctrl), CNL (20 μM), phenformin (0.5 mM), or CNL (20 μM) + phenformin (0.5 mM). (D) Cell viability in response to 48 h of exposure to either CNL (20 μM), IACS-010759 (10 μM), or CNL (20 μM) + IACS-010759 (10 μM). (E) Cell viability, determined by viable cell count, in PBMC, HL-60 wt, HL-60/DNR, HL-60/Vclax, Kasumi-1, KG-1, THP-1, and U937 cells exposed for 48 h to vehicle (Ctrl), CNL (20 μM), phenformin (0.5 mM), or CNL (20 μM) + phenformin (0.5 mM). Viability assessed via counting in the presence of trypan blue. Figures generated using GraphPad Prism 8 software (Version 8.4.2). Data are Mean ± SEM, (A) N = 3/group, (B–E) N = 6–12/group. *p < .05, **p < .01, ***p < .001, ****p < .0001
FIGURE 6
FIGURE 6
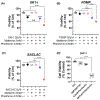
Co-targeting of respiratory CI and enzymes of sphingolipid metabolism induces synergistic cytotoxicity. (A–C) Experiments performed in HL60/VCR. Cell viability in response to 24 h of exposure to Ski-1 (20 μM), 1-phenyl-2-decanoylamino-3-morpholino-1-propanol (PDMP) (20 μM), SACLAC (5 μM), metformin (5 mM) or phenformin (0.5 mM). Metformin and phenformin were administered alone or in combination with Ski-1, PDMP, or SACLAC. Viability assessed via counting in the presence of trypan blue. (D) Cell viability in THP-1 cells treated with vehicle, SACLAC (5 μM), phenformin (0.5 mM), or SACLAC + phenformin. Figures generated using GraphPad Prism 8 software (Version 8.4.2). Data are Mean ± SEM, (A–D) N = 3–6/group. *p < .05, **p < .01, ***p < .001, ****p < .0001

References

    1. Gottesman MM, Lavi O, Hall MD, Gillet J-P. Toward a better understanding of the complexity of cancer drug resistance. Ann Rev Pharmacol Toxicol. 2016;56:85–102. - PubMed
    1. Farge T, Saland E, de Toni F, et al. Chemotherapy-resistant human acute myeloid leukemia cells are not enriched for leukemic stem cells but require oxidative metabolism. Cancer Discov. 2017;7:716–735. - PMC - PubMed
    1. Guièze R, Liu VM, Rosebrock D, et al. Mitochondrial reprogramming underlies resistance to BCL-2 inhibition in lymphoid malignancies. Cancer Cell. 2019;36:369–384.e13. - PMC - PubMed
    1. Gu W, Liu T, Fan D, et al. A6 peptide-tagged, ultra-small and reduction-sensitive polymersomal vincristine sulfate as a smart and specific treatment for CD44+ acute myeloid leukemia. J Control Release. 2020;329:706–716. - PubMed
    1. Senchenkov A, Litvak DA, Cabot MC. Targeting ceramide metabolism–a strategy for overcoming drug resistance. JNCI J Natl Cancer Inst. 2001;93:347–357. - PubMed

Publication types