Intertissue mechanical interactions shape the olfactory circuit in zebrafish
- PMID: 34889034
- PMCID: PMC8811657
- DOI: 10.15252/embr.202152963
Intertissue mechanical interactions shape the olfactory circuit in zebrafish
Abstract
While the chemical signals guiding neuronal migration and axon elongation have been extensively studied, the influence of mechanical cues on these processes remains poorly studied in vivo. Here, we investigate how mechanical forces exerted by surrounding tissues steer neuronal movements and axon extension during the morphogenesis of the olfactory placode in zebrafish. We mainly focus on the mechanical contribution of the adjacent eye tissue, which develops underneath the placode through extensive evagination and invagination movements. Using quantitative analysis of cell movements and biomechanical manipulations, we show that the developing eye exerts lateral traction forces on the olfactory placode through extracellular matrix, mediating proper morphogenetic movements and axon extension within the placode. Our data shed new light on the key participation of intertissue mechanical interactions in the sculpting of neuronal circuits.
Keywords: extracellular matrix; eye; mechanical force; olfactory circuit; placode.
© 2021 The Authors.
Conflict of interest statement
The authors declare that they have no conflict of interest.
Figures
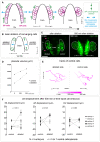
Schematic view of the two movements driving OP coalescence from 12s (14 hpf) to 24s (21 hpf) (dorsal view, membranes of OP cells in magenta). OP cells are initially located in two elongated domains surrounding the brain. Cells from OP extremities converge towards the centre through active migration along the brain surface (anteroposterior convergence, green arrows), while cell bodies of central cells passively move away from the brain (lateral movements, blue arrows). Axon elongation is concomitant with passive lateral movements and occurs through a retrograde mode of extension, where cell bodies move away from axon tips attached to the brain’s surface (Breau et al, 2017).
Schematic view of the laser ablation of converging cells: we used the ngn1:gfp transgenic line to ablate the cells undergoing anteroposterior convergence in one of the two placodes (left side) at 14–16s and tracked the central cells during the following 500 min (to reach the 24s stage). Central cells in the contralateral placode were also tracked and used as controls. Dorsal view.
Images of a representative embryo (embryo 1) following the ablation (left) and 500 min later (right) (dorsal view). The ablated (left side) and control (right side) OPs are surrounded by white lines. Magenta arrowheads show cellular debris where cells were killed in the anterior and posterior regions of the ngn1:gfp + placodal cluster. Asterisks indicate gfp expression in the brain. Scale bar: 40 µm. See also Movie EV1.
Graph showing the volumes of the ablated and control ngn1:gfp + placodes for three time points in embryo 1, t = 0 refers to the ablation.
2D tracks of five central cells in the ablated and control placodes in embryo 1. The time is colour‐coded: light magenta at the starting of the trajectory (just after the ablation) towards dark magenta for the end of the track (500 min later). Similar data (images, volume and tracks) for embryos 2–5 are presented in Fig EV1. Scale bar: 10 µm.
Graphs showing the total mediolateral (ML), anteroposterior (AP) and dorsoventral (DV) displacements of OP central cells during the 500 min following the ablation. In each embryo, both the ablated and control placodes were analysed. N = 5 embryos from three independent experiments, each dot represents the mean displacement per placode (± SEM) calculated from n = 5–7 cells/placode, two‐tailed Wilcoxon matched‐pairs signed rank test.

Images (dorsal view) of embryos 2–5 following the ablation (0 min) performed at 14–16s and 500 min later (24s). The OPs are surrounded by white lines. Magenta arrowheads show, when they are visible, the cellular debris resulting from cell ablation, in the anterior and/or posterior regions of the ngn1:gfp + placodal clusters. Scale bars: 40 µm.
Graphs showing the volumes of the ablated and control ngn1:gfp + placodes for three time points in embryos 2–5, t = 0 refers to the ablation.
2D‐tracks of 5–7 OP central cells in the ablated and control placodes in embryos 2–5. The time is colour‐coded: light magenta at the starting of the trajectory (just after the ablation) towards dark magenta for the end of the track (500 min later). Scale bars: 10 µm.
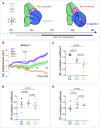
- A
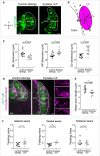
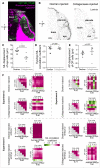
3D schematic view of optic vesicle evagination and optic cup invagination, occurring during OP coalescence. The optic cup (blue) develops near the OP (pink) in a deeper, more ventral position. The brain is represented in green. Both evagination and invagination movements display a strong lateral component and may exert forces on the overlying OP neurons, contributing to their lateral movement and axon extension.
- B
Graph showing the mediolateral (ML) displacement of OP, eye, brain and skin cells as a function of time for embryo 1 (mean ± SEM from seven cells per tissue). Note that this graph is identical to the graph shown in the topmost panel of Fig EV2D.
- C–E
Mediolateral (ML), anteroposterior (AP) and dorsoventral (DV) correlation between pairs of cells belonging to different tissues. A value of 1 indicates highly correlated tracks and −1 is for anticorrelated tracks. Each dot represents the average correlation coefficient for a given pair of tissues in a given embryo (N = 4 embryos from two independent experiments), calculated from the tracking data of 5–7 cells per tissue. One‐way paired ANOVA with Greenhouse–Geisser correction and Tukey’s multiple comparison test. Error bar: SEM. The correlation coefficients obtained of all pairs of cell trajectories for all embryos are presented in correlation matrices shown in Fig EV2E.
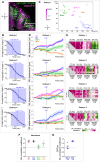
Confocal section of a ngn1:gfp; rx3:gfp double transgenic embryo injected with H2B:RFP mRNA, showing how the invagination angle of the optic cup (θ) was measured (shown here for embryo 1 at 24 s, frontal view). Scale bar: 20 µm.
θ decreases over time and systematically passes through an inflection point when θ is approximately equal to 120°. This inflexion point is used as a common time coordinate (T ref) to time synchronize the four embryos (see methods for more details). We shift the curves of each movie in time so that their reference times T ref overlap at θ = 120°. This enables us to crop our movies in time to get a common time window of 14 h (represented in light blue on the graphs) to analyse cell movements for the four embryos. Error bar: SEM.
Live imaging in a frontal view on ngn1:gfp; rx3:gfp double transgenic embryos injected with H2B:RFP mRNA to label cell nuclei allowed us to track individual cells in four tissues from 12s to 24s (N = 4 embryos from two independent experiments, the way we synchronized the four movies is detailed in the methods). Three representative trajectories of ngn1:gfp + OP cells (magenta), adjacent ngn1:gfp + brain cells (green), rx3:gfp+ eye cells populating the anterior retina (blue) and overlying skin cells (orange) in embryo 1. The time is colour‐coded: light at the starting of the trajectory (12s) towards dark for the end of the track (24s, 865 min later). The reference time (T ref) when the eye invagination angle is 120° (see methods) is shown in the colour bar indicating the time.
Graphs showing the mediolateral (ML) displacement of OP, eye, brain and skin cells as a function of time (mean ± SEM from seven cells per tissue per embryo) for embryos 1, 2, 3 and 4. Note that the topmost graph (embryo 1) is identical to the graph shown in Fig 2B.
Correlation matrices presenting the mediolateral (ML) correlation coefficients between pairs of cell tracks. Each matrix represents the correlation coefficients for all pairs of cell tracks for a given pair of tissues in a given embryo, calculated from the tracking data of 5–7 cells per tissue (N = 4 embryos from two independent experiments). The average ML correlation coefficients (represented in Fig 2C) for each tissue couple are indicated under the matrices.
Intratissue mediolateral (ML) correlation coefficients. Each dot represents the average intratissue correlation, calculated from the tracking data of 5–7 cells per tissue per embryo (N = 4 embryos from two independent experiments). Error bar: SEM.
OP/eye mediolateral (ML) correlation coefficients for pairs of cells belonging to the placode and to the eye before and after T ref. Individual embryos are considered as biological replicates (N = 4 embryos from two independent experiments). Error bar: SEM.
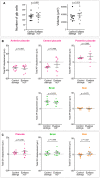
Graphs showing that the number of ngn1:gfp + placodal cells (left) and the volume of the ngn1:gfp + OP cluster (right) in rx3 −/− eyeless mutant and control embryos at 24s (N = 9 mutant placodes and N = 9 control placodes from three independent experiments) are similar. Unpaired, two‐tailed t‐test. Embryos from the same experiment are represented with similar markers (dots, triangles or squares). Error bar: SEM.
Graphs showing the total anteroposterior (AP) displacement (anterior to the top) of anterior, central and posterior OP cells, brain cells and skin cells, starting at 12s and during 700 min of time lapse in rx3 −/− eyeless mutants and control embryos (N = 7 control placodes and N = 7 mutant placodes from four independent experiments, mean calculated from 5 to 7 cells per tissue, unpaired, two‐tailed t‐test. Error bar: SEM. Note that in 2 of the control embryos and 1 of the mutant embryos we could not find any trackable (i.e. expressing H2B‐RFP) posterior OP cell, which explains why there are only five control points and six mutant points in the graph showing the AP displacement of posterior cells.
Graphs showing the total dorsoventral (DV) displacement (ventral to the top) of OP, brain and skin cells starting at 12s and during 700 min of time lapse in rx3 −/− eyeless mutants and control embryos (N = 7 control placodes and N = 7 mutant placodes from three independent experiments, mean calculated from 5 to 7 cells per tissue per placode, unpaired, two‐tailed t‐test). Error bar: SEM.
Images (dorsal views, 1 z‐section) of representative placodes from a ngn1:gfp; rx3 −/− mutant (right) and a control ngn1:gfp sibling (left) at the end of OP coalescence (24s). The ngn1:gfp + OP clusters are surrounded by white lines. Scale bar: 10 µm.
The ngn1:gfp + OP clusters were fitted with a 3D ellipsoid (magenta) to estimate the mediolateral (ML), anteroposterior (AP) and dorsoventral (DV) dimensions of the placode (details in methods) at 24s.
Graphs showing the mediolateral (ML), anteroposterior (AP) and dorsoventral (DV) dimensions of the OP in rx3 −/− eyeless mutants (grey) and control siblings (black) at 24s (N = 9 control embryos and N = 9 mutant embryos from three independent experiments). Embryos from the same experiment are represented with similar markers (dots, triangles or squares). Unpaired, two‐tailed t‐test. Error bar: SEM.
Confocal images (dorsal views, 20 µm maximum projections) of representative placodes from a ngn1:gfp; rx3 −/− eyeless mutant (right) and a control sibling (left) immunostained at 24s for acetyl‐tubulin (magenta), which labels a subpopulation of ngn1:gfp + (green) neurons and their axons. The ngn1:gfp + OP clusters are surrounded by white lines. Some axons are indicated by arrows. Scale bar: 10 µm. Four instances of twisted axons are shown in enlarged images on the right of the panel. The two first axons on the top belong to the mutant placode shown in the Figure, whereas the two others come from additional rx3 −/− mutant embryos. Asterisks indicate the position of the cell bodies.
Graph showing the length of acetyl‐tubulin+ axons in rx3 −/− mutants (grey) and control siblings (black) at 24s (N = 8 embryos from three independent experiments). Unpaired, two‐tailed t‐test. Error bar: SEM.
Graphs showing the twisting index (see methods) of anterior, central and posterior axons in rx3 −/− mutants (grey) and control siblings (black) at 24s (N = 8 control embryos and N = 8 mutant embryos from three independent experiments). For embryos represented by a triangle, only one axon was measured. Unpaired, two‐tailed t‐test for anterior and central axons. For the posterior axons, the data did not show a normal distribution and a two‐tailed Mann–Whitney test was performed. Error bar: SEM.
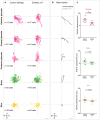
2D tracks (mediolateral along X and anteroposterior along Y), merged at their origin, of anterior, central and posterior ngn1:gfp + placodal cells (as defined in (Breau et al, 2017)) (magenta), ngn1:gfp + brain cells (green) and skin cells (orange), in control and rx3 −/− eyeless mutant embryos (N = 7 control placodes and N = 7 mutant placodes from four independent experiments). All cells were tracked throughout the morphogenesis process, from 12s to 24s stages, during a 700‐min period of time. Scale bar: 20 µm.
Mean 2D trajectories for control and rx3 −/− eyeless mutant embryos. Scale bar: 10 µm.
Graphs showing the total mediolateral (ML) displacement of OP (magenta), brain (green) and skin (orange) cells, starting at 12s and during 700 min of time lapse in rx3 −/− eyeless mutants and control embryos (N = 7 control placodes and N = 7 mutant placodes from four independent experiments, 5–7 cells per tissue per placode, unpaired, two‐tailed t‐test). Embryos from the same experiment are represented with similar markers (dots, triangles or squares). Error bar: SEM.

Schematic view of the supracellular laser ablation experiment (dorsal view). Linear laser cuts (green segments) were performed at the anterior, lateral or posterior border of the ngn1:gfp + OP cluster at 16s, in control and rx3 −/− embryos injected with mbCherry mRNA to label the membranes.
Example of a lateral cut performed on a control ngn1:gfp (green) embryo expressing mbCherry (magenta on the left panel, and purple on the right panel). Left: image showing the position of the region of ablation (yellow), just before the ablation, the OP is delineated with a white line. Scale bar: 20 µm. Right: same image 3 s after the ablation, with tissue velocity field overimposed (magenta arrows) in rectangles of 10 µm width on both sides of the ablation line. The recoil velocity was obtained with the following formula: Vrecoil = <V┴>2 ‐ <V┴>1 where V┴ indicates the outward velocity component orthogonal to the cut line, and < > denotes the average over the adjacent rectangle (1 or 2). We arbitrary oriented the orthogonal axis towards the outside border of the placode.
Graphs showing the initial recoil velocity, used as a proxy for tissue mechanical stress before the cut, following anterior, lateral or posterior cuts, in control and rx3 −/− embryos (number of cuts (1 cut/placode): N = 14 anterior cuts in controls, N = 7 anterior cuts in mutants, N = 13 lateral cuts in controls; N = 10 lateral cuts in mutants, N = 14 posterior cuts in controls, N = 14 posterior cuts in mutants, data obtained from seven independent experiments). Unpaired, two‐tailed t‐test. Error bar: SEM.
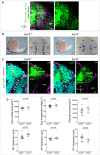
Image (dorsal view, 1 z‐section) of a representative cldnb:lyn‐gfp; ngn1:gfp double transgenic embryo fixed at 24s. The co‐staining with DAPI (magenta) is shown on the left to visualize all nuclei. Note the absence of common cell/cell junctions between the eye and the OP. The white asterisks indicate the nuclei of gfp‐negative interstitial cells present in the gap between the eye and the OP. Scale bar: 20 µm.
In situ hybridization for the NCC marker crestin, in representative foxd3 −/− mutant (right) and foxd3+/+ control (left) embryos. Whole‐mount images and high magnifications of dorsal views on the head regions. Scale bars: 100 µm for whole mount images, 50 µm for high magnifications.
Images (dorsal views) of representative placodes from a ngn1:gfp; foxd3 −/− mutant (right) and a ngn1:gfp; foxd3+/+ control sibling (left) at the end of OP coalescence (24s). The Laminin immunostaining (magenta) delineates brain, OP and eye tissues. White arrowheads indicate supposed interstitial NCC nuclei (DAPI labelling, cyan) between the basement membranes surrounding the tissues. Scale bar: 10 µm.
Graphs showing, in foxd3+/+ controls and foxd3 −/− mutants, the area of the optic cup and its invagination angle calculated on a z‐section passing through the centre of the lens (dorsal view), the OP volume, and mediolateral (ML), anteroposterior (AP) and dorsoventral (DV) dimensions of the OP at 24s, calculated as for rx3 −/− mutants in Fig 3 (N = 9 foxd3+/+ control embryos and N = 9 foxd3 −/− mutant embryos from 3 independent experiments). Embryos from the same experiment are represented with similar markers (dots, triangles or squares). Unpaired, two‐tailed t‐test except for the lateral dimension (no normal distribution) where a two‐tailed Mann–Whitney test was performed. Error bar: SEM.
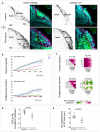
Confocal images (frontal views, 1 z‐section) of Laminin and Fibronectin immunostainings (black, or magenta on the merge) performed on ngn1:gfp; rx3:gfp control (left) and rx3 −/− (right) embryos fixed at 18s. Scale bar: 20 µm.
Live imaging with a dorsal view was performed on ngn1:gfp; rx3:gfp embryos expressing H2B:RFP and injected at 16s with a mixture of collagenases and red fluorescent dextran or with dextran only. Individual cells were tracked in several tissues (OP, eye, brain and skin) from 16s to 24s (N = 5 collagenases‐injected embryos and N = 5 dextran‐injected control embryos from four independent experiments, 5–7 cells per tissue per embryo). The graphs show the mediolateral displacement of OP (magenta), eye (blue) and brain (green) cells as a function of time (mean ± SEM from 5–7 cells per tissue) for one control and one collagenase‐injected embryo (experiment 1).
Correlation matrices presenting the intra‐eye and the eye/OP mediolateral correlation coefficients, calculated from the tracking data of 5–7 cells per tissue (experiment 1). The average correlation coefficient for each tissue couple is indicated below the matrices. Results for experiments 2, 3 and 4 are shown in Fig EV5F.
Graph showing the OP/Eye mediolateral (ML) correlation coefficient in collagenases‐injected embryos and control embryos injected with fluorescent dextran only. Each dot represents the average correlation calculated from the tracking data of 5–8 cells per tissue per embryo (N = 5 collagenases‐injected embryos and N = 5 dextran‐injected control embryos from four independent experiments). Embryos from the same experiment are represented with similar markers (dots, triangles or squares). Unpaired, two‐tailed t‐test. Error bar: SEM.
Graph showing the total mediolateral (ML) displacement of OP cells in collagenases‐injected embryos and control embryos injected with fluorescent dextran only. Unpaired, two‐tailed t‐test. Error bar: SEM. Individual injected embryos are considered as biological replicates (N = 5 collagenase‐injected embryos and N = 5 dextran‐injected control embryos from four independent experiments).
Confocal image (dorsal view, 1 z‐section) taken 20 min after injection of fluorescently labelled dextran (rhodamine, magenta) close to the eye/OP interface in a ngn1:gfp; rx3:gfp (green) embryo. The injected mix diffuses rapidly and fulfils all the space between tissues in the head region. Scale bar: 20 µm.
Confocal images (dorsal views, 1 z‐section) of embryos injected at 16s with collagenases and red dextran (right) or with dextran only (left), fixed at 24s and immunostained for Laminin. Scale bar: 20 µm.
Graph showing the total mediolateral (ML) displacement of eye cells following the injection (N = 5 collagenases‐injected embryos and N = 5 dextran‐injected control embryos from four independent experiments), each dot represents the mean displacement per eye calculated from n = 5 to 8 cells per eye per embryo. Unpaired, two‐tailed t‐test. Embryos from the same experiment are represented with similar markers (dots, triangles or squares). Error bar: SEM.
Eye/eye intratissue mediolateral (ML) correlation coefficients. Each dot represents the average intratissue correlation, calculated from the tracking data of 5 to 7 cells per eye per embryo. Unpaired, two‐tailed t‐test. Error bar: SEM.
Graph showing the total anteroposterior (AP) displacement (anterior to the top) of OP cells following the injection. Each dot represents the mean displacement calculated from n = 5 to 7 cells per placode per embryo. Unpaired, two‐tailed t‐test. Error bar: SEM.
Correlation matrices displaying the intra‐eye and the eye/OP mediolateral correlation coefficients, calculated from the tracking data of 5 to 8 cells per tissue (experiments 2 to 4). The average correlation coefficients for each tissue couple are indicated below the matrices.

Comment in
-
The eye tugs and the nose follows: how inter-tissue adhesion directs olfactory development.EMBO Rep. 2022 Feb 3;23(2):e54396. doi: 10.15252/embr.202154396. Epub 2021 Dec 15. EMBO Rep. 2022. PMID: 34910840 Free PMC article.
References
-
- Agarwal P, Zaidel‐Bar R (2021) Mechanosensing in embryogenesis. Curr Opin Cell Biol 68: 1–9 - PubMed
-
- Aguillon R, Blader P, Batut J (2016) Patterning, morphogenesis, and neurogenesis of zebrafish cranial sensory placodes. Methods Cell Biol 134: 33–67 - PubMed
-
- Aguillon R, Madelaine R, Aguirrebengoa M, Guturu H, Link S, Dufourcq P, Lecaudey V, Bejerano G, Blader P, Batut J (2020) Morphogenesis is transcriptionally coupled to neurogenesis during peripheral olfactory organ development. Development 147: dev192971 - PubMed
Publication types
MeSH terms
Grants and funding
LinkOut - more resources
Full Text Sources
Other Literature Sources
Molecular Biology Databases

