. 2021 Dec 21;10(24):e023417.
doi: 10.1161/JAHA.121.023417. Epub 2021 Dec 10.

Introduction to Hemodynamic Forces Analysis: Moving Into the New Frontier of Cardiac Deformation Analysis

Affiliations

Introduction to Hemodynamic Forces Analysis: Moving Into the New Frontier of Cardiac Deformation Analysis

Fabrizio Vallelonga et al. J Am Heart Assoc. .

Abstract

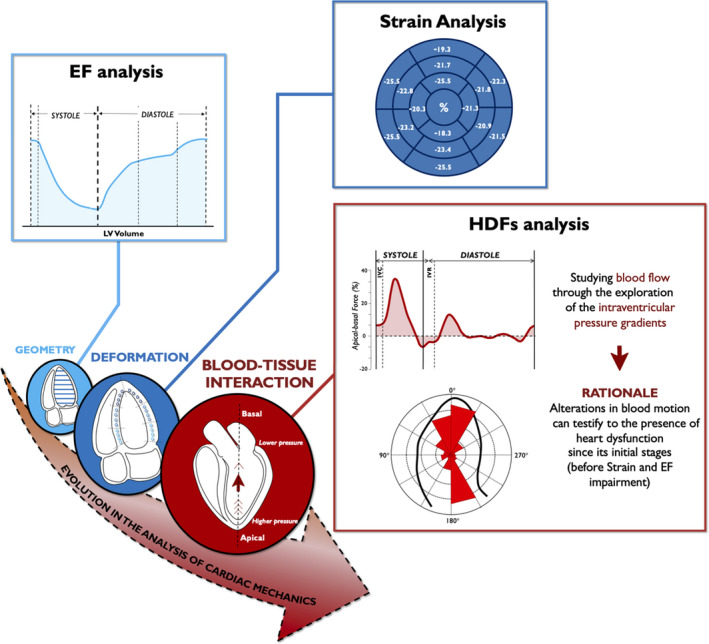
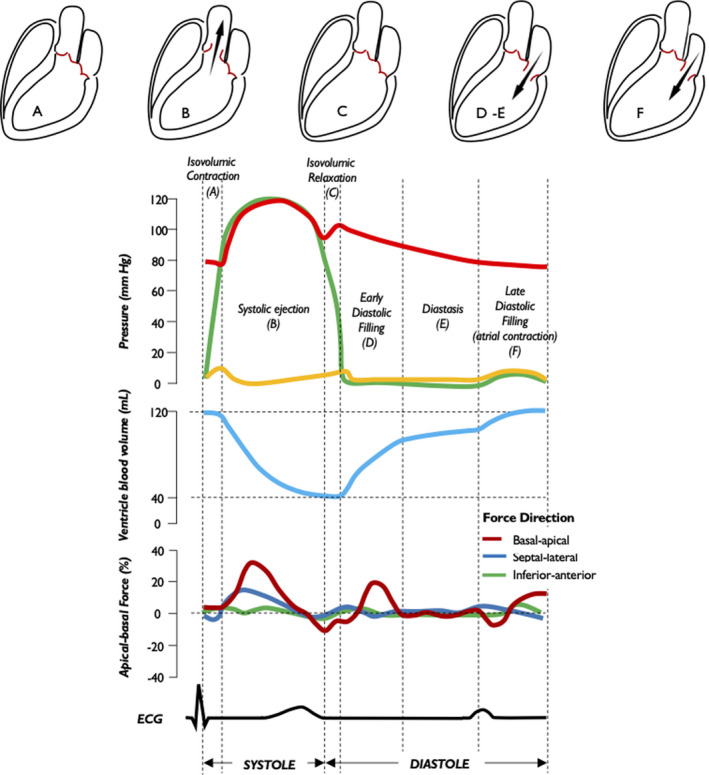
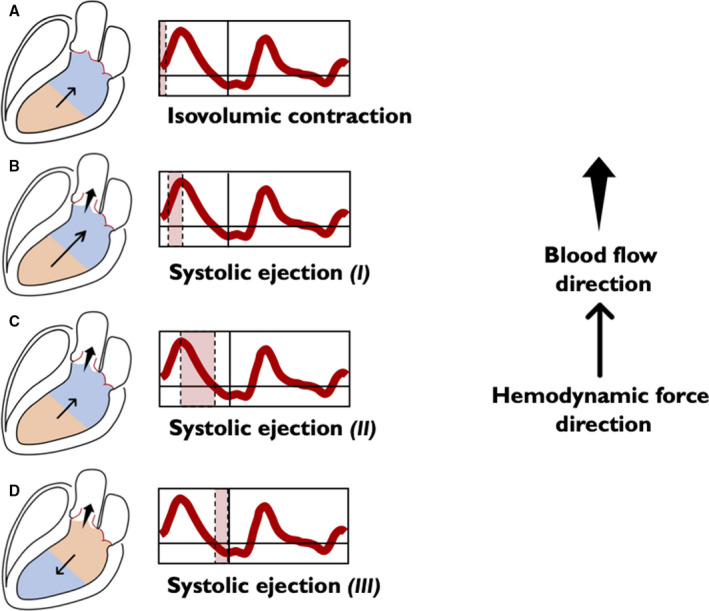
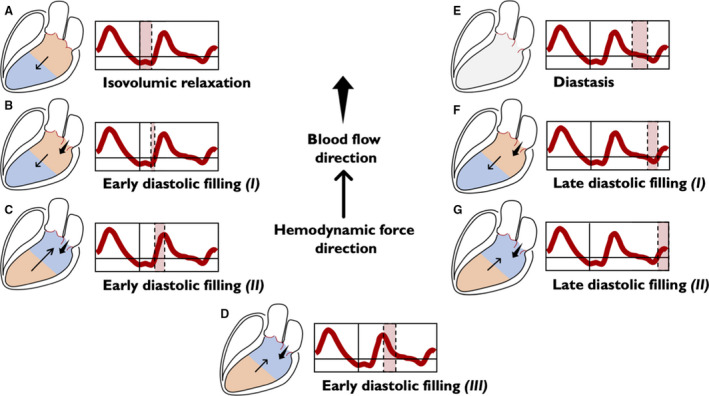
The potential relevance of blood flow for describing cardiac function has been known for the past 2 decades, but the association of clinical parameters with the complexity of fluid motion is still not well understood. Hemodynamic force (HDF) analysis represents a promising approach for the study of blood flow within the ventricular chambers through the exploration of intraventricular pressure gradients. Previous experimental studies reported the significance of invasively measured cardiac pressure gradients in patients with heart failure. Subsequently, advances in cardiovascular imaging allowed noninvasive assessment of pressure gradients during progression and resolution of ventricular dysfunction and in the setting of resynchronization therapy. The HDF analysis can amplify mechanical abnormalities, detect them earlier compared with conventional ejection fraction and strain analysis, and possibly predict the development of cardiac remodeling. Alterations in HDFs provide the earliest signs of impaired cardiac physiology and can therefore transform the existing paradigm of cardiac function analysis once implemented in routine clinical care. Until recently, the HDF investigation was possible only with contrast-enhanced echocardiography and magnetic resonance imaging, precluding its widespread clinical use. A mathematical model, based on the first principle of fluid dynamics and validated using 4-dimensional-flow-magnetic resonance imaging, has allowed HDF analysis through routine transthoracic echocardiography, making it more readily accessible for routine clinical use. This article describes the concept of HDF analysis and reviews the existing evidence supporting its application in several clinical settings. Future studies should address the prognostic importance of HDF assessment in asymptomatic patients and its incorporation into clinical decision pathways.

Keywords: blood flow; cardiac mechanics; deformation imaging; heart failure; intraventricular pressure gradient.


Figures

Figure 1
Figure 1. Temporal evolution of cardiac function analysis and improvement in mechanical abnormalities detection.
Noninvasive echocardiographic HDF analysis represents the latest evolution of cardiac deformation analysis. HDFs could greatly amplify mechanical abnormalities and place even minor kinetic dysfunction within detectable range. EF indicates ejection fraction; GLS, global longitudinal strain; HDF, hemodynamic force; IVC, isovolumic contraction; IVR, isovolumic relaxation; and LV, left ventricle.
Figure 2
Figure 2. Intracavitary pressure profiles, left ventricular blood volume, longitudinal hemodynamic force, and electrical activity along the cardiac cycle.
Profiles of aortic pressure (red), LV pressure (green), LA pressure (yellow), LV volume (blue), and LV longitudinal force (dark red) during the 5 phases of the cardiac cycle are shown: isovolumic contraction (A), systolic ejection (B), isovolumic relaxation (C), early diastolic filling (D), diastasis (E) and late diastolic filling (F). LA indicates left atrium; and LV, left ventricle.
Figure 3
Figure 3. Left ventricular longitudinal hemodynamic force (basal‐apical): systolic phase.
The intraventricular pressure gradients are illustrated for simplicity through only 2 areas: the area at a higher pressure is shown in orange and the area at a lower pressure is shown in blue. The direction of the hemodynamic force (thin arrow) always goes from the higher toward the lower pressure area. The direction of flow (wide arrow) goes from the higher to the lower pressure chamber. The beginning of systole is characterized by isovolumic contraction, which occurs between the mitral valve closure and aortic valve opening. During this phase the longitudinal force presents a positive deflection (A) due to an apex‐base IVPG, which causes an acceleration of flow in the apex‐base direction accompanying movement of blood flow toward the outflow, just before the opening of the aortic valve. Redirection of flow and ventricular reshape are causally and temporally related and, if the mitral valve is competent, there is no blood flow among the chambers, because both the aortic and mitral valves are closed. At this point of time, aortic pressure still exceeds the ventricular pressure. As myocardial contraction continues, LV pressure exceeds the aortic pressure, and the aortic valve opens. When the aortic valve opens, blood ejection from LV begins. Initially, longitudinal force curve is characterized by a positive ascending phase, because of the increase of the pressure gradient from the apex to base up to the maximum (B). Once the peak is reached the second part, although ventricular contraction continues, LV starts to lose tension and the gradient between the apex and the base decreases in a positive descending phase, as a large part of blood volume has been ejected (C). Approaching the end systole, the gradient between apex and base reverses (it becomes greater at the basal level). At this stage, ventricular flow is still exiting but decelerating, because aortic pressure exceeds LV pressure and the intraventricular HDF is in the direction opposite to flow (D) until aortic valve closes, and the LV enters the diastolic phase. HDF indicates hemodynamic force; IVPG, intraventricular pressure gradient; and LV, left ventricle.
Figure 4
Figure 4. Left ventricular longitudinal hemodynamic force (basal‐apical): diastolic phase.
The intraventricular pressure gradients are illustrated for simplicity through only 2 areas: the area at a higher pressure is shown in orange and the area at a lower pressure is shown in blue. The absence of intraventricular gradient is colored in gray. The direction of the hemodynamic force (thin arrow) always goes from the higher toward the lower pressure area. The direction of flow (wide arrow) goes from the higher to the lower pressure chamber. Diastole begins with the isovolumic relaxation (A), in which both the aortic and the mitral valves are closed. During this period, there is no flow between the cardiac chambers, but because of active myocardial relaxation and recoil of elastic forces generated during the previous systole, the pressure gradient directed toward the ventricular apex increases, thus generating a diastolic suction before the opening of the mitral valve. This phase persists until the LV pressure drops below the left atrial pressure, the mitral valve opens, and the early diastolic filling begins; ventricular filling at the beginning is passive and the HDF vector continues to be directed toward the LV apex, but the pooling of blood within the LV (toward the apex) rapidly reduces the HDF toward zero (B). After this stage, LV filling continues supported by the upward movement of the mitral plane that displaces the blood contained into the atrium inside the LV. In this phase, gradually, the pressure in the LV increases until it exceeds the atrial pressure, thus inverting the A‐V pressure gradient, decelerating the LV filling and making HDF to grow in the positive ascending phase (C). The reduced passage of blood from the atrium to the LV progressively equilibrates the pressures in both chambers, eventually reducing the gradient to zero, causing a positive descending phase on the HDF curve (D). In the next phase (diastasis), a pressure equilibrium is established between the base and apex (and between the ventricle and left atrium) (E). The occurrence of atrial contraction, causes a relative gradient from apex to base, resulting in HDF negative vectors (F) and producing the late diastolic filling. Once again, as blood accumulates in LV, the ventricular gradient is reversed and HDF vector become positive (G), decelerating the diastolic filling flow and preparing LV for the systolic ejection phase. A‐V indicates atrio‐ventricular; HDF, hemodynamic force; and LV, left ventricle.
Figure 5
Figure 5. Relationship between heartbeat events and longitudinal hemodynamic force.
Time coupling among apical‐basal HDF, LV volume, mitral and aortic valve M‐mode, and LV M‐mode is shown. Isovolumic contraction (A), systolic ejection (B), isovolumic relaxation (C), early diastolic filling (D), diastasis (E) and late diastolic filling (F). AVC indicates aortic valve closure; AVO, aortic valve opening; ECG, electrocardiography; HDF, hemodynamic force; IVC, isovolumic contraction; IVR, isovolumic relaxation; LV, left ventricular; MVC, mitral valve closure; and MVO, mitral valve opening.
Figure 6
Figure 6. Left ventricular longitudinal hemodynamic force (apical‐basal).
Time profile of the apical‐basal left ventricular hemodynamic force is shown highlighting main intracardiac events during individual time intervals. IVC indicates isovolumic contraction; and IVR, isovolumic relaxation.
Figure 7
Figure 7. Intensity‐weighted polar histogram.
The distribution and intensity of the left ventricular hemodynamic forces during the entire heartbeat are shown by red isosceles triangles within a polar histogram. A, Patient with a mainly longitudinal (apex‐base) directed forces; (B) Patient with a prevalent transversal (septal‐lateral or inferior‐anterior) directed forces.
Figure 8
Figure 8. Left ventricular longitudinal hemodynamic force (apical‐basal) in normal and pathologic hearts.
A, Longitudinal HDF in normal heart (red), in mild dyssynchrony with preserved EF (light blue) and in LBBB with reduced EF (dark blue) are shown. Mild dyssynchrony is associated with a modulation of the systolic wave, due to the asynchronous contraction of different regions, and a rebound effect during the diastolic relaxation phase. In presence of LBBB, the asynchrony is even more evident, especially in systole. B, Longitudinal HDF in normal heart (red) and in DCM with reduced EF (purple) are shown. In absence of asynchrony, DCM presents a generalized reduction in HDF amplitude. DCM indicates dilated cardiomyopathy; EF, ejection fraction; HDF, hemodynamic force; and LBBB, left bundle branch block.

Similar articles

Cited by

References

    1. Potter E, Marwick TH. Assessment of left ventricular function by echocardiography: the case for routinely adding global longitudinal strain to ejection fraction. JACC Cardiovasc Imaging. 2018;11:260–274. doi: 10.1016/j.jcmg.2017.11.017 - DOI - PubMed
    1. Claus P, Omar AMS, Pedrizzetti G, Sengupta PP, Nagel E. Tissue tracking technology for assessing cardiac mechanics: principles, normal values, and clinical applications. JACC Cardiovasc Imaging. 2015;8:1444–1460. doi: 10.1016/j.jcmg.2015.11.001 - DOI - PubMed
    1. Pedrizzetti G, La Canna G, Alfieri O, Tonti G. The vortex—an early predictor of cardiovascular outcome? Nat Rev Cardiol. 2014;11:545–553. doi: 10.1038/nrcardio.2014.75 - DOI - PubMed
    1. Eriksson J, Bolger AF, Ebbers T, Carlhall CJ. Left ventricular hemodynamic forces are altered in patients with dilated cardiomyopathy. J Cardiovasc Magn Reson. 2015;17:P292. doi: 10.1186/1532-429X-17-S1-P282 - DOI
    1. Eriksson J, Zajac J, Alehagen U, Bolger AF, Ebbers T, Carlhäll C‐J. Left ventricular hemodynamic forces as a marker of mechanical dyssynchrony in heart failure patients with left bundle branch block. Sci Rep. 2017;7:2971. doi: 10.1038/s41598-017-03089-x - DOI - PMC - PubMed

Publication types