

Scripted spot removal in PBS proton therapy planning
- PMID: 34890101
- PMCID: PMC8833280
- DOI: 10.1002/acm2.13491
Scripted spot removal in PBS proton therapy planning
Abstract
Background: It is well known in proton therapy that the relative biological effectiveness (RBE) is not constant across the entire Bragg peak, with higher RBE at the distal end of the Bragg peak due to higher linear energy transfer (LET). Treatment planning systems are moving toward LET optimization to mitigate this potentially higher biological impact at a track end. However, using a simple script, proton users can begin to simulate this process by deleting spots from critical structures during optimization. In most cases, nominal target coverage and plan robustness remain satisfactory.
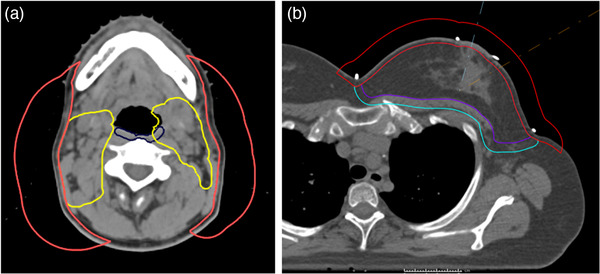
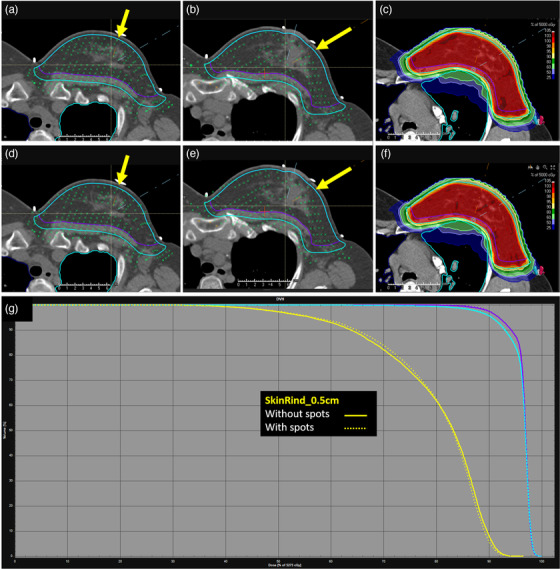
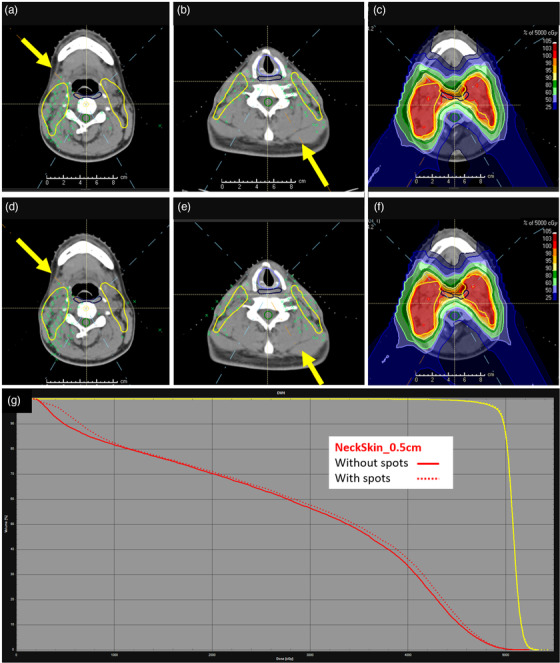
Methods: In our clinic, we developed a script that allows the user to delete spots in all organs at risk (OARs) of interest for one or more treatment beams. The purpose of this script is to potentially reduce side effects by eliminating Bragg peaks within OARs. The script was first used for prostate patients where spots in the rectum and sigmoid, outside of the overlap with the target, were deleted. We then began to use the script for head and neck (H&N) and breast/chestwall patients to reduce acute side effects of the skin by removing spots in a 0.5-cm skin rind.
Conclusions: By utilizing a simple script for deleting spots in critical structures, we have seen excellent clinical results thus far. We have noted reduced skin reactions for nearly all H&N and breast patients.
Keywords: PBS; outcomes; scripting.
© 2021 The Authors. Journal of Applied Clinical Medical Physics published by Wiley Periodicals, LLC on behalf of The American Association of Physicists in Medicine.
Conflict of interest statement
The authors declare that there is no conflict of interest that could be perceived as prejudicing the impartiality of the research reported.
Figures


References
-
- Paganetti H, van Luijk P. Biological considerations when comparing proton therapy with photon therapy. Semin Radiat Oncol. 2013;23(2):77‐87. - PubMed
-
- Cometto A, Russo G, Bourhaleb F, et al. Direct evaluation of radiobiological parameters from clinical data in the case of ion beam therapy: an alternative approach to the relative biological effectiveness. Phys Med Biol. 2014;59(23):7393‐7417. - PubMed
-
- Gerweck LE, Kozin SV. Relative biological effectiveness of proton beams in clinical therapy. Radiother Oncol. 1999;50(2):135‐142. - PubMed
-
- Wilkens JJ, Oelfke U. A phenomenological model for the relative biological effectiveness in therapeutic proton beams. Phys Med Biol. 2004;49(13):2811‐2825. - PubMed
-
- Paganetti H. Relative biological effectiveness (RBE) values for proton beam therapy. Variations as a function of biological endpoint, dose, and linear energy transfer. Phys Med Biol. 2014;59(22):R419‐R472. - PubMed
MeSH terms
LinkOut - more resources
Full Text Sources
