. 2021 Dec 10;7(50):eabl6053.
doi: 10.1126/sciadv.abl6053. Epub 2021 Dec 10.

A single motor neuron determines the rhythm of early motor behavior in Ciona

Affiliations

A single motor neuron determines the rhythm of early motor behavior in Ciona

Taichi Akahoshi et al. Sci Adv. .

Abstract

Recent work in tunicate supports the similarity between the motor circuits of vertebrates and basal deuterostome lineages. To understand how the rhythmic activity in motor circuits is acquired during development of protochordate Ciona, we investigated the coordination of the motor response by identifying a single pair of oscillatory motor neurons (MN2/A10.64). The MN2 neurons had Ca2+ oscillation with an ~80-s interval that was cell autonomous even in a dissociated single cell. The Ca2+ oscillation of MN2 coincided with the early tail flick (ETF). The spikes of the membrane potential in MN2 gradually correlated with the rhythm of ipsilateral muscle contractions in ETFs. The optogenetic experiments indicated that MN2 is a necessary and sufficient component of ETFs. These results indicate that MN2 is indispensable for the early spontaneous rhythmic motor behavior of Ciona. Our findings shed light on the understanding of development and evolution of chordate rhythmical locomotion.


Figures

Fig. 1.
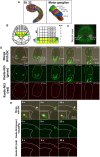
Fig. 1.. Ca2+ oscillation is observed in the motor ganglion at tailbud stage.
(A) Merged images of Ca2+ imaging at different time points. Ca2+ transients were observed on the left and right sides of the motor ganglion, respectively (yellow box; enlarged view of the white box, inset). L, left; R, right. (B) The representative time course image of the Ca2+ transient in the motor ganglion at St. 22. Ca2+ transient is indicated by a white arrowhead (second panel). The region of interest (ROI) for motor ganglion and other regions (for negative control) is indicated by black and red circles, respectively. The image in the motor ganglion (white rectangle) is magnified in the right bottom, respectively. Dashed white lines outline the embryo. (C) Fluorescence intensity of Ca2+ in the ROI. The ROI for the black graph is indicated in (B) (black circle). The ROI for the red graph is indicated in (B) (red circle). A.U., arbitrary units. (D) Transition of the interval between Ca2+ oscillations over time. As the count of Ca2+ transients increases, the interval between Ca2+ oscillations gradually decreases. The period when Ca2+ oscillation in the motor ganglion and tail muscle contraction coincide is indicated by an orange window. Approximate developmental stage is indicated.
Fig. 2.
Fig. 2.. Ca2+ oscillation occurs in a pair of cells at St. 22 and coincides with Ca2+ elevation in tail muscle from St. 23.
(A) Three-dimensional (3D) reconstruction (left) and section (right) images of the Ca2+ oscillation by H2B-GCaMP6s. Ca2+ oscillation is indicated by the white arrowhead. Ca2+ oscillation occurs only in a single nucleus. Dashed white lines outline the embryo. N = 2 (H2B-GCaMP6s–expressing embryos). The data were collected from CLSM and FM. A, anterior; D, dorsal; P, posterior; V, ventral. (B) Bright-field image of a dissociated single cell (left) and time course fluorescence images of Ca2+ oscillation in the cell (right). The position of the cell is indicated by a white arrowhead. N = 6. (C) Change in the fluorescence intensity of Ca2+ in (B) over 2000 s. (D) Representative time course image of Ca2+ oscillation at St. 23. After a few minutes, the Ca2+ oscillation (white arrow, 8 s) coincides with the Ca2+ elevation in the ipsilateral muscle cells (black arrow, 202 s). (E) Fluorescence intensity over time in the motor ganglion and tail muscle at St. 23. ROI was set in (D) at 8 s (yellow dotted line for motor ganglion and blue dotted line for tail muscle cell). The time when the Ca2+ oscillation and Ca2+ elevation of ipsilateral muscle cells first coincided is indicated by a blue rectangle. The asterisks indicate Ca2+ oscillation without synchronization of the Ca2+ elevation in ipsilateral muscle cells after the first synchronization.
Fig. 3.
Fig. 3.. Ca2+ oscillation overlaps with the nucleus-localized signal of MN2/A10.64.
(A) 3D reconstruction of a Ciona embryo at mid-tailbud II (St. 22) modified from previous study (60). The region of the motor ganglion (yellow rectangle) is magnified in the right. Some cell lineages of cells including A10.64 are indicated in the right. (B) Schematic illustrations of the late gastrula (St. 13) (left) and the cell lineage of the neural plate cells (right). A9.32 cells are indicated in green color. The first and second rows of neural plate cells are indicated by light green color. (C) Late gastrula embryo expressing Kaede under the control of the Neurogenin promoter. Kaede was immunostained with antibodies (magenta). Nuclei are stained with DAPI (green). A9.32 and A9.31 cells are identified via the relative position of neural late cells (B). A9.32 and A9.31 cells overlapped with immunostained signals from Kaede. (D) Cell lineage tracking of A9.32 cells from late gastrula (St. 13) to late tailbud I (St. 23). The embryo was electroporated with Neurog::Kaede-NLS and pSP-CiVACHT::GCaMP6s. A10.64 migrates anteriorly and is localized to the motor ganglion at late tailbud I (St. 23) (22). Dashed white lines outline the embryo. (E) Representative time course images of Ca2+ oscillation at St. 23. The A10.64 is labeled with Kaede-NLS (white arrowhead). Ca2+ oscillation overlapped with the nuclear signal from Kaede-NLS (yellow arrowhead). Enlarged views of A10.64 are embedded in each panel (inset). Dashed white lines outline the embryo. N = 6.
Fig. 4.
Fig. 4.. The number of spikes and interspike interval in a burst decreased from St. 23 to St. 24.
(A) Representative fluorescence intensity of Ca2+ (red) and membrane potential (green) in MN2 at St. 23 (top) and St. 24 (lower). The fluorescence intensity of ASAP2f decreases upon depolarization (38). Asterisks indicate the timing of depolarization. (B) Box plot of numbers of spikes in bursts in MN2. Data are presented as means ± SD [n = 7, 12, and 11 for tubocurarine 0 (St. 23), 5 (St. 23), and 5 mM (St. 24), respectively; *P < 0.05; Wilcoxon rank-sum test; Bonferroni multiple comparison test]. (C) Box plot of interspike intervals in MN2. Data are presented as means ± SD [n = 7, 11, and 11 for tubocurarine 0 (St. 23), 5 (St. 23), and 5 mM (St. 24), respectively; ***P < 0.001; Wilcoxon rank-sum test; Bonferroni multiple comparison test]. n.s., not significant.
Fig. 5.
Fig. 5.. Muscle contraction couples with the neuronal activity of MN2 at St. 24.
(A) Three merged images of late tailbud I (St. 23, top) and late tailbud II (St. 24, bottom) as captured by a high-speed camera. The midlines of the embryos are indicated in white (resting state), red (the timing of right muscle contraction), and blue (the timing of left muscle contraction). (B) The time course of the curvature calculated from the midline at late tailbud I (St. 23, top) and late tailbud II (St. 24, bottom). Red and blue bars indicate representative right and left muscle contractions, respectively. Magnified time course of curvature at red and blue bars are indicated in the right graphs, respectively. Asterisks indicate the timing of tail muscle contraction. (C) Box plot of the number of muscle contractions in one ETFs at St. 23 and St. 24. Data are presented as means ± SD [n = 9 (St. 23) and 13 (St. 24) from three and two embryos respectively; **P < 0.01; Wilcoxon rank-sum test].
Fig. 6.
Fig. 6.. Single-cell photoablation for MN2 at St. 22 abrogates the ETFs until St. 24.
(A) Schematic illustration of the scheme for photoablation of MN2. MN2 is illustrated in red. A 440-nm laser was applied from the lateral side. The upper and lower sides of MN2 are marked by black and blue asterisks, respectively. A, anterior; D, dorsal; P, posterior; V, ventral. (B) Fluorescence image (left) and merged image with differential interference contrast (DIC; right) at mid-tailbud II (St. 22) in an embryo electroporated with Neurog::mCherry-CAAX. The signal of mCherry-CAAX in MN2 is indicated by a white arrowhead. (C) Time course of the curvature as calculated from the midline for 120 s. Blue line indicates the curvature of embryos electroporated with Neurog::mCherry-CAAX (for control). Red line indicates the curvature of embryos electroporated with Neurog::miniSOG2-CAAX and Neurog::mCherry-CAAX. Magnified time course of curvature (black rectangles) is indicated in the right graphs. The asterisks indicate a muscle contraction. (D) The number of ETFs in 2 min at St. 24 under each condition. The upper side of MN2 [(A), black asterisk] is indicated as the “ablation side.” The lower side of MN2 [(A), blue asterisk] is indicated as the “opposite side.” Data are presented as means ± SD [N = 9 (electroporated with Neurog::miniSOG2-CAAX and Neurog::mCherry-CAAX) and 7 (electroporated with Neurog::mCherry-CAAX, for control); *P < 0.05; Wilcoxon rank-sum test; Bonferroni multiple comparison test].
Fig. 7.
Fig. 7.. Single-cell photostimulation for MN2 evokes tail motion.
(A) The representative image of embryo expressing Neurog::hChR2(E123T/T159C)-mCherry at stages later than St. 24. The image is merged with fluorescence image and DIC image. The region treated via laser stimulation was indicated by the white circle (corresponding to MN2). (B) The raster diagram of the tail moved over time in (A). Tail motion was observed in all trials. The tail moved time point is indicated by the blue colored point. The time window with laser stimulation applied was indicated by an orange window. (C) The representative image of embryo expressing Neurog::hChR2(E123T/T159C)-mCherry. The image is merged with a fluorescence image and a DIC image. The region treated via laser stimulation was indicated by the white circle (corresponding to other regions). (D) The raster diagram of the tail moved over time in (C). The tail-moved time point is indicated by the blue colored point. The time window with laser stimulation applied was indicated by an orange window. (E) The box plot of the percentage of tail movement time during the laser stimulation in the motor ganglion region (corresponding to MN2) and other regions (including hChR2-expressed area in other regions and no-hChR2-expressed region). Note that the tail moved spontaneously regardless of laser stimulation, and thus, the percentage may not be 0 in both regions. Data are shown as means ± SD [n = 12 (motor ganglion region) and 11 (other region) from five embryos; ***P < 0.001; Welch’s t test].
Fig. 8.
Fig. 8.. The summary of the motor circuit in Ciona until St. 24 and its relation to the circuit of matured larva.
(A) The summary of the Ca2+ oscillation and membrane potential in MN2 and its relationship to the early spontaneous motor behavior from St. 22 to St. 24. Neural tubes (light blue), muscle (red), and MN2 (yellow) are indicated by black arrows. The asterisks and curved arrow indicate the number of muscle contractions in one Ca2+ oscillation or ETFs. (B) (left) Schematic picture of Ciona early motor circuit at St. 23 and St. 24. Ciona early motor circuit shows that MN2 first generates rhythm and regulates muscle contraction. L, left; Mu, muscle; R, right. (right) Schematic picture of motor circuit in matured larva modified from the literature (10, 11, 23). Independent rhythmic activity of MN2 in both the left and right sides in St. 23 and St. 24 probably becomes reciprocal by joining ACIN commissural neurons (19). Each name of the neuron is annotated. Colored lines indicate major chemical synapses. Dashed lines indicate major gap junctions (electrical synapses). Schematic illustration of Ca2+ oscillation is indicated by a red or blue colored line. CNS, central nervous system.

Similar articles

Cited by

References

    1. Muntz L., Myogenesis in the trunk and leg during development of the tadpole of Xenopus laevis (Daudin 1802). J. Embryol. Exp. Morphol. 33, 757–774 (1975). - PubMed
    1. Saint-Amant L., Drapeau P., Time course of the development of motor behaviors in the zebrafish embryo. J. Neurobiol. 37, 622–632 (1998). - PubMed
    1. Gartz Hanson M., Landmesser L. T., Characterization of the circuits that generate spontaneous episodes of activity in the early embryonic mouse spinal cord. J. Neurosci. 23, 587–600 (2003). - PMC - PubMed
    1. Wenner P., O’Donovan M. J., Mechanisms that initiate spontaneous network activity in the developing chick spinal cord. J. Neurophysiol. 86, 1481–1498 (2001). - PubMed
    1. Saint-Amant L., Drapeau P., Motoneuron activity patterns related to the earliest behavior of the zebrafish embryo. J. Neurosci. 20, 3964–3972 (2000). - PMC - PubMed