

Growth and trend analysis of area, production and yield of rice: A scenario of rice security in Bangladesh
- PMID: 34890444
- PMCID: PMC8664192
- DOI: 10.1371/journal.pone.0261128
Growth and trend analysis of area, production and yield of rice: A scenario of rice security in Bangladesh
Abstract
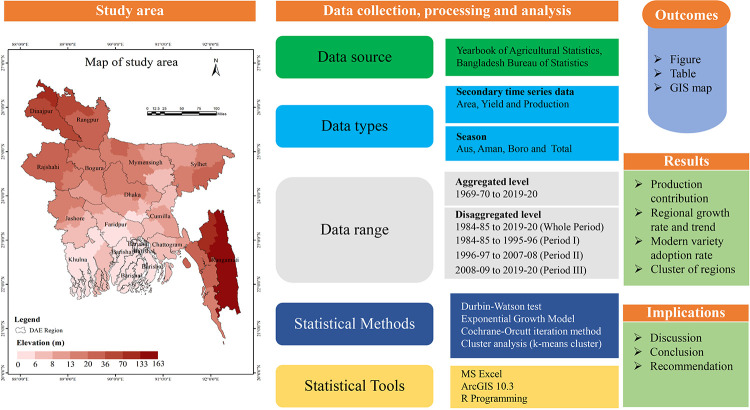
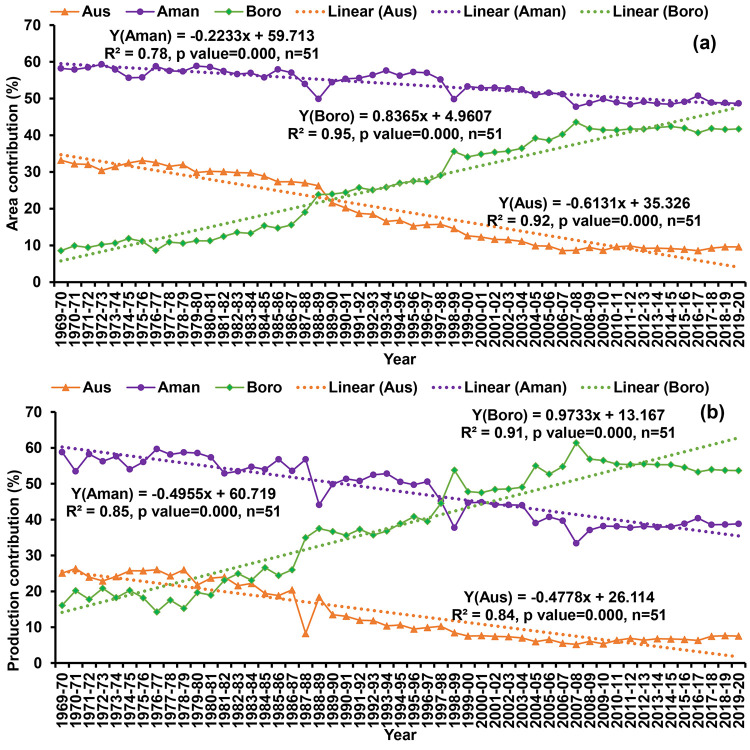
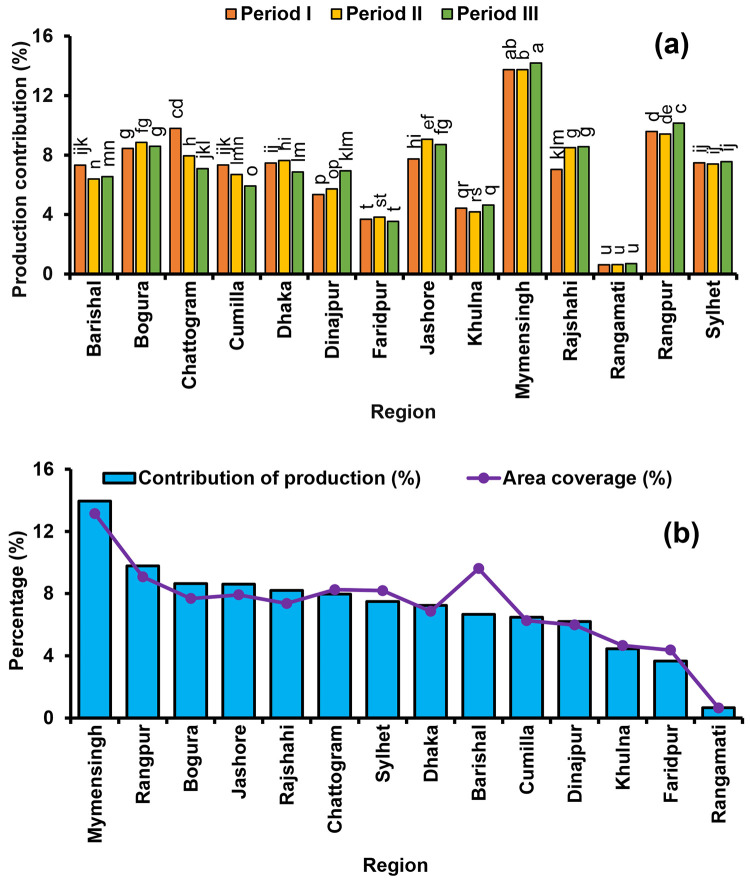
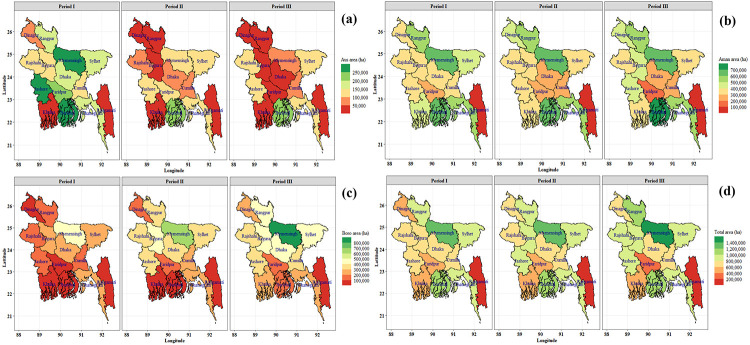
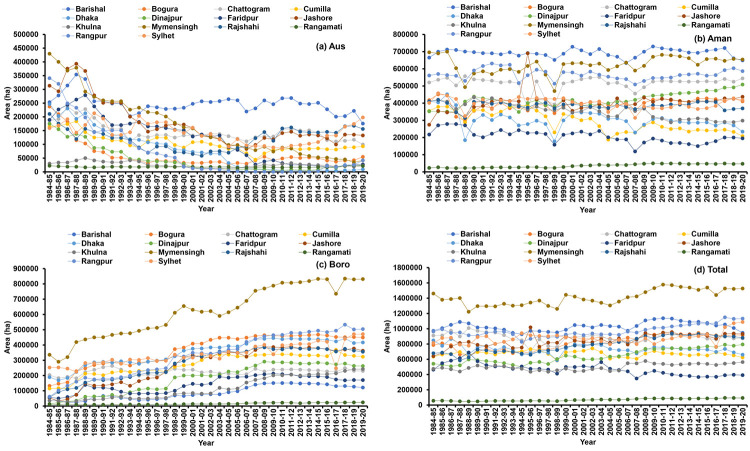
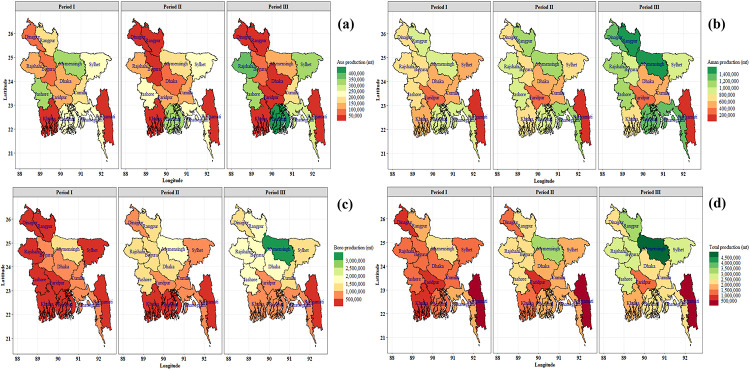
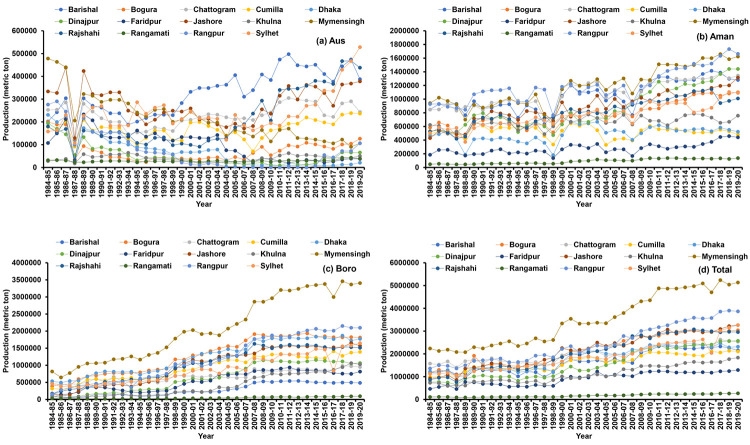
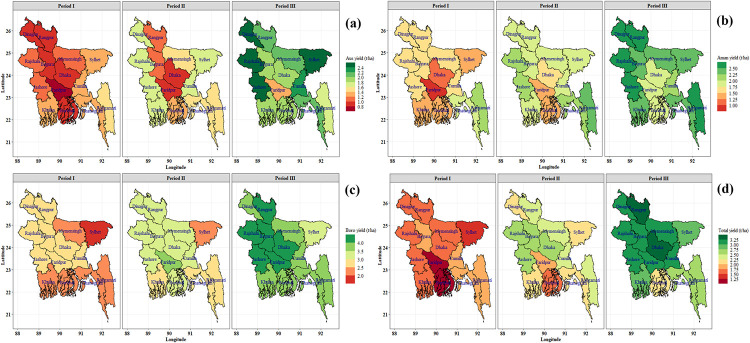
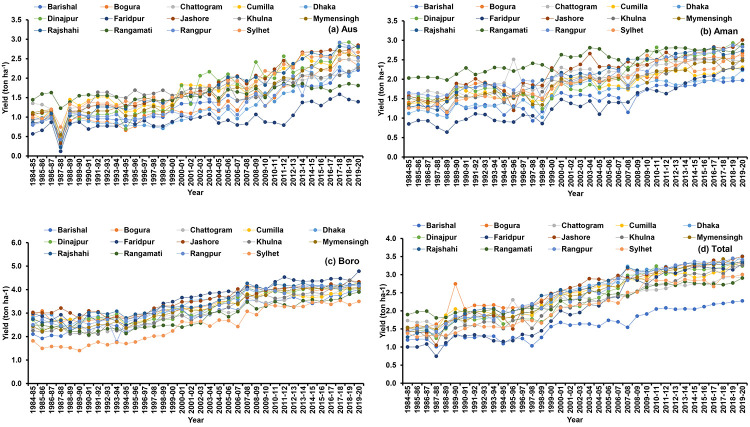
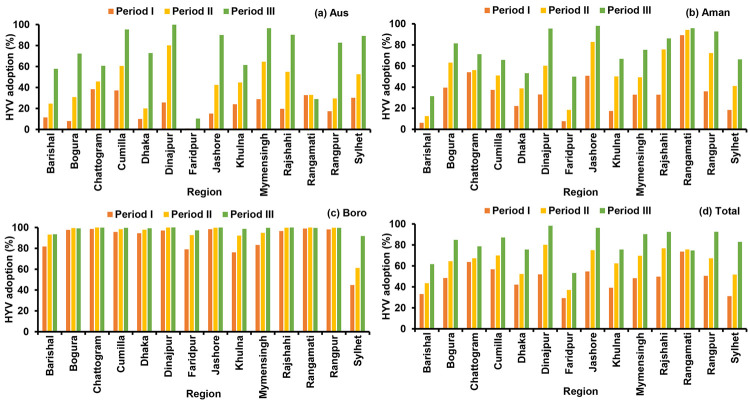
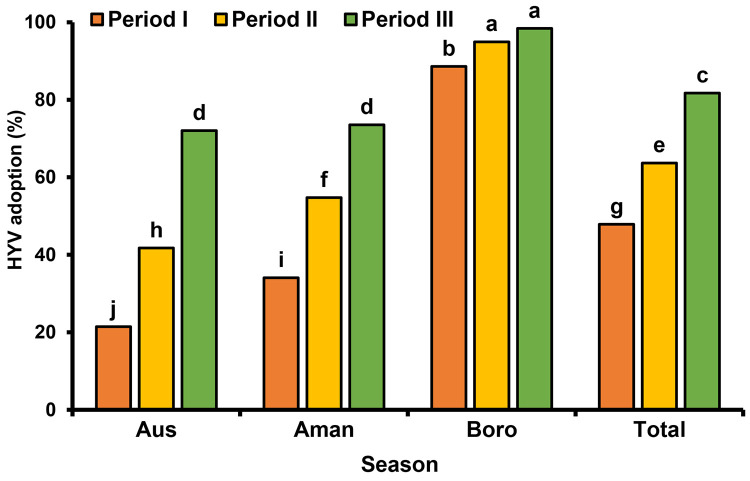
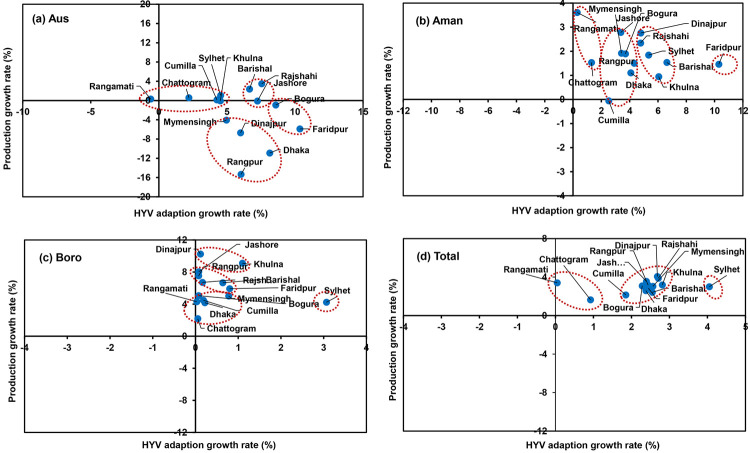
Bangladesh positioned as third rice producing country in the world. In Bangladesh, regional growth and trend in rice production determinants, disparities and similarities of rice production environments are highly desirable. In this study, the secondary time series data of area, production, and yield of rice from 1969-70 to 2019-20 were used to investigate the growth and trend by periodic, regional, seasonal and total basis. Quality checking, trend fitting, and classification analysis were performed by the Durbin-Watson test, Exponential growth model, Cochrane-Orcutt iteration method and clustering method. The production contribution to the national rice production of Boro rice is increasing at 0.97% per year, where Aus and Aman season production contribution significantly decreased by 0.48% and 0.49% per year. Among the regions, Mymensingh, Rangpur, Bogura, Jashore, Rajshahi, and Chattogram contributed the most i.e., 13.9%, 9.8%, 8.6%, 8.6%, 8.2%, and 8.0%, respectively. Nationally, the area of Aus and Aman had a decreasing trend with a -3.63% and -0.16% per year, respectively. But, in the recent period (Period III) increasing trend was observed in the most regions. The Boro cultivation area is increasing with a rate of 3.57% per year during 1984-85 to 2019-20. High yielding variety adoption rate has increased over the period and in recent years it has found 72% for Aus, 73.5% for Aman, and 98.4% for Boro season. As a result, the yield of the Aus, Aman, and Boro seasons has been found increasing growth for most of the regions. We have identified different cluster regions in different seasons, indicating high dissimilarities among the rice production regions in Bangladesh. The region-wise actionable plan should be taken to rapidly adopt new varieties, management technologies and extension activities in lower contributor regions to improve productivity. Cluster-wise, policy strategies should be implemented for top and less contributor regions to ensure rice security of Bangladesh.
Conflict of interest statement
The authors have declared that no competing interests exist.
Figures
References
-
- Rahman M, Islam M, Rahaman M, Sarkar M, Ahmed R, Kabir M. Identifying the threshold level of flooding for rice production in Bangladesh: An Empirical Analysis. J Bangladesh Agric Univ. 2021. doi: 10.5455/jbau.53297 - DOI
-
- Mohammad Fakhrul Islam S, Karim Z. World’s demand for food and water: The consequences of climate change. Desalination -challenges and opportunities. 2020. doi: 10.5772/intechopen.85919 - DOI
-
- USDA (United State of Department of Agriculture). Rice production by country—world agricultural production 2020/2021. World agricultural production. 2020. Available: http://www.worldagriculturalproduction.com/crops/rice.aspx
-
- Kabir MS, Salam M, Islam A, Sarkar MAR, Mamun M, Rahman M, et al.. Doubling rice productivity in Bangladesh: A way to achieving SDG 2 and moving forward. Bangladesh Rice J. 2020;24: 1–47. doi: 10.3329/BRJ.V24I2.53447 - DOI
MeSH terms
LinkOut - more resources
Full Text Sources
Research Materials
