. 2021 Dec 4;187(4):2246-2261.
doi: 10.1093/plphys/kiab217.

Nutrient cycling is an important mechanism for homeostasis in plant cells

Affiliations

Nutrient cycling is an important mechanism for homeostasis in plant cells

Ingo Dreyer. Plant Physiol. .

Abstract

Homeostasis in living cells refers to the steady state of internal, physical, and chemical conditions. It is sustained by self-regulation of the dynamic cellular system. To gain insight into the homeostatic mechanisms that maintain cytosolic nutrient concentrations in plant cells within a homeostatic range, we performed computational cell biology experiments. We mathematically modeled membrane transporter systems and simulated their dynamics. Detailed analyses of 'what-if' scenarios demonstrated that a single transporter type for a nutrient, irrespective of whether it is a channel or a cotransporter, is not sufficient to calibrate a desired cytosolic concentration. A cell cannot flexibly react to different external conditions. Rather, at least two different transporter types for the same nutrient, which are energized differently, are required. The gain of flexibility in adjusting a cytosolic concentration was accompanied by the establishment of energy-consuming cycles at the membrane, suggesting that these putatively "futile" cycles are not as futile as they appear. Accounting for the complex interplay of transporter networks at the cellular level may help design strategies for increasing nutrient use efficiency of crop plants.


Figures

Figure 1
Figure 1
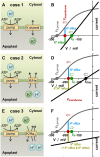
EK and V as adjusted by single K+ transporters and the H+ pump. A and B, Case 1, only K+ channels. The H+ efflux (blue line) is electrically compensated by a K+ influx (green line). The K+ influx shifts EK (green dot) and consequently also Vmembrane (red dot) to more negative voltages. The only stable steady state of the system is EK = V0,pump (grey dot). C and D, Case 2, only K+/H+ symporters. The H+ efflux (blue line) is electrically compensated by the K+/H+ influx (ochre line). The K+ influx shifts EK (green dot), EK/Hs (black dot) and consequently also Vmembrane (red dot) to more negative voltages. The only stable steady state of the system is 0.5⋅(EK + EH) = V0,pump (grey dot), that is, EK = 2⋅V0,pumpEH. E and F, Case 3, only K+/H+ antiporters. In case of electrogenic K+/2H+ antiporters, the pump-mediated H+ efflux (blue line) is electrically compensated by the H+-mediated charge surplus of the antiport (ochre line). The K+ efflux shifts EK (green dot) to more positive voltages and Vmembrane (red dot) to more negative voltages. In general, the steady state of this system is (n−1)−1⋅(nEHEK) = V0,pump (grey dot), that is, EK = nEH – (n−1)⋅V0,pump.
Figure 2
Figure 2
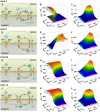
EK and V as adjusted by pairs of K+ transporters and the H+ pump. A–C, Case 4. When electroneutral and electrogenic K+/H+ antiporters act together with the H+-pump, three cycles establish in steady state: (i, green cycle) the electrogenic K+/H+ antiporter releases K+, which is reabsorbed by the electroneutral antiporter; (ii and iii, blue cycles) a proton is released by the electroneutral antiporter (ii), which is reabsorbed by the electrogenic antiporter together with the H+ released by the pump (iii). By modifying the transporter activities, the steady state of EK (B) and V (C) can be freely adjusted within a certain range. For comparison, the respective steady states for the systems with only one K+ transporter-type are indicated: only electrogenic K+/H+ antiporters (gKHa0 = 0; case 3, n >1, cyan lines) and only electroneutral K+/H+ antiporters (gKHa = 0; case 3, n =1, magenta lines). D–F, Case 5. When K+ channels and K+/H+ symporters act together with the H+-pump, two cycles establish in steady state: (i, green cycle) the K+ channel releases K+, which is reabsorbed by the symporter together with the H+ released by the pump (ii, blue cycle). By modifying the transporter activities, the steady state of EK (E) and V (F) can be freely adjusted within a certain range. For comparison, the respective steady states for the systems with only one K+ transporter-type are indicated: only K+/H+ symporters (gKC = 0; case 2, cyan lines) and just K+ channels (gKHs = 0; case 1, magenta lines). G–I, Case 6a. When K+ channels and K+/H+ antiporters act together with the H+-pump, two cycles establish in steady state: (i, green cycle) the K+ channel absorbs K+, which is released by the antiporter; (ii, blue cycle) the H+ released by the pump is absorbed by the antiporter. By modifying the transporter activities, the steady state of EK (H) and V (I) can be freely adjusted within a certain range. For comparison, the respective steady states for the systems with only one K+ transporter-type are indicated: only electroneutral K+/H+ antiporters (gKC = 0; case 3, n =1, cyan lines) and only K+ channels (gKHa0 = 0; case 1, magenta lines). J–L, Case 7a. When K+/H+ symporters and K+/H+ antiporters act together with the H+-pump, three cycles establish in steady state: (i, green cycle) the symporter absorbs K+, which is released by the antiporter; (ii, inner blue cycle) a proton released by the pump is absorbed by the symporter, (iii, outer blue cycle) while another released proton is absorbed by the antiporter. By modifying the transporter activities, the steady state EK (K) and V (L) can be freely adjusted within a certain range. For comparison, the respective steady states for the systems with only one K+ transporter-type are indicated: only electroneutral K+/H+ antiporters (gKHs = 0; case 3, n =1, cyan lines) and only K+/H+ symporters (gKHa0 = 0; case 2, magenta lines).
Figure 3
Figure 3
Accessible EKV ranges for the different K+ transporter combinations exemplarily shown for V0,pump = −200 mV. A, With a single transporter type, only one steady-state condition is achievable, which is independent of the transporter activity (grey dots for the different cases). B–I, The combination of transporter types enables steady states in a wider range (grey areas) by adjusting the activities of the transporters. Nevertheless, there are still limitations. For better orientation, the dashed lines indicate where EK = V. The upper limits in (B, E, F, H, I) are determined by EKnEH−(n−1)⋅V, in (C) by EKV, and in (D, G) by EKEH. The lower limits in (B) are EKEH, in (C, G, H, I) EK ≥ 2⋅VEH, and in (D–F) EKV.
Figure 4
Figure 4
Flexibility of a system with different types of K+ transporters. A, Energized by the H+-ATPase, the K homeostat (consisting of K+ channels, K+/H+ symporters and K+/H+ antiporters, items enclosed by grey dashed line) exhibits four cycles that aggregate in two patterns. A proton that is released by the pump is reabsorbed by the antiporter in exchange for a released K+, which in turn is reabsorbed (i) either by the channel or (ii) together with another proton by the symporter. Colored cycles represent flow of the respective colored ion. B and C, By adjusting the transporter activity, a large range of EKV steady states can be achieved (grey areas). B, With electroneutral antiporters, the range is limited to EKEH. C, With electrogenic antiporters, these limits are further extended to more positive values [EKnEH−(n−1)⋅V]. The dashed lines indicate where EK = V.
Figure 5
Figure 5
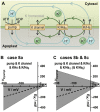
Flexibility of a system with different types of A transporters (case 11). A, Energized by the H+-ATPase, the A homeostat (items enclosed by the grey dashed line), consisting of anion channels and electrogenic H+/anion symporters, exhibits three cycles. Two protons that are released by the pump are reabsorbed by the symporter together with an anion, which in turn is released by the channel. Colored cycles represent flow of the respective colored ion. B, By adjusting the transporter activity, a large range of EAV steady states can be achieved (grey areas). The dashed line indicates where EA = V. C and D, By modifying the transporter activities, the steady state of EA (C) and V (D) can be freely adjusted within a certain range. For comparison, the respective steady states for the systems with only one A transporter-type are indicated: only A channels (gHA = 0; case 9, magenta lines) and only 2H+/1A symporters (gAC = 0; case 10, cyan lines).
Figure 6
Figure 6
Combination of K+ and sugar transport. The K-homeostat (Figure 4) was combined with sugar transport via uniporters (SWEET) and/or proton-coupled symporters. A, In addition to the cycles of the K-homeostat, the presence of both sugar transporter types established proton/sugar cycles, in which a sugar molecule is released by SWEET and reabsorbed by the symporter together with a proton that is released by the pump. Colored cycles represent the flow of the respective colored ion/metabolite. In addition, the metabolization of sugar was also simulated (Δc). B–D, When both sugar transporters are present (case 20), the membrane voltage (B) and the transmembrane sugar gradient (D) can be adjusted by fine-tuning the transporter activities. The altered energetic status of the cell indicated by the steady-state voltage V (B) also affected EK (C). When only one sugar transporter type is present (case 18: only H/C; case 19: only SWEET) the activity of the transporter does not affect V, EK or the sugar gradient in steady state (magenta and cyan lines). E, Case 21. Effect of metabolic sugar production (Δc > 0) or sugar consumption (Δc < 0) on the steady-state membrane voltage V. An effect was only observable in the presence of electrogenic H/C transporters. If only electroneutral SWEETs were present, sugar metabolism did not affect V (cyan line). The white line indicates Δc = 0 and follows the white trajectory in (B).
Figure 7
Figure 7
Combination of homeostats in membrane sandwiches. A, Homeostats at the plasma membrane and at organelle membranes may maintain constant cytosolic nutrient concentrations for a longer time by independently cycling the nutrients across the different membranes. Colored cycles represent flow of the respective colored ion/nutrient. By adjusting the transporter activities, the concentrations and membrane voltages can be fine-tuned. B–E, Nutrients can be sequestered into or remobilized from organelles by shuttling them across the cytosol. Colored arrows represent the net fluxes of the respective colored ion/nutrient. For two different nutrients, the four possibilities of nutrient fluxes are shown. These systems are only temporarily in flux steady state, that is, constant fluxes, as the fluxes change concentrations in the lumen and the apoplast while cytosolic concentrations remain stable. On longer timescales, the systems (B–E) approach the situation displayed in (A).

References

    1. Ahmad I, Maathuis FJM (2014) Cellular and tissue distribution of potassium: physiological relevance, mechanisms and regulation. J Plant Physiol 171: 708–714 - PubMed
    1. Anschütz U, Becker D, Shabala S (2014) Going beyond nutrition: regulation of potassium homoeostasis as a common denominator of plant adaptive responses to environment. J Plant Physiol 171: 670–687 - PubMed
    1. Beilby M., Coster HG. (1979) The action potential in Chara corallina III. The Hodgkin-Huxley parameters for the plasmalemma. Funct Plant Biol 6: 337
    1. Beilby MJ (2007) Action potential in Charophytes. Int Rev Cytol 257: 43–82 - PubMed
    1. Beilby MJ, Al Khazaaly S (2016) Re-modeling Chara action potential: I. From Thiel model of Ca2+ transient to action potential form. AIMS Biophys 3: 431–449

Publication types

MeSH terms

Substances

LinkOut - more resources