. 2021 Dec 9;184(25):6119-6137.e26.
doi: 10.1016/j.cell.2021.11.017.

Microenvironment drives cell state, plasticity, and drug response in pancreatic cancer

Affiliations

Microenvironment drives cell state, plasticity, and drug response in pancreatic cancer

Srivatsan Raghavan et al. Cell. .

Abstract

Prognostically relevant RNA expression states exist in pancreatic ductal adenocarcinoma (PDAC), but our understanding of their drivers, stability, and relationship to therapeutic response is limited. To examine these attributes systematically, we profiled metastatic biopsies and matched organoid models at single-cell resolution. In vivo, we identify a new intermediate PDAC transcriptional cell state and uncover distinct site- and state-specific tumor microenvironments (TMEs). Benchmarking models against this reference map, we reveal strong culture-specific biases in cancer cell transcriptional state representation driven by altered TME signals. We restore expression state heterogeneity by adding back in vivo-relevant factors and show plasticity in culture models. Further, we prove that non-genetic modulation of cell state can strongly influence drug responses, uncovering state-specific vulnerabilities. This work provides a broadly applicable framework for aligning cell states across in vivo and ex vivo settings, identifying drivers of transcriptional plasticity and manipulating cell state to target associated vulnerabilities.

Keywords: liver metastases; pancreatic cancer; patient-derived organoid models; plasticity; single-cell RNA-sequencing; transcriptional states; tumor heterogeneity; tumor microenvironment.


Conflict of interest statement

Declaration of interests B.M.W. reports research support from Celgene and Eli Lilly and consulting for BioLineRx, Celgene, G1 Therapeutics, and GRAIL. W.C.H. is a consultant for Thermo Fisher, Solasta Ventures, MPM Capital, Tyra Biosciences, iTeos, Frontier Medicines, Function Oncology, KSQ Therapeutics, Jubilant Therapeutics, RAPPTA Therapeutics, and Paraxel. A.K.S. reports compensation for consulting and/or SAB membership from Merck, Honeycomb Biotechnologies, Cellarity, Repertoire Immune Medicines, Ochre Bio, Third Rock Ventures, Hovione, Relation Therapeutics, FL82, and Dahlia Biosciences. A.J.A. has consulted for Oncorus, Arrakis Therapeutics, and Merck & Co. and has research funding from Mirati Therapeutics, Syros, Deerfield, and Novo Ventures that are unrelated to this project. S.R.M. is a founder of Travera. S.R. has equity in Amgen. J.M.C. has received research funding from Merck, Tesaro, AstraZeneca, Bayer, and Esperas Pharma; has served as a consultant to Bristol Myers Squibb; and has received travel funding from Bristol Myers Squibb. A.R. is an employee of AstraZeneca and an equity holder in Celsius Therapeutics and NucleAI. Y.Y.L. reports equity from g.Root Biomedical Services. A.D. Cherniack reports research support from Bayer. R.J.S reports research support from Merck and consulting and/or SAB membership for Bristol Myers Squibb, Merck, Novartis, and Pfizer. G.I.S. reports sponsored research support from Eli Lilly, Merck KGaA/EMD-Serono, Merck, and Sierra Oncology and has served on advisory boards for Pfizer, Eli Lilly, G1 Therapeutics, Roche, Merck KGaA/EMD-Serono, Sierra Oncology, Bicycle Therapeutics, Fusion Pharmaceuticals, Cybrexa Therapeutics, Astex, Almac, Ipsen, Bayer, Angiex, Daiichi Sankyo, Seattle Genetics, Boehringer Ingelheim, ImmunoMet, Asana, Artios, Atrin, Concarlo Holdings, Syros, Zentalis, CytomX Therapeutics, Blueprint Medicines, and Kymera Therapeutics. T.J. is a member of the Board of Directors of Amgen and Thermo Fisher Scientific; a co-Founder of Dragonfly Therapeutics and T2 Biosystems; serves on the Scientific Advisory Board of Dragonfly Therapeutics, SQZ Biotech, and Skyhawk Therapeutics; and is the President of Break Through Cancer. None of these affiliations represent a conflict of interest with respect to the design or execution of this study or interpretation of data presented in this manuscript. T.J.’s laboratory currently also receives funding from the Johnson & Johnson Lung Cancer Initiative and The Lustgarten Foundation for Pancreatic Cancer Research, but this funding did not support the research described in this manuscript. K.N. reports research support from Revolution Medicines, Evergrande Group, Pharmavite, and Janssen; is a member of SABs for SeaGen, BiomX, and Bicara Therapeutics; and has consulted for X-Biotix Therapeutics and Redesign Health. A.K.S., P.S.W., A.W.N., S.R., W.C.H., A.J.A., B.W.M., and J.G.R. have filed a patent (Publication number WO/2021/081491; International application number PCT/US2020/057342) related to this work.

Figures
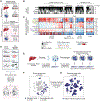
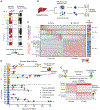
Figure 1.
Figure 1.. Assessing transcriptional states in patient tumors and cancer models
(A) Precision medicine pipelines assess model fidelity for genetics but typically do not evaluate RNA states. (B) Alterations in PDAC driver genes across primary resections (TCGA), metastatic biopsies (Panc-Seq), and organoid and cell line (CCLE) models. Grey indicates where genomic data were not available. P-values by Fisher’s exact test. (C) Comparison of PDAC expression signatures from bulk RNA-sequencing in primary and metastatic tumors, cell lines, and organoid models in (B). Rows are clustered, columns are sorted by average basal-classical score difference. P-values indicate differences between patient tumors, cell lines, and organoids by ANOVA. (D) Schematic of contributors to RNA state that may lead to differences between in vivo and ex vivo expression patterns. (E) Metastatic patient samples were collected via core needle biopsies and dissociated. Biopsy cells were allocated for scRNA-seq, and patient-matched organoids were developed with downstream serial scRNA-seq sampling. (F and G) t-distributed stochastic neighbor embedding (t-SNE) for biopsy (F) and matched patient-derived organoid cells (G). See also Figure S1; Tables S1 and S2.
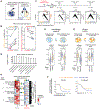
Figure 2.
Figure 2.. An intermediate co-expressor state bridges basal and classical phenotypes
(A) Signature scores (rows) for bulk derived expression subtypes in malignant cells (columns). (B) Heatmaps depict the expression of scBasal and scClassical expression programs and highlight a co-expressing cell population. (C) Variation in EMT and IFN response signature expression within malignant cells that have scBasal expression. (D) The intermediate co-expressor (“IC”) expression program is enriched in co-expressing cells. Enrichment adjusted P-values (hypergeometric test) for EMT, KRAS, and AKT gene sets are indicated at right in (B) and (D). (E) Gene set enrichment analysis for the 115 genes specific to the intermediate co-expressor program. (F) Malignant cell state diagram for PDAC. ScBasal-scClassical commitment score (x axis) and IC score (y axis). (G) Frequency of co-expressing cells is related to increased mixing of scBasal and scClassical cell populations. Log ratio of % scBasal and scClassical cells in each sample (x axis; dotted line at 0 indicates equal percentages of scBasal and scClassical cells) versus their % IC cells (y axis). (H) Multiplex immunofluorescence analysis identifies co-expressing cells in matched metastatic samples. White box indicates region for co-expression insets at bottom. Scale bar represents 10 μm. See also Figures S2, S3, and S4; Table S3.
Figure 3.
Figure 3.. Organoid culture selects against the scBasal state with transcriptional evolution over time
(A) Outgrowth and similarity between organoids and matched biopsy samples. Red fill indicates successful early (Early) and long-term (Estab.) culture. Right gray scale indicates similarity between each biopsy-early organoid pair for inferred CNVs (genotype, Geno.) or cell state (State). P-value for Geno. versus State differences determined by Student’s t test. (B) Schematic for matched in vivo malignant cell and organoid comparison. (C) Single-cell and average expression of malignant programs (top) and organoid-specific genes (bottom) in biopsy cells and matched, early passage organoid cells (n = 13 models). P-values determined by Student’s t test. Parenthetical P-values (left) indicate hypergeometric test for pathway enrichments. (D) Swimmer’s plot depicting organoid state evolution in culture. Pie charts indicate the fraction of cell states at each time point. (E) Clonal fractions from KRAS-amplified PANFR0575 biopsy (gray) and organoid (red) cells. Clone A (green) is present in both. Heatmap shows expression of scBasal and scClassical states in clone A from both contexts. See also Figure S5.
Figure 4.
Figure 4.. Modulation of the media microenvironment allows recovery of scBasal states
(A) Strategies to recover scBasal expression in different media conditions. (B) Tied dot plot for sample average scBasal score (left) and organoid-specific score (right) in the indicated conditions. Color outline indicates sample identity. P-value compares single cell distributions within models and was calculated by Student’s t test. (C) Cell state diagrams for organoid cells cultured in minimal media. P-values are for that time point versus the complete media condition and compare B/C commitment (top) and IC scores (right) by ANOVA followed by Tukey’s HSD. (D and E) Violin plots depict scBasal and organoid-specific expression scores in PANFR0562 organoid cells (D) or CFPAC1 cell line (E) after 6 days in Complete organoid medium or in “Cell line” medium. P-values for differences were calculated by Student’s t test. (F) CFPAC1 cell line growth rate-adjusted dose response curves to SN-38 and paclitaxel after culture in standard “Cell line” medium or in Complete organoid medium. Points are the mean ± SD of 3 technical replicates. Curves are representative of 2 independent experiments. (G) Significant pathway enrichments (P-value < 10−12) for top in vivo differentially expressed genes (143 genes). (H) Average expression in biopsy (left) and organoid cells (right) for the 143 top in vivo differentially expressed genes (rows), organized by originating tumor’s overall transcriptional subtype (colored dots). Parenthetical P-values (left) for enrichment of indicated pathways are by hypergeometric test. Overall biopsy versus organoid expression difference is determined by Student’s t test (bottom). P-values computed by one-way ANOVA followed by Tukey’s HSD (center) are for differences in average expression between biopsy transcriptional subtypes (*P-value < 10−8; **P-value < 10−16). See also Figure S5; Tables S4 and S5.
Figure 5.
Figure 5.. Distinct mesenchymal phenotypes and transcriptional state-specific immune heterogeneity exist in the liver metastatic microenvironment
(A) t-SNE visualization of non-malignant cells identified in the metastatic microenvironment, abbreviations as in Figure S1J (TAM, tumor associated macrophage). (B) Expression of Fibroblast-like (PC2 low) and Pericyte-like (PC2 high) mesenchymal (Mes.) cell programs across different metastatic sites (top). (C) Density plots for mesenchymal cell phenotype score in single cells from our metastatic cohort (top) or previously published PDAC bulk RNA-seq profiles (bottom), fill indicates anatomic site. P-value determined by Student’s t test (top) or by ANOVA followed by Tukey’s HSD (bottom). (D) Summary of mesenchymal phenotypes in primary versus liver metastatic PDAC. (E) Correlation between microenvironment diversity (Simpson’s index, x axis) and the average malignant scBasal-scClassical commitment score (y axis) for each scRNA-seq sample. (F) Correlation between TME diversity as inferred by immunogenic signature score (x axis) versus average tumor scBasal-scClassical commitment score (y axis) in primary and metastatic bulk RNA-seq samples. (G and H) Sample-level (columns) variation in Simpson’s index (G, dot plot), average malignant scBasal-scClassical (G, top heat bar) and IC (G, bottom heat bar) expression, and fraction of non-malignant cell types (H). Samples were clustered and ordered within metastatic site (liver versus other) by their fractional representation of cell types. Dots indicate top statistically significant cell type frequency differences calculated using a Kruskal-Wallis test with multiple hypothesis correction. (I) Boxplots compare cell type fractions between the scBasal predominant tumors with low diversity (PANFR0593, 575, 545) and all others. P-value determined by Student’s t test. (J) Summary of associations between microenvironmental diversity, non-malignant cell types, and malignant cell state. See also Figure S6; Table S2.
Figure 6.
Figure 6.. Tumor state-specific factors rescue malignant transcriptional heterogeneity and reveal state-specific drug sensitivities
(A) Schematic describing microenvironmental inputs to tumor cell state in vivo (left, “Metastatic environment”) versus ex vivo (center, “Organoid environment”) and a strategy to recover malignant transcriptional heterogeneity ex vivo (right, “State-supportive environment”). (B) Differential expression (Wilcoxon rank sum test) of secreted factors between in vivo tumor cells scored as scBasal versus scClassical (x axis) and IC malignant cells versus the rest (y axis). State-specific genes that pass significance after multiple hypothesis correction (p < 0.05) are colored by their group association. (C and D) Cell state diagrams with marginal density plots (C) and growth rate-adjusted dose response curves to gemcitabine and SN-38 (D) for organoid model PANFR0562 cultured for 3 weeks in control medium (OWRNA) or in control medium with TGF-β. P-values in (C) for group differences between B/C commitment (top) and IC scores (right) were calculated by ANOVA followed by Tukey’s HSD. In (D), points are the mean ± SD of 3 technical replicates. Curves are representative of 2 independent experiments. (E) Cell state diagram time series for PANFR0562 organoids cultured with TGF-β or after TGF-β removal. (F) Growth rate-adjusted dose response curves to gemcitabine and paclitaxel for models in (E). Points are the mean ± SD of 3 technical replicates. (G) State-specific drug sensitivities in isogenic organoid model pairs skewed toward scBasal or scClassical states by altering media formulation. Points are the mean ± SEM of 2–6 biologic replicates for the difference in growth rate-corrected Area Over the Curve (AOC) between each scBasal-scClassical model pair. See also Figure S7; Tables S5, S6, and S7.
Figure 7.
Figure 7.. Malignant transcriptional states respond to TME alterations in organoid models and in vivo
(A) Differential expression (Wilcoxon rank sum test) of secreted factors by non-malignant cells (paracrine) grouped by their sample-averaged malignant cell expression state in scBasal and scClassical (x axis) tumors and IC biopsies and the rest (y axis). State-specific genes that pass significance after multiple hypothesis correction (p < 0.05) are colored by their group association. (B) Dot plot for state-specific significant differentially expressed paracrine factors (rows) by subtype-specific non-malignant cell types (columns). Dot size represents that cell type’s fraction within tumors of each subtype, and fill color indicates average expression. Only cell types with a fractional representation > 5% from each subtype are visualized. (C) Density plots of IFN response score (top) and IC score (bottom) in control organoid cells and after addition of IFNγ for 6 days. P-values were calculated by Student’s t test. (D) Biopsy samples from distinct metastatic sites (liver, dark gray; lung, light gray) in the same patient (PANFR0473) demonstrate co-variation in T cell IFNG expression (top), malignant cell IFN response score (middle), and malignant IC score (bottom). P-values for density plot differences were calculated by Student’s t test. (E) Biopsy samples from the same lesion pre- and post-immunotherapy (checkpoint inhibitor plus a macrophage-targeting agent; pre-, PANFR0489, pink; post-, PANFR0489R, blue) demonstrate coordinated changes with treatment in T cell IFNG expression (top), malignant cell IFN response score (middle), and malignant IC score (bottom). P-values for density plot differences were calculated by Student’s t test. (F) Heatmap for malignant cell state shifts from samples in (E). See also Figure S7; Tables S5, S6, and S7.

References

    1. Abo RP, Ducar M, Garcia EP, Thorner AR, Rojas-Rudilla V, Lin L, Sholl LM, Hahn WC, Meyerson M, Lindeman NI, et al. (2015). BreaKmer: detection of structural variation in targeted massively parallel sequencing data using kmers. Nucleic Acids Res. 43, e19. - PMC - PubMed
    1. Aguirre AJ, Nowak JA, Camarda ND, Moffitt RA, Ghazani AA, Hazar-Rethinam M, Raghavan S, Kim J, Brais LK, Ragon D, et al. (2018). Realtime Genomic Characterization of Advanced Pancreatic Cancer to Enable Precision Medicine. Cancer Discov. 8, 1096–1111. - PMC - PubMed
    1. Alonso-Curbelo D, Ho YJ, Burdziak C, Maag JLV, Morris JP 4th, Chandwani R, Chen HA, Tsanov KM, Barriga FM, Luan W, et al. (2021). A gene-environment-induced epigenetic program initiates tumorigenesis. Nature 590, 642–648. - PMC - PubMed
    1. Aung KL, Fischer SE, Denroche RE, Jang GH, Dodd A, Creighton S, Southwood B, Liang SB, Chadwick D, Zhang A, et al. (2018). Genomics-Driven Precision Medicine for Advanced Pancreatic Cancer: Early Results from the COMPASS Trial. Clin. Cancer Res 24, 1344–1354. - PMC - PubMed
    1. Bailey P, Chang DK, Nones K, Johns AL, Patch AM, Gingras MC, Miller DK, Christ AN, Bruxner TJ, Quinn MC, et al.; Australian Pancreatic Cancer Genome Initiative (2016). Genomic analyses identify molecular subtypes of pancreatic cancer. Nature 531, 47–52. - PubMed

Publication types

Substances