. 2021 Dec 16;81(24):5025-5038.e10.
doi: 10.1016/j.molcel.2021.11.018. Epub 2021 Dec 9.

Structure, mechanism, and inhibition of Hedgehog acyltransferase

Affiliations

Structure, mechanism, and inhibition of Hedgehog acyltransferase

Claire E Coupland et al. Mol Cell. .

Abstract

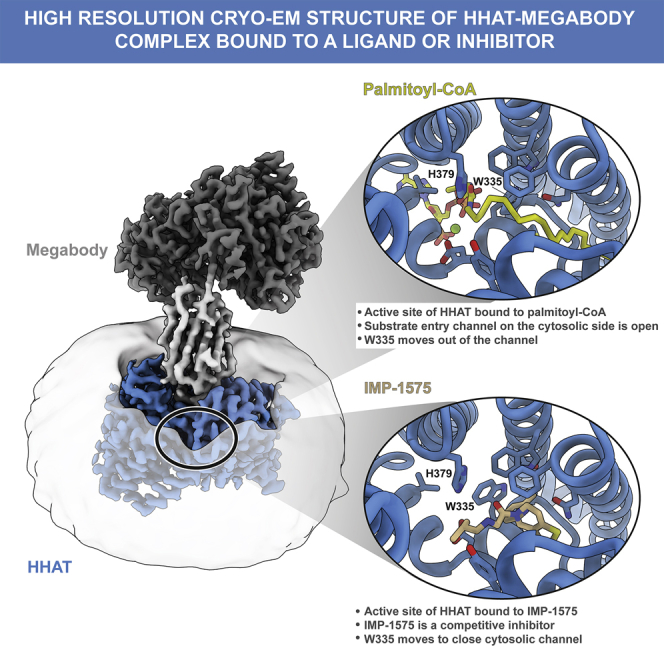
The Sonic Hedgehog (SHH) morphogen pathway is fundamental for embryonic development and stem cell maintenance and is implicated in various cancers. A key step in signaling is transfer of a palmitate group to the SHH N terminus, catalyzed by the multi-pass transmembrane enzyme Hedgehog acyltransferase (HHAT). We present the high-resolution cryo-EM structure of HHAT bound to substrate analog palmityl-coenzyme A and a SHH-mimetic megabody, revealing a heme group bound to HHAT that is essential for HHAT function. A structure of HHAT bound to potent small-molecule inhibitor IMP-1575 revealed conformational changes in the active site that occlude substrate binding. Our multidisciplinary analysis provides a detailed view of the mechanism by which HHAT adapts the membrane environment to transfer an acyl chain across the endoplasmic reticulum membrane. This structure of a membrane-bound O-acyltransferase (MBOAT) superfamily member provides a blueprint for other protein-substrate MBOATs and a template for future drug discovery.

Keywords: Hedgehog acyl transferase; Sonic Hedgehog signaling; cryo-EM structure; drug; heme; integral membrane protein; membrane-bound O-acyltransferase; molecular dynamics simulations; palmitoyl co enzyme A; small molecule inhibitor.


Conflict of interest statement

Declaration of interests E.W.T. is a founder and shareholder in Myricx Pharma. All of the other authors declare no competing interests.

Figures

None
Graphical abstract
Figure 1
Figure 1
Structure of human HHAT (A) Cryo-EM map and ribbon representation of the HHAT-megabody 177 complex at 2.69-Å resolution. HHAT is represented in blue, the megabody scaffold in dark gray, and the nanobody in light gray. The detergent micelle is depicted. (B) Schematic of HHAT in rainbow coloring (blue: N terminus, red: C terminus). (C) Illustration of human HHAT. The structurally conserved MBOAT core is blue. The variable N (orange) and C (green) termini are highlighted. The heme-B group is depicted in magenta stick representation, with its cryo-EM map shown. (D) Schematic of the heme-B interactions with HHAT residues. (E–G) Close-up views of the HHAT heme-B binding site. (F) and (G) are colored as in (C). The sequence conservation (purple: conserved to green: variable) is mapped onto the structure in (G). (H) UV-vis spectra of HHAT wild-type (black) and HHAT-C324A (red). Wild-type HHAT shows the typical spectrum for a penta-coordinate thiolate Fe(III) heme with the split Soret band (at 383 and 411 nm) and the 4 Q bands (I: 642 nm, II: 586 nm, III: 537 nm, and IV: 511 nm). (I) Time-averaged solvent density (light blue surface) across 5 × 200 ns atomistic simulations of HHAT colored as in (C).
Figure 2
Figure 2
Structure of HHAT in complex with its co-factor analog nhPalm-CoA (A) Illustration of HHAT with bound nhPalm-CoA (yellow) and a palmitate molecule (purple) that forms part of the Palm-CoA binding site. The 2.69-Å resolution cryo-EM map for selected molecules is shown. (B) Detailed interactions of the Palm-CoA binding site. Hydrogen bonds are depicted in blue, the magnesium ion is in green. (C–F) Close-up views of the Palm-CoA binding site. (G) Structural superposition of HHAT with the DGAT-oleoyl-CoA complexes (PDB: 6VZ1 and 6VP0, respectively) and the ACAToleoyl-CoA (PDB: 6P2J) complexes, with only the acyl-CoA moieties depicted. The HHAT solvent-accessible surface is shown. Lipid and CoA moieties of the acyl-CoA substrates are circled. The red arrow indicates the conformational flexibility of the CoA substrate acyl chains. The close-up in the right panel highlights the different conformations of the acyl chains viewed from the ER luminal side. The HHAT palmitate binding pocket is marked with a dotted line. The terminal carbon atom of the acyl-CoA substrate is depicted with an asterisk for clarity. (H) Time-averaged density of lipid phosphate beads (gray isomesh) across 10 × 15-μs CG simulations of HHAT overlayed with the atomistic HHAT structure, colored as in (A). HHAT is depicted as a cut surface through the center of the protein to indicate the respective positions of the deformations.
Figure 3
Figure 3
Structure of HHAT in complex with inhibitor IMP-1575 (A) Structure of HHAT in complex with the inhibitor IMP-1575. The Palm-CoA binding pocket calculated with the program CAVER is depicted in yellow, the bound heme moiety is in magenta, and IMP-1575 is highlighted in stick representation. View is rotated 90° around the x axis compared to Figure 1C. (B) Close-up view of the IMP-1575 binding site. IMP-1575 binds in the active site in close proximity to the catalytic His379. The cryo-EM map of the HHAT-IMP-1575 complex is shown as pink chicken wire. (C) Superposition of the HHAT-nhPalm-CoA (marine blue) and HHAT-IMP-1575 complexes (cyan). The Palm-CoA binding pocket is shown in yellow. The arrows indicate the conformational changes induced by inhibitor binding. IMP-1575 occludes Palm-CoA binding. Orientation is as in (B). (D and E) Structure-function analysis of HHAT mutants. A ribbon representation of HHAT with residues mutated in spheres is shown in (D). nhPalm-CoA (yellow), heme (pink), palmitate (dark purple), and cholesterol (red) are shown in stick representation. Activities of HHAT mutants relative to wild-type HHAT, measured by acyl-cLIP assay. n = 2 (quadruplicates), means ± SEMs between replicates; black dots are shown in (E) and represent means of replicates.
Figure 4
Figure 4
HHAT dynamics in simulations (A) Distance between Trp335-Cη2 and Phe372-Cα atoms in atomistic MD simulations of HHAT in the apo, Palm-CoA-bound, and inhibited/heme-only states (5 × 200 ns of each). (B) Snapshots showing the conformation of Trp335 at the start (“tunnel open”) and end (“tunnel blocked”) of a simulation of HHAT apo. Water atoms are shown as red spheres, overlaid with Palm-CoA (yellow sticks) to indicate the relative position within HHAT (transparent cylinders). (C and D) Close-up view of the Trp335-Cη2 to Phe372-Cα distance (C) and (D) a sphere (4 Å radius) positioned at the center of the geometry of Trp335/Phe372 Cα atoms, used to assess the Trp335 gating mechanism in (E). MDAnalysis was used to calculate the position of the sphere at each time point in the trajectory according to the updated center of geometry of the Trp335/Phe372 Cα. (E) Number of waters within the sphere (black) and Trp335/Phe372 distance (blue) versus time. The rolling mean is shown as an opaque line. (F–H) Dynamics of the HHAT reaction center. (F) Angle of the Asp339 side chain (defined as the angle between a vector formed by the Cα and Cγ atoms of Asp339 with respect to a plane formed by the Cα atoms of Met334, Asp339, and Leu346) across simulations of HHAT in apo, Palm-CoA-bound, Palm-CoA plus heme, and inhibited/heme states. (G) Overlay of the start (light cyan) and end (cyan) snapshots from a simulation of HHAT in the apo state. The angle between the side chain vector (blue) and plane (pink) is indicated. (H) The pKa of Asp339 and His379 across simulations of HHAT in the apo, Palm-CoA, Palm-CoA plus heme, and inhibited/heme-only simulations as calculated using pKa-traj. Red dashed lines indicate standard pKa values of histidine or aspartate residues. Error bars indicate the standard error of the mean between replicates.
Figure 5
Figure 5
A potential sterol-binding site adjacent to the luminal SHH binding cavity (A) Illustration of HHAT with selected lipids and substrates highlighted and depicted and drawn with the final cryo-EM map. View and color coding is as in Figure 2. (B) Close-up view of the potential sterol-binding site. The final cryo-EM (orange) is suggestive of a cholesterol or similar sterol molecule. (C) Comparison of the different lipids fitted into the sterol map shown in (B).
Figure 6
Figure 6
A luminal access cavity for SHH (A) Illustration of the HHAT-MB177 complex. HHAT is blue, MB177 is gray, with the complementary determining regions (CDRs) colored salmon (CDR1), red (CDR2), and dark red (CDR3). Active site HHAT residues His379 and Asp339 are highlighted in stick representation. The active site entry tunnel, which is mainly blocked by MB177-CDR3, protrudes deeply into HHAT. (B and C) Surface representation of HHAT, with MB177 shown in black ribbon. Sequence conservation (B) and electrostatic potential (C) (from ±8 kT/eV) are mapped onto the solvent-accessible HHAT surface. The active site entry tunnel is outlined in yellow. Orientation is 90° rotated around the y axis. (D) Structure of the HHAT-MB169 complex. HHAT is shown as a blue surface and NB169 is shown in green. NB177 is shown superimposed and colored as in (A) and (B) (using HHAT as template). The orientation is as in (B). A close-up of CDR3 is shown in the box, revealing the close structural similarity of the Cα backbone. (E) Sequence alignment of nanobodies NB177 and NB169 with the CDRs colored as in (A). The overall sequence identity is 77.4%, with only 27.8% identity in the CDRs (CDR1: 22.2%, CDR2: 40.0%, CDR3: 23.5%). (F) Acyl-cLIP assay to test SHH palmitoylation. Dose-response curves of nanobodies and megabodies inhibiting SHH palmitoylation by HHAT. The IC50 of the nanobodies is below the detection limit of the assay ([HHAT] ≈10 nM). n = 1 (triplicates), means ± SEMs. (G) Multicycle kinetics measurement of the ShhN-HHAT interaction with real-time sensorgrams for different ShhN concentrations. (H) ShhN binding is abolished in a SHH construct missing the first 15 residues, or in the presence of MB169 and MB177. (I and J) HHAT mutants E59R and Y382A/Y384A, located in the luminal binding cavity, cannot bind SHH (I), and SHH binding is reduced by 50% in the absence of Palm-CoA and completely abolished in the presence of inhibitor IMP-1575 (J).
Figure 7
Figure 7
Model for HHAT-mediated palmitoylation of SHH Without any substrate bound, HHAT adopts a “closed” conformation, with Trp335 blocking the Palm-CoA-binding pocket (top left panel). Binding of Palm-CoA from the cytosolic side leads to a rearrangement of the active site involving residues His379 and Asp339 and primes HHAT for SHH binding (top right panel). The SHH N terminus binds HHAT from the luminal cavity to access the active site (bottom right panel). SHH binding may be supported by binding the C-terminal SHH-cholesterol moiety to a potential sterol-binding pocket located adjacent to the luminal cavity. Once acyl transfer to SHH occurs, palmitoylated SHH detaches from HHAT via either lateral exit into the membrane and/or supporting secreted and membrane proteins (e.g., Scube2, Dispatched) (bottom left panel).

References

    1. Abdel-Salam G.M.H., Mazen I., Eid M., Ewida N., Shaheen R., Alkuraya F.S. Biallelic novel missense HHAT variant causes syndromic microcephaly and cerebellar-vermis hypoplasia. Am. J. Med. Genet. A. 2019;179:1053–1057. - PubMed
    1. Adams P.D., Afonine P.V., Bunkóczi G., Chen V.B., Davis I.W., Echols N., Headd J.J., Hung L.W., Kapral G.J., Grosse-Kunstleve R.W., et al. PHENIX: a comprehensive Python-based system for macromolecular structure solution. Acta Crystallogr. D Biol. Crystallogr. 2010;66:213–221. - PMC - PubMed
    1. Afonine P.V., Poon B.K., Read R.J., Sobolev O.V., Terwilliger T.C., Urzhumtsev A., Adams P.D. Real-space refinement in PHENIX for cryo-EM and crystallography. Acta Crystallogr. D Struct. Biol. 2018;74:531–544. - PMC - PubMed
    1. Agha Z., Iqbal Z., Azam M., Ayub H., Vissers L.E., Gilissen C., Ali S.H., Riaz M., Veltman J.A., Pfundt R., et al. Exome sequencing identifies three novel candidate genes implicated in intellectual disability. PLoS ONE. 2014;9:e112687. - PMC - PubMed
    1. Aricescu A.R., Lu W., Jones E.Y. A time- and cost-efficient system for high-level protein production in mammalian cells. Acta Crystallogr. D Biol. Crystallogr. 2006;62:1243–1250. - PubMed

Publication types

MeSH terms

LinkOut - more resources