. 2022 Jan 6;82(1):140-158.e12.
doi: 10.1016/j.molcel.2021.11.016. Epub 2021 Dec 9.

MYC assembles and stimulates topoisomerases 1 and 2 in a "topoisome"

Affiliations

MYC assembles and stimulates topoisomerases 1 and 2 in a "topoisome"

Subhendu K Das et al. Mol Cell. .

Abstract

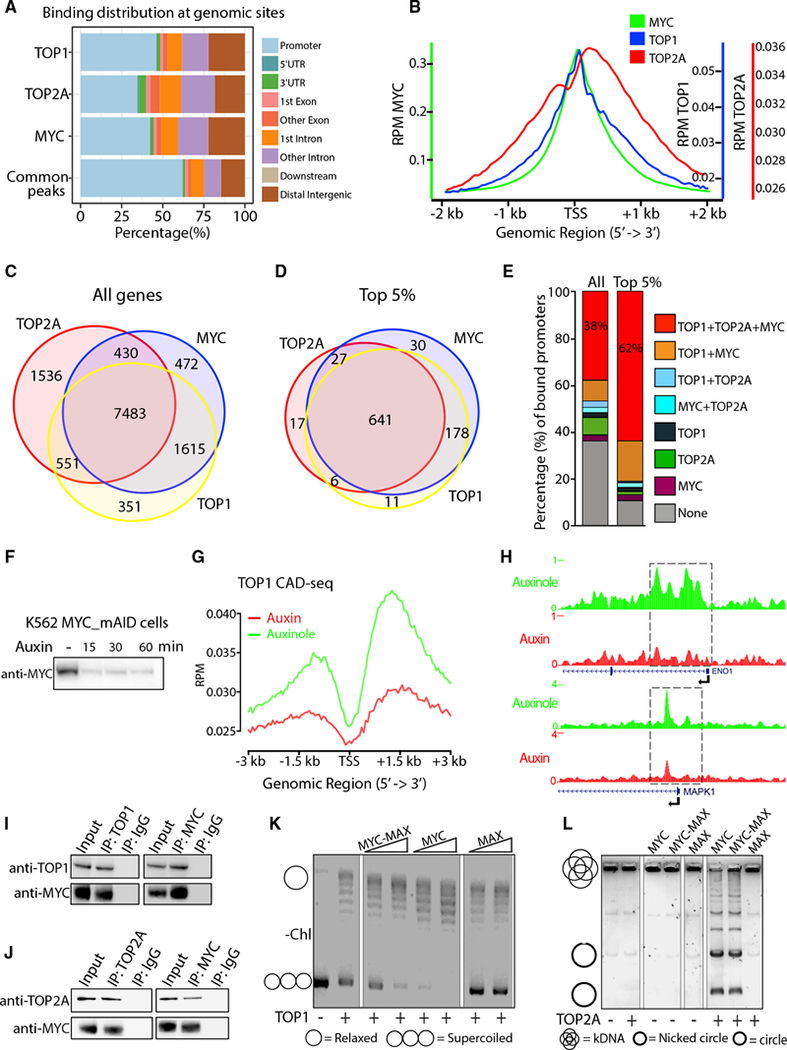
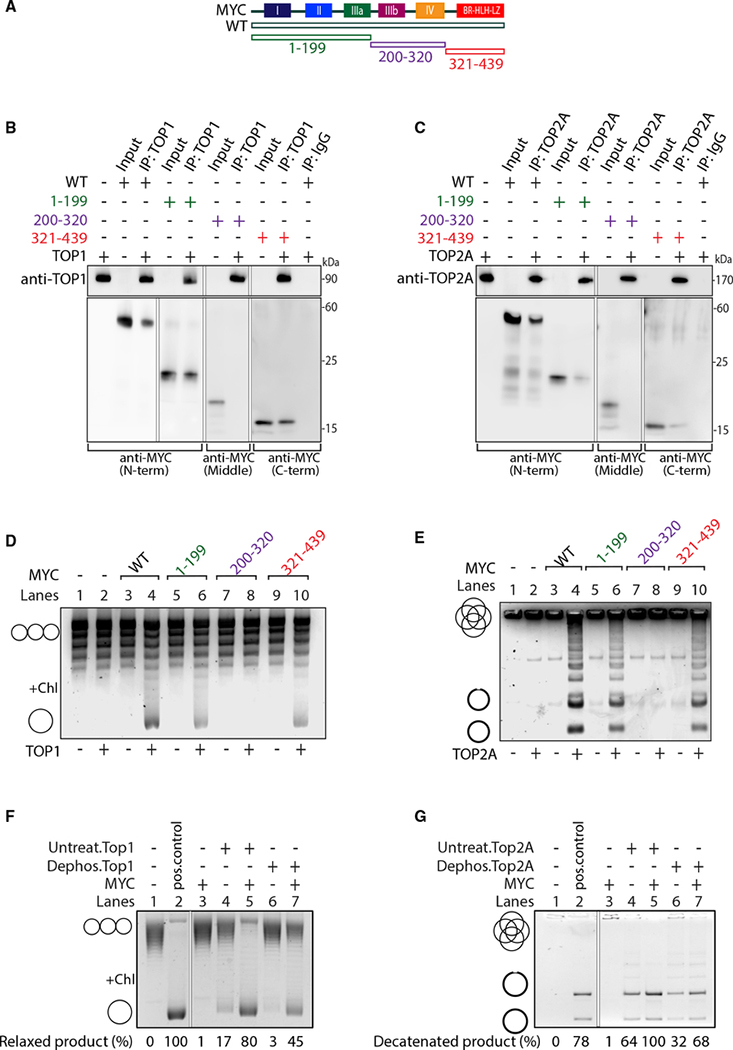
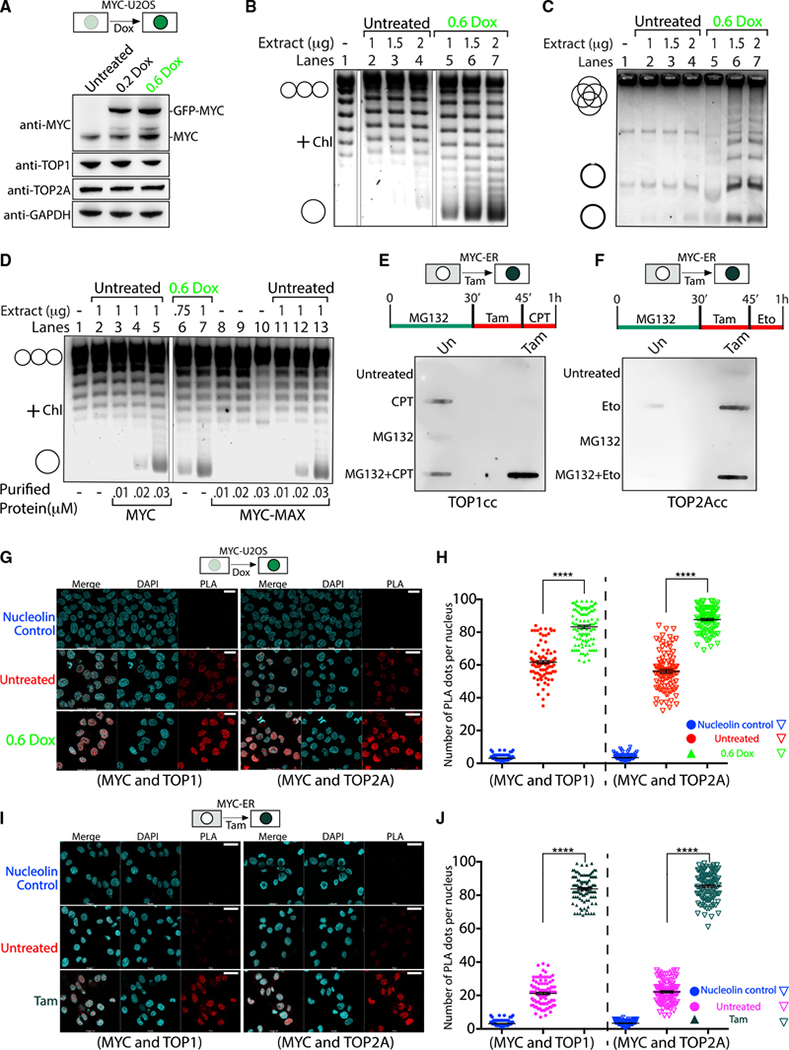
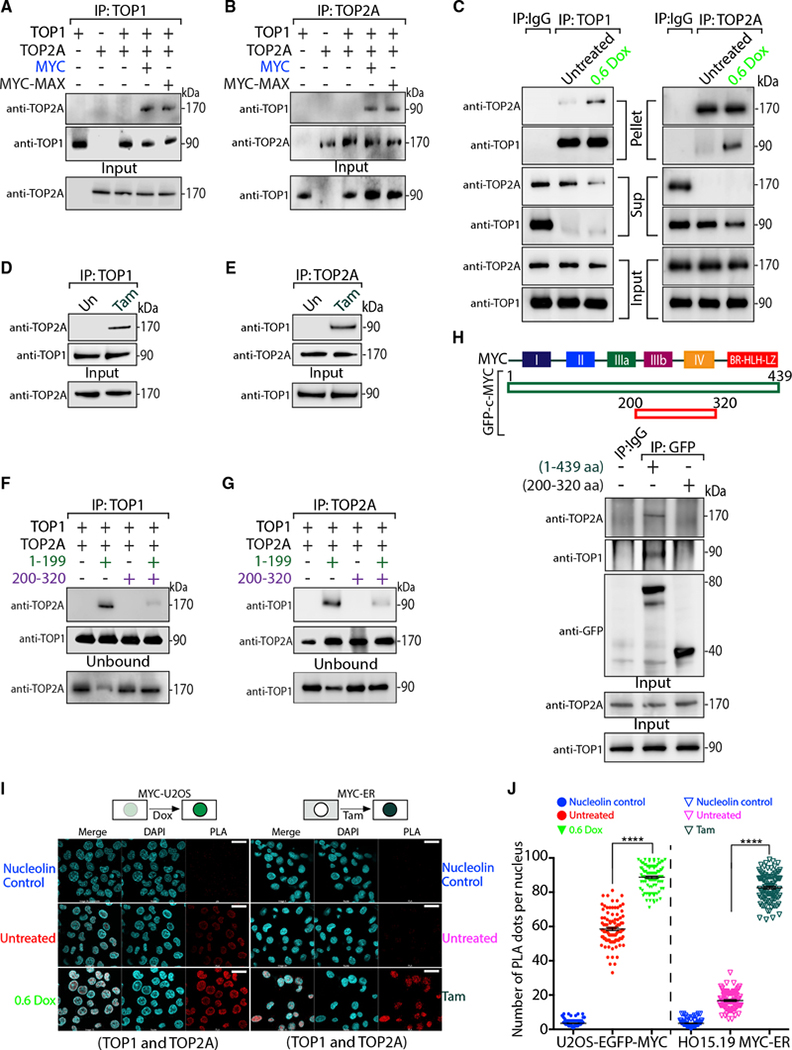
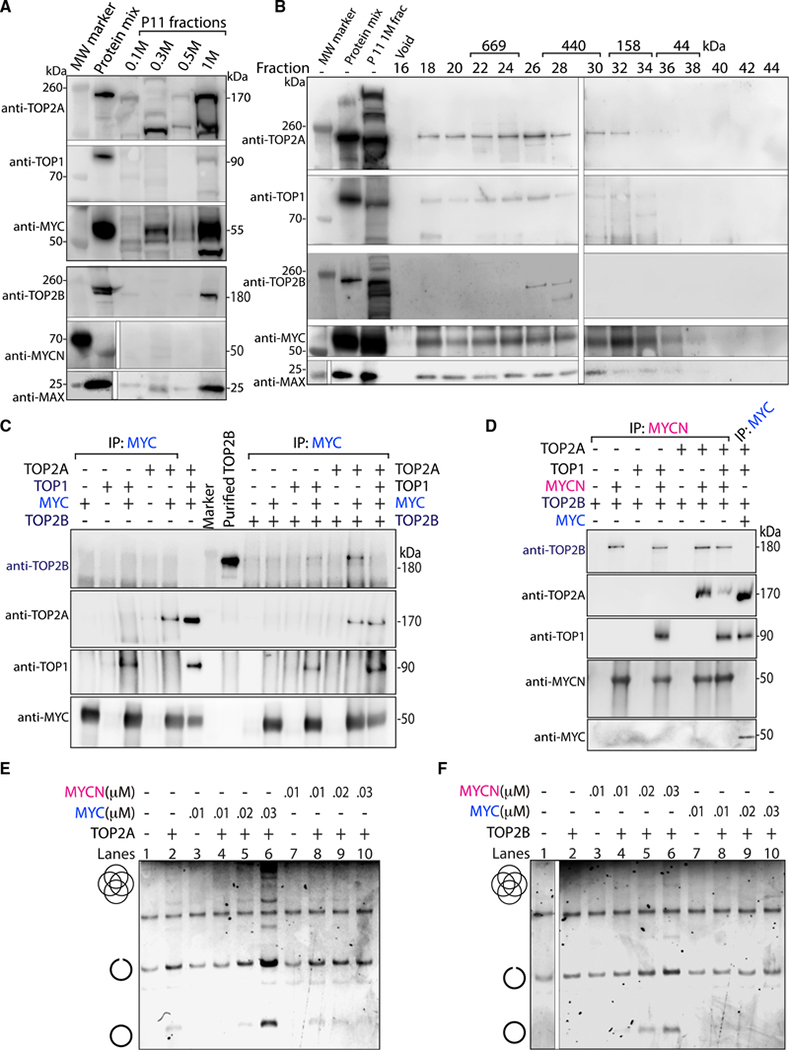
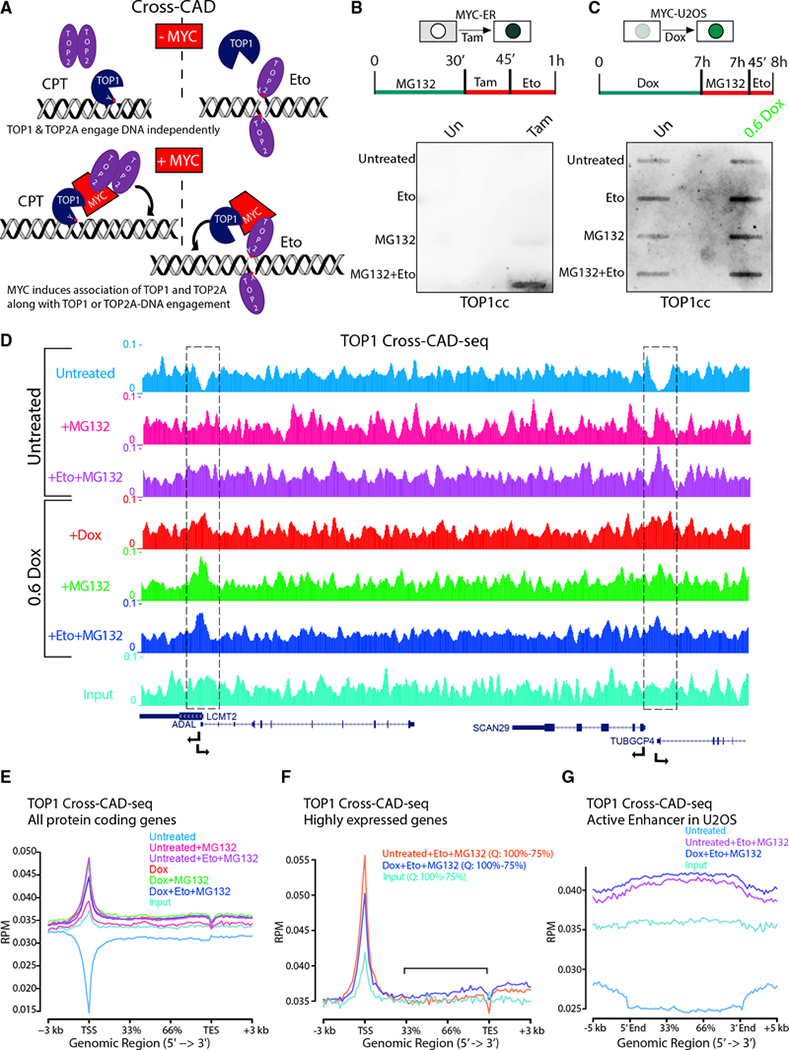
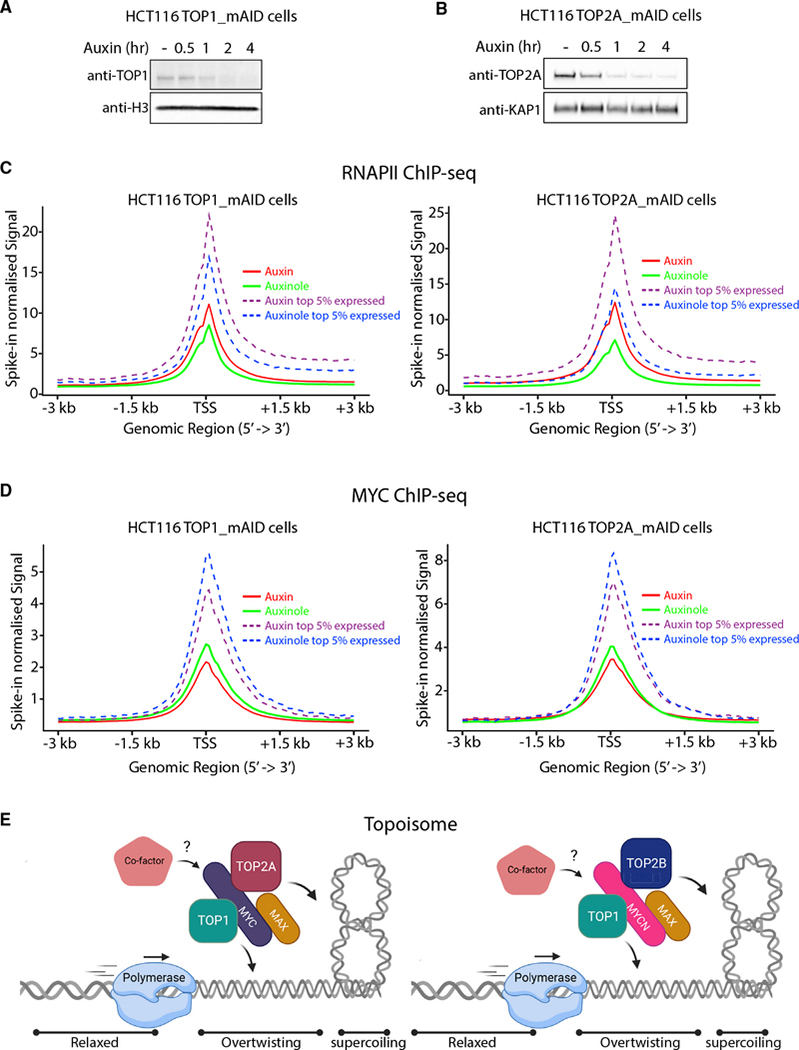
High-intensity transcription and replication supercoil DNA to levels that can impede or halt these processes. As a potent transcription amplifier and replication accelerator, the proto-oncogene MYC must manage this interfering torsional stress. By comparing gene expression with the recruitment of topoisomerases and MYC to promoters, we surmised a direct association of MYC with topoisomerase 1 (TOP1) and TOP2 that was confirmed in vitro and in cells. Beyond recruiting topoisomerases, MYC directly stimulates their activities. We identify a MYC-nucleated "topoisome" complex that unites TOP1 and TOP2 and increases their levels and activities at promoters, gene bodies, and enhancers. Whether TOP2A or TOP2B is included in the topoisome is dictated by the presence of MYC versus MYCN, respectively. Thus, in vitro and in cells, MYC assembles tools that simplify DNA topology and promote genome function under high output conditions.

Keywords: DNA topology; Myc; TOP1; TOP2; Topoisomerase; Transcription; cancer; chromatin; polymerase; supercoiling.


Conflict of interest statement

Declaration of interests The authors declare no competing interests.

Figures

Figure 1.
Figure 1.. TOP1, TOP2A and MYC are co-enriched at highly expressed genes
(A) Genomic annotation of MYC, TOP1, and TOP2A peaks and their common peaks. (B) MYC, TOP1, and TOP2A occupancy (reads per million [RPM]) at TSSs of all expressed genes. (C and D) Number of genes where MYC, TOP1, and TOP2A were recruited at all TSSs ± 500 bps (C) and for the top 5% of expressed genes within the bound genes (D). (E) Quantification of binding (%) in (C) and (D). (F) MYC depletion in K562MYC_mAID cells. (G) TOP1 CAD-seq profile (RPM) at all TSS of K562MYC_mAID cells treated with auxin, MG132 and CPT. (H) Genome Browser of ENO1 and MAPK1 promoters from (G). (I and J) HCT116 nuclear extracts immunoprecipitated (IP) with anti-MYC or immunoglobulin G (IgG) and probed for TOP1 (I) and TOP2A (J). (K) Supercoiled plasmid was added to TOP1 alone or pre-incubated with increasing MYC, MYC-MAX or MAX and assessed by gel electrophoresis. (L) TOP2A with or without pre-incubation of MYC, MYC-MAX or MAX was added to kDNA, and decatenation assay was analyzed by gel electrophoresis. Catenated and decatenated circles—nicked and intact—are indicated. See also Figure S1 and Tables S1 and S2.
Figure 2.
Figure 2.. The N and C termini of MYC bind and stimulate TOP1 and TOP2A
(A) Scheme of full-length MYC (WT) and truncations extending from the C terminus (1–199), N terminus (321–439), or from both ends (200–320). (B) TOP1 was mixed with MYC truncations, IP with anti-TOP1 or IgG, and probed for MYC (as indicated) or TOP1. (C) As in (B) but with TOP2A. (D and E) MYC WT or truncations were pre-incubated with or without TOP1 (D) or TOP2A (E) before the addition of plasmid or kDNA, respectively, and assessed by gel electrophoresis. Chl, chloroquine. (F and G) TOP1 (F) and TOP2A (G) were dephosphorylated and incubated with MYC and plasmid DNA (F) or kDNA (G). Relaxed and decatenated products were visualized on gels. The percentage of relaxed or decatenated product is indicated. See also Figure S2 and S3.
Figure 3.
Figure 3.. MYC increases DNA engagement of topoisomerases in cells
(A) Scheme of U2OS-MYC-EGFP cells harboring Dox-inducible MYC-EGFP. Cells were checked for the indicated proteins. (B) TOP1 relaxation assay using untreated or Dox-induced U2OS-MYC-EGFP lysates. (C) As in (B) but decatenation assay with TOP2A. (D) Relaxation assay using untreated or Dox-induced U2OS-MYC-EGFP lysates, with/without purified MYC or MYC-MAX. (E) Scheme of HO15.19-MYC-ER cells devoid of endogenous MYC but expressing MYC-ER protein that translocates to the nucleus upon Tam. (E and F) After treatments (as indicated), CAD extracts were probed with anti-TOP1 (E) or anti-TOP2A (F). (G and I) PLAs using anti-MYC and anti-TOP1 (left) or anti-TOP2A (right) on U2OS-MYC-EGFP cells induced with Dox (G) or HO15.19-MYC-ER cells treated with Tam (I) (scale bars, 25 μm). (H and J) Quantification of (G) and (I) for 100 cells. Significance by 2-way ANOVA using Dunnett’s correction for multiple comparisons (n = 5; mean ± SEM; t test) (****: p < 0.0001). See also Figure S4.
Figure 4.
Figure 4.. MYC joins TOP1 and TOP2A in a complex
(A and B) Recombinant proteins were mixed as indicated, IP with either anti-TOP1 (A) or anti-TOP2A (B) and probed for TOP1 and TOP2A. (C) Untreated or Dox-treated U2OS-MYC-EGFP cells were IP with anti-TOP1 (left) or anti-TOP2A (right). The IP material (Pellet), unbound (Sup) and nuclear extract prior to IP (Input) were probed for TOP1 or TOP2A. Quantitation in Table S3. (D and E) Tam-induced or not (Un) HO15.19-MYC-ER cells were IP with anti-TOP1 (D) or anti-TOP2A (E) and probed for TOP1 and TOP2A. (F and G) Indicated proteins were mixed, IP with anti-TOP1 (F) or anti-TOP2A (G), and probed for TOP1 and TOP2A. (H) Scheme of EGFP-tagged full-length MYC (1–439 aa) or mutant MYC (200–320). EGFP-MYC constructs were expressed in HCT116 cells, IP with anti-GFP, and probed for TOP1, TOP2A, or GFP. (I) PLAs (red) of anti-TOP1 with anti-TOP2A in Dox-induced U2OS-MYC-EGFP cells (left) or in Tam-treated HO15.19-MYC-ER cells (right) (scale bars, 25 μm). (J) Quantification of (I) for 100 cells. Significance by 2-way ANOVA using Dunnett’s correction for multiple comparisons (n = 5; mean ± SEM; t test) (****: p < 0.0001). See also Figure S5 and Table S3.
Figure 5.
Figure 5.. The stable topoisome has specific composition and stoicheometry
(A) HeLa cell nuclear extracts was eluted stepwise with an increasing KCl concentration and examined for the indicated proteins. A mix of recombinant proteins identified the migration of each protein. (B) The P11 1 M eluate was further fractionated, and every other fraction from 16–44 co-elution was examined. Protein mix as in (A). (C) Proteins were mixed as shown, IP with anti-MYC, and probed for TOP2A, TOP2B, TOP1 and MYC. (D) Indicated proteins were mixed, IP with anti-MYCN, and probed as in (C). (E and F) Full-length MYC or MYCN were pre-incubated with TOP2A (E) or TOP2B (F) before the addition of kDNA and decatenation assay. See also Figure S5 and Table S4.
Figure 6.
Figure 6.. The topoisome engages promoters and enhancers to favor transcription
(A) Scheme of “cross-CAD” assay. CPT increased engagement of TOP2A as well as TOP1 in the presence of MYC, while Eto increased engagement of TOP1 as well as TOP2A. Red dots with Y indicate the active site of TOP1 (Y723) or TOP2 (Y805). (B) Detection of MYC-tethered TOP1 along with Eto-trapped TOP2Acc by cross-CAD assays in HO15.19-MYC-ER cells with or without Tam with anti-TOP1. (C) As in (B) but in Dox-induced U2OS-MYC-EGFP cells. (D) Genome Browser of TOP1 cross-CAD-seq (RPM) showing two pairs of divergent promoters (dashed boxes). (E and F) Average TOP1 cross-CAD-seq (RPM) at all RNAPII genes (between TSS and transcription end site [TES]) (E) or at highly (75%–100%; Q, quartile) expressed genes (F) and at active enhancers (G) in U2OS cells. See also Figure S6 and Table S2.
Figure 7.
Figure 7.. The topoisome favors RNAPII transcription and MYC recruitment at TSSs
(A and B) TOP1 (A) and TOP2A (B) depletion in HCT116TOP1_mAID and HCT116TOP2A_ mAID cells with auxin. (C and D) Average RNAPII (C) and MYC (D) occupancy at TSS (spike-in normalized signal) of all and the top 5% of expressed genes. Significance between auxin and auxinole samples for RNAPII and MYC were calculated using a Wilcoxon signed-rank test (p < e-100) comparing means of average signal ± 500bp window around TSS. (E) A translocating polymerase unwinds DNA, generating torque transmitted through the chromatin fiber that forms supercoils. By nucleating a topisome, MYC (with TOP2A) and MYCN (with TOP2B) controls DNA topology regulating DNA over- or under-twisting as well as supercoiling that may otherwise halt ongoing transcription or replication. Created with BioRender.com. See also Figure S7 and Table S2.

Comment in

  • MYC in TOP shape.
    Zlotorynski E. Zlotorynski E. Nat Rev Mol Cell Biol. 2022 Feb;23(2):92. doi: 10.1038/s41580-021-00444-9. Nat Rev Mol Cell Biol. 2022. PMID: 34912109 No abstract available.

References

    1. Aguilera A, and García-Muse T (2012). R loops: from transcription byproducts to threats to genome stability. Mol. Cell 46, 115–124. - PubMed
    1. Amemiya HM, Kundaje A, and Boyle AP (2019). The ENCODE Blacklist: Identification of Problematic Regions of the Genome. Sci. Rep 9, 9354. - PMC - PubMed
    1. Arabi A, Wu S, Ridderstråle K, Bierhoff H, Shiue C, Fatyol K, Fahlén S, Hydbring P, Söderberg O, Grummt I, et al. (2005). c-Myc associates with ribosomal DNA and activates RNA polymerase I transcription. Nat. Cell Biol 7, 303–310. - PubMed
    1. Baluapuri A, Wolf E, and Eilers M (2020). Target gene-independent functions of MYC oncoproteins. Nat. Rev. Mol. Cell Biol 21, 255–267. - PMC - PubMed
    1. Baranello L, Levens D, Gupta A, and Kouzine F (2012). The importance of being supercoiled: how DNA mechanics regulate dynamic processes. Biochim. Biophys. Acta 1819, 632–638. - PMC - PubMed

Publication types

MeSH terms