. 2022 Jan:55:101413.
doi: 10.1016/j.molmet.2021.101413. Epub 2021 Dec 7.

Neuropeptide Y1 receptor antagonism protects β-cells and improves glycemic control in type 2 diabetes

Affiliations

Neuropeptide Y1 receptor antagonism protects β-cells and improves glycemic control in type 2 diabetes

Chieh-Hsin Yang et al. Mol Metab. 2022 Jan.

Abstract

Objectives: Loss of functional β-cell mass is a key factor contributing to poor glycemic control in advanced type 2 diabetes (T2D). We have previously reported that the inhibition of the neuropeptide Y1 receptor improves the islet transplantation outcome in type 1 diabetes (T1D). The aim of this study was to identify the pathophysiological role of the neuropeptide Y (NPY) system in human T2D and further evaluate the therapeutic potential of using the Y1 receptor antagonist BIBO3304 to improve β-cell function and survival in T2D.

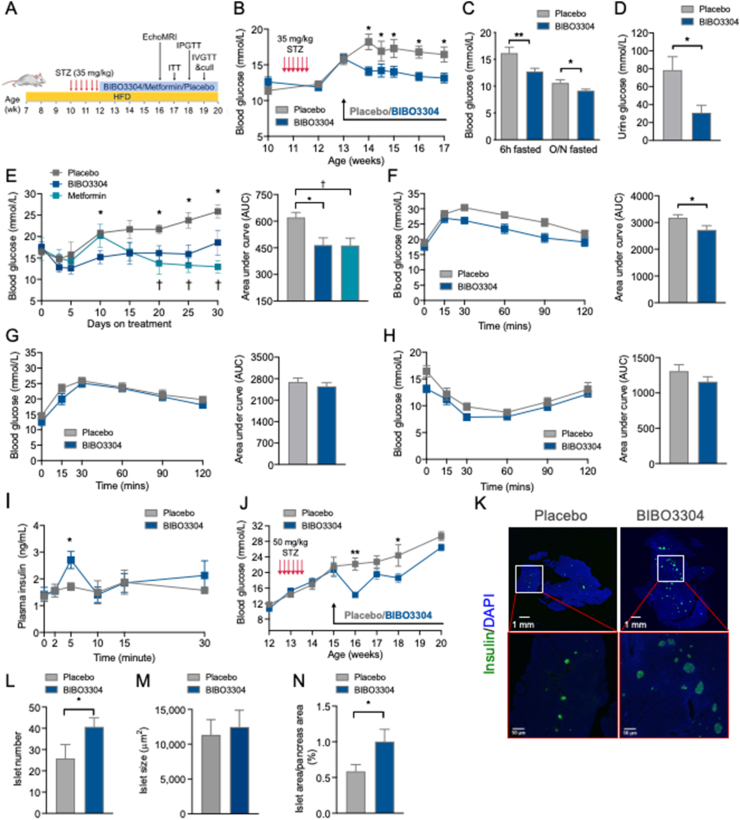
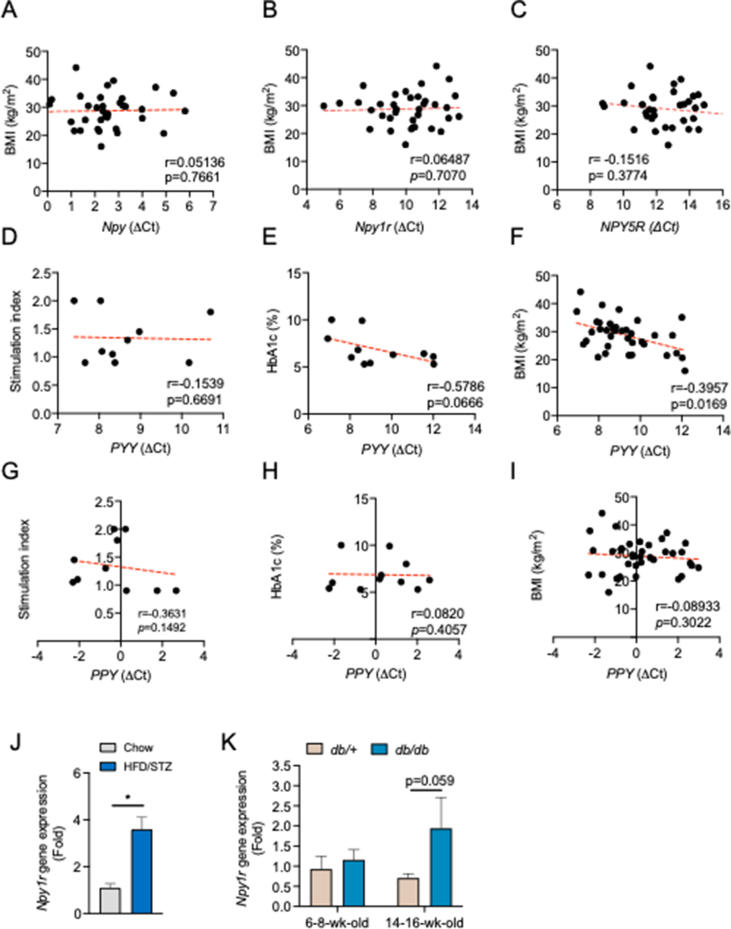
Methods: The gene expression of the NPY system in human islets from nondiabetic subjects and subjects with T2D was determined and correlated with the stimulation index. The glucose-lowering and β-cell-protective effects of BIBO3304, a selective orally bioavailable Y1 receptor antagonist, in high-fat diet (HFD)/multiple low-dose streptozotocin (STZ)-induced and genetically obese (db/db) T2D mouse models were assessed.

Results: In this study, we identified a more than 2-fold increase in NPY1R and its ligand, NPY mRNA expression in human islets from subjects with T2D, which was significantly associated with reduced insulin secretion. Consistently, the pharmacological inhibition of Y1 receptors by BIBO3304 significantly protected β cells from dysfunction and death under multiple diabetogenic conditions in islets. In a preclinical study, we demonstrated that the inhibition of Y1 receptors by BIBO3304 led to reduced adiposity and enhanced insulin action in the skeletal muscle. Importantly, the Y1 receptor antagonist BIBO3304 treatment also improved β-cell function and preserved functional β-cell mass, thereby resulting in better glycemic control in both HFD/multiple low-dose STZ-induced and db/db T2D mice.

Conclusions: Our results revealed a novel causal link between increased islet NPY-Y1 receptor gene expression and β-cell dysfunction and failure in human T2D, contributing to the understanding of the pathophysiology of T2D. Furthermore, our results demonstrate that the inhibition of the Y1 receptor by BIBO3304 represents a potential β-cell-protective therapy for improving functional β-cell mass and glycemic control in T2D.

Keywords: Insulin secretion; NPY; Type 2 diabetes; Y1 receptor; β-Cell.


Figures

Figure 1
Figure 1
Increased NPY and NPY1R mRNA expression levels are negatively correlated with the islet stimulation index in T2D. (A) NPY, PYY, and PPY mRNA expression in human pancreatic islets from nondiabetic and T2D subjects relative to the NPY expression in the nondiabetic group. Subject numbers: nondiabetic = 25 and T2D = 11. (B) Y-receptor expression profiles in human pancreatic islets from nondiabetic and T2D subjects relative to the NPY2R expression in the nondiabetic group. Subject numbers: nondiabetic = 25 and T2D = 11. The results are normalized to the RPLP0 gene (C–D). Correlation between the insulin stimulation index or HbA1C and the expression of NPY mRNA (delta CT values) in human islets of subjects with T2D and nondiabetic control subjects. Total subjects = 9. (E–F) Correlation between the insulin stimulation index or HbA1C and the expression of NPY1R mRNA (delta CT values) in human islets of subjects with T2D and nondiabetic control subjects. Total subjects = 10. (G–H) Correlation between the insulin stimulation index or HbA1C and the expression of NPY5R mRNA (delta CT values) in human islets of subjects with T2D and nondiabetic control subjects. Total subjects = 11. (A–B) Data are expressed as the mean ± SEM. ∗P < 0.05, ∗∗P < 0.01, calculated by the Student's t-test when comparing nondiabetic vs T2D subjects. (C–H) P values are derived from two-tailed Spearman correlation analysis.
Figure 2
Figure 2
Pharmacological inhibition of the Y1 receptor restores β-cell function and protects against β-cell death under diabetogenic conditions. (A–B) Pancreatic islets from C57BL/6 mice were isolated and cultured under the corresponding diabetogenic conditions: inflammatory cytokine cocktail of 25 ng/ml IL-1β, 250 ng/ml IFNγ, 50 ng/ml TNFα ± 1 μM of BIBO3304 for 48 h (n = 5), thapsigargin (1 μM) ± 1 μM of BIBO3304 for 24 h (n = 3–6). Glucose-stimulated insulin secretion was determined in response to 2.8 and 20 mmol/L glucose. (C–E) DNA fragmentation in response to inflammation, ER stress, and oxidative stress was measured by flow cytometry. Representative FACS profiles are shown and the results are representative of islets from a minimum of 3 mice per group. (F) Apoptotic gene expression in islets from 14 to 16-week-old diabetic db/db mice treated with 1 μM BIBO3304 or placebo for 36 h. Data are expressed as the mean ± SEM of 4–6 mice. (G–J) Western blot analyses of pro-apoptotic proteins BIM, cleaved caspase-3, and phosphorylated CREB (Ser133) in isolated islets from 10 to 12-week-old leptin receptor-deficient db/db mice were cultured with/without 1 μM of BIBO3304 for 36 h. α-tubulin was used as the loading control (n = 3–4). The results shown are a representative blot and quantitative densitometry analysis. Data are expressed as the mean ± SEM. ∗P < 0.05, ∗∗P < 0.01, and ∗∗∗P < 0.001, calculated by the unpaired Student's t-test.
Figure 3
Figure 3
Y1 receptor antagonist BIBO3304 improves glycemia in HFD/STZ-induced diabetic mice. (A) Schematic diagram of the treatment regimen. C57BL/6 mice were fed on a high-fat diet for 4 weeks and rendered diabetic by multiple low doses of STZ injections (6 doses, 35 mg/kg). Diabetic mice were randomized to receive placebo, oral Y1 antagonist BIBO3304, or metformin for 6 weeks. Metabolic and glucose homeostasis parameters were examined thereafter. (B) Non-fasting blood glucose levels at the indicated time points were measured from placebo and BIBO3304-treated mice. n = 8 per group. (C) Six-hour and overnight-fasted blood glucose levels. n = 7–8 per group. (D) Urine glucose levels. n = 6–7 per group. (E) Non-fasting blood glucose levels at the indicated time points were measured from placebo, BIBO3304-treated mice, or metformin-treated mice. The results expressed as area under the curve. n = 4–6 per group. (F) Intraperitoneal glucose tolerance tests (1 g/kg body weight) on 6-h-fasted diabetic mice treated with placebo or BIBO3304 for 4 weeks. Blood glucose levels during glucose tolerance tests were monitored, and the results are expressed over the time course and as the area under the curve. n = 8 per group. (G–H) Diabetic mice treated with placebo or BIBO3304 were fasted overnight or for 6 h and i.p. pyruvate tolerance tests (1 g/kg body weight) or insulin sensitivity tests (0.75 i.u./kg body weight) were performed, respectively. Blood glucose levels during the tolerance tests were monitored, and the results are expressed over the time course and as the area under the curve. n = 6–8 per group. (I) Plasma insulin levels throughout intravenous glucose tolerance tests (1 g/kg body weight) from mice treated with placebo or BIBO3304. n = 5–6 per group. (J) C57BL/6 mice were rendered diabetic by multiple high doses of STZ injections (6 doses, 50 mg/kg body weight). Non-fasting blood glucose levels at the indicated time points were measured from placebo and BIBO3304-treated mice. n = 5–6 per group. (K) Sections of pancreas from placebo or BIBO3304-treated mice were stained for insulin (green) and nuclear counterstained with DAPI (blue). (L–N) Islet number, islet size, and islet proportion were determined across three nonconsecutive pancreatic sections per mouse and normalized to the total pancreatic section area. n = 5–6 per group. Data are expressed as the mean ± SEM. ∗P < 0.05 and ∗∗P < 0.01, calculated by the unpaired Student's t-test or two-way ANOVA analysis.
Figure 4
Figure 4
Y1 receptor antagonist BIBO3304 improves hyperglycemia and insulin sensitivity and preserves functional β-cell mass in db/db mice. Four-week-old leptin receptor-deficient db/db mice were randomized to receive placebo or oral Y1 antagonist BIBO3304 for 6 weeks. (A) Weekly body weight of db/db mice treated with placebo or oral BIBO3304 (n = 5–6 per group). (B–C) Whole-body lean and fat mass as determined by EchoMRI analysis in db/db mice treated with placebo or oral BIBO3304 (n = 7 per group). (D) Dissected weights of individual white adipose tissue from epididymal (Epi), inguinal (Ing), and brown adipose tissue (BAT) (n = 4–5 per group). (E) Fed and fasted blood glucose levels in db/db mice treated with placebo or oral BIBO3304 (n = 5–6 per group). (F) Fasting plasma insulin levels in db/db mice treated with placebo or oral BIBO3304 (n = 6–8 per group). (G) db/db mice treated with placebo or BIBO3304 were fasted for 6 h or overnight and intraperitoneal insulin tolerance tests (2.5 i.u./kg body weight) were performed. Blood glucose levels during the tolerance tests were monitored, and the results are expressed over the time course and as the area under the curve (n = 5 per group). (H–I) EDL muscle isolated from db/db mice treated with placebo or BIBO3304, and insulin-stimulated glucose uptake and Akt activation were determined. The muscle homogenates were subjected to SDS-PAGE and Western blot analysis using anti-phospho Ser 473 Akt, total Akt, and β-actin antibodies (n = 5–6). The results shown are a representative blot and quantitative densitometry analysis. The cropped gel is used in the figure and full-length gel is presented in Supplemental Figure S4C. (J) NPY1R expression in human muscle from lean (BMI < 25) and overweight/obese (BMI > 25) subjects. Subject numbers: lean = 7 and overweight/obese = 11. (K–L) Correlation between the fasting blood glucose or BMI and the expression of NPY1R mRNA (delta CT values) in human muscle of obese and lean control subjects. Total subjects = 18. (M) Primary human muscle cells (n = 3) were cultured and insulin-stimulated glucose uptake was determined following the treatment with NPY (Leu31, Pro34) or NPY + Y1 receptor antagonist BIBO3304. The results were presented as the percentage increase from basal, and the data are the average of 3 independent experiments. (N) Four- and ten-week-old leptin receptor-deficient db/db mice were randomized to receive placebo or oral Y1 antagonist BIBO3304 for 6 weeks. Fasted and re-fed serum insulin levels were measured (n = 5–8 per group). (O) Pancreases from placebo or BIBO3304-treated mice at 16 weeks of age were weighed and fixed in formalin and processed for immunostaining of insulin (green) and nuclear counterstained with DAPI (blue). Insulin intensity was determined by screening 138 and 172 islets on placebo and BIBO3304-treated pancreatic sections, respectively. Insulin intensity was presented as insulin positive pixel normalized to the islet area. Data are expressed as the mean ± SEM. ∗P < 0.05 calculated by the unpaired Student's t-test or two-way ANOVA analysis.
Supplemental Figure 1
Correlation between the stimulation index, HbA1c or BMI and the islet NPY system expression in type 2 diabetes. (A–C) Correlation between the BMI and the expression of NPY, NPY1R, and NPY5R mRNA in human islets of subjects with type 2 diabetes and nondiabetic control subjects. Total subjects = 34. (D–F) Correlation between the insulin stimulation index, BMI, or HbA1C and the expression of PYY mRNA in human islets of subjects with type 2 diabetes and nondiabetic control subjects. Analysis was performed with a total number of 9 subjects for the stimulation index, 36 subjects for BMI, and 11 subjects for HbA1C. (G–I) The correlation between the insulin stimulation index, BMI, or HbA1C and the expression of PPY mRNA in human islets of subjects with type 2 diabetes and nondiabetic control subjects. Total number of 10 subjects in the stimulation index, 36 subjects in the BMI, and 11 subjects in HbA1C. Data are expressed as the mean ± SEM. P values are calculated using two-tailed Spearman's correlation analysis. (J) Npy, Pyy, and Npy1r mRNA expression in mouse islets isolated from HFD/STZ diabetic mice (n = 3) and age-matched C57BL/6 mice (n = 7). (K) Npy1r mRNA expression in young and aged db/db mouse islets compared with their age-matched db/+ (n = 4–6) counterparts. The results are normalized to the Ppia gene. Data are expressed as the mean ± SEM. ∗P < 0.05, calculated by the Student's t-test when comparing nondiabetic (db/+ or chow C57BL/6) vs diabetic (db/db or HFD/STZ) subjects.
Supplemental Figure 2
Islet cell death analysis and glucose-stimulated insulin secretion in Y1 receptor antagonist-treated islets under basal and glucolipotoxicity and oxidative stress conditions. (A) Pancreatic islets from C57BL/6 mice were isolated and cultured in the absence of diabetogenic stress or (B) were exposed to 25 mmol/L glucose and 0.5 mM palmitate ± 1 μM of BIBO3304 for 96 h or 10 μM H2O2 ± 1 μM of BIBO3304 for 16 h (n = 3–4). Glucose-stimulated insulin secretion was determined in response to 2.8 and 20 mmol/L glucose. (C) DNA fragmentation in response to glucolipotoxicity (25 mmol/L glucose and 0.5 mM palmitate ± 1 μM of BIBO3304 for 72 h) or (D) in the absence of diabetogenic stress was measured by flow cytometry. Representative FACS profiles are shown, and the results are representative of islets from a minimum of n = 3 per group. (E) Apoptotic gene expression in isolated islets from 14–16-week-old diabetic db/db mice treated with 1 μM BIBO3304 or placebo for 36 h. Data are expressed as the mean ± SEM of 4–6 mice. Data are expressed as the mean ± SEM. ∗P < 0.05 and ∗∗P < 0.01, calculated by the unpaired Student's t-test.
Supplemental Figure 3
Y1 receptor antagonist BIBO3304 treatment did not alter adiposity, food intake, or hepatic glucose production in HFD/STZ-induced diabetic mice. C57BL/6 mice were fed a high-fat diet for 4 weeks and rendered diabetic by multiple low doses of STZ injections (6 doses, 35 mg/kg). Diabetic HFD/STZ mice exhibited (A) increased fasting blood glucose levels, (B) decreased postprandial insulin secretion, (C–D) impaired insulin response when compared with chow-fed C57BL/6 mice. (E–L) Diabetic mice were randomized to receive placebo or oral Y1 antagonist BIBO3304 for 4 weeks. Metabolic and glucose homeostasis parameters were examined thereafter. (E) Body weight of HFD/STZ-induced diabetic mice treated with placebo or oral BIBO3304 (n = 6–8 per group). (F–I) Whole-body lean and fat mass as determined by EchoMRI analysis in placebo or oral BIBO3304-treated HF/STZ mice (n = 6–8 per group). (J–K) Dissected weights of individual epididymal (Epi) and inguinal (Ing) white adipose tissue (n = 6–8 per group). (L) Daily food intake of HFD/STZ-induced diabetic mice treated with placebo or oral BIBO3304 (n = 6–8 per group). (M) Hepatocytes were isolated and glucose production was performed in the presence of NPY, BIBO3304, or NPY + BIBO3304 (n = 6–8 per group). (N) Dissected weights of pancreas from HFD/STZ-induced diabetic mice treated with placebo or oral BIBO3304 (n = 6–8 per group). (O–Q) Islet number, islet size, and islet proportion were determined across three nonconsecutive pancreatic sections per mouse from BIBO3304-, metformin-, and placebo-treated groups. n = 5–6 per group. (R) Images shown are representative of the pancreatic sections from placebo-, BIBO3304-, or metformin-treated mice stained for insulin (green) and DAPI (blue) for nucleus. (S) Islet Pyy gene expression of HFD/STZ-induced diabetes mice treated with placebo or oral BIBO3304 (n = 6–7 per group). (T) Plasma glucagon levels from HFD/STZ-induced diabetes mice treated with placebo or oral BIBO3304 (n = 8 per group). Data are expressed as the mean ± SEM. ∗P < 0.05 and ∗∗P < 0.01, calculated by the unpaired Student's t-test or one-way ANOVA.
Supplemental Figure 4
Metabolic and glucose homeostasis parameters in db/db mice treated with BIBO3304. Four-week-old leptin receptor-deficient db/db mice were randomized to receive placebo or oral Y1 antagonist BIBO3304 for 6 weeks. (A) Daily food intake of db/db mice treated with placebo or oral BIBO3304 (n = 5–6 per group). (B–C) db/db mice treated with placebo or BIBO3304 were fasted overnight, and intraperitoneal glucose tolerance tests (0.5 g/kg body weight) were performed. Blood glucose levels during the tolerance tests were monitored, and the results are expressed over the time course and as the area under the curve (n = 5–6 per group). (D) Livers and white adipose tissues were isolated from 10-week-old db/db mice treated with placebo or BIBO3304 and Akt activation was determined. Tissues were subjected to SDS-PAGE and Western blot analysis using anti-Akt phosphorylation Ser 473, and β-actin antibodies (n = 5–6). The results shown are a representative blot and quantitative densitometry analysis. (E–G) Ten-week-old leptin receptor-deficient db/db mice were randomized to receive placebo or oral Y1 antagonist BIBO3304 for 6 weeks. Weekly body weights were determined. Whole-body lean and fat mass was determined by EchoMRI analysis in placebo- or oral BIBO3304-treated db/db mice (n = 5 per group). (H) Dissected weights of individual epididymal (Epi) and inguinal (Ing) white adipose tissue and brown adipose tissue (BAT) (n = 4–5 per group). (I) db/db mice treated with placebo or BIBO3304 were fasted overnight, and intraperitoneal insulin tolerance tests (2.5 i.u./kg body weight) were performed. Blood glucose levels during the tolerance tests were monitored, and the results are expressed over the time course and as area under the curve. (n = 4–6 per group). (J–M) Pancreases from placebo- or BIBO3304-treated mice were weighed and fixed in formalin and processed for immunostaining of insulin (green) and nuclear counterstained with DAPI (blue). Islet number, islet area, and islet proportion were determined across two nonconsecutive pancreatic sections per mouse and normalized to the total pancreatic section area. n = 4–6 per group. Data are expressed as the mean ± SEM. ∗P < 0.05 and ∗∗P < 0.01, calculated by unpaired Student's t-test or two-way ANOVA analysis.

References

    1. Wild S., et al. Global prevalence of diabetes: estimates for the year 2000 and projections for 2030. Diabetes Care. 2004;27(5):1047–1053. - PubMed
    1. Cole J.B., Florez J.C. Genetics of diabetes mellitus and diabetes complications. Nature Reviews Nephrology. 2020;16(7):377–390. - PMC - PubMed
    1. Harding J.L., et al. Global trends in diabetes complications: a review of current evidence. Diabetologia. 2019;62(1):3–16. - PubMed
    1. Weir G.C., Bonner-Weir S. Five stages of evolving beta-cell dysfunction during progression to diabetes. Diabetes. 2004;53(Suppl. 3):S16–S21. - PubMed
    1. Atkinson M.A., Eisenbarth G.S., Michels A.W. Type 1 diabetes. Lancet. 2014;383(9911):69–82. - PMC - PubMed

Publication types