. 2022 Jan 15:159:107027.
doi: 10.1016/j.envint.2021.107027. Epub 2021 Dec 7.

Current and future burdens of heat-related dementia hospital admissions in England

Affiliations

Current and future burdens of heat-related dementia hospital admissions in England

Jessica Gong et al. Environ Int. .

Abstract

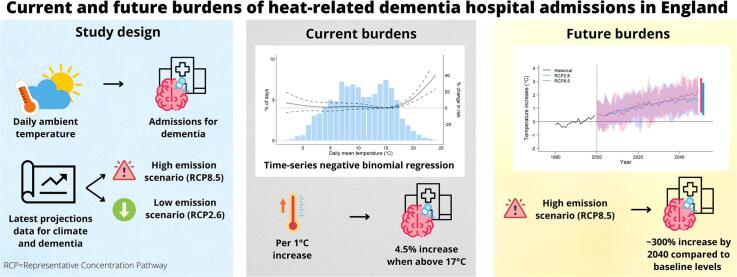
Introduction: The impacts of a changing climate on current and future dementia burdens have not been widely explored.

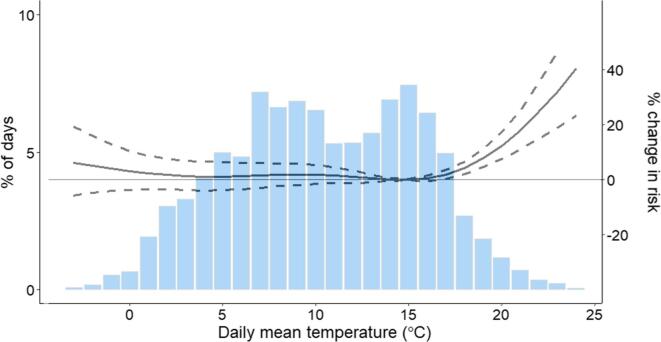
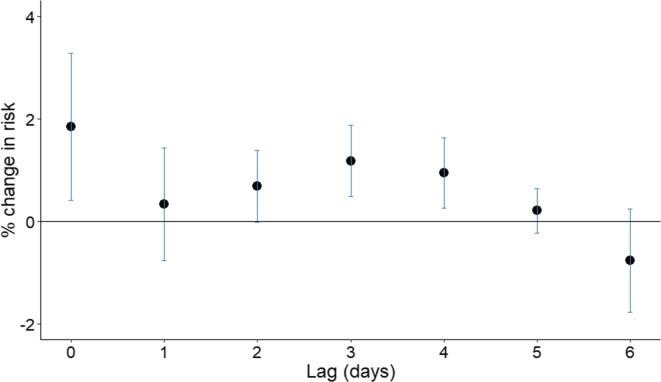
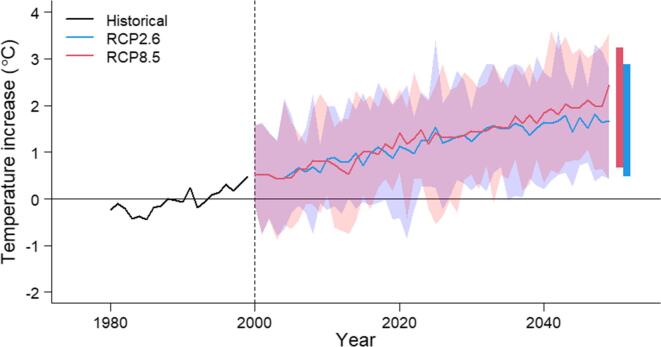
Methods: Time-series negative binomial regression analysis was used to assess acute associations between daily ambient temperature and counts of emergency admissions for dementia in each Government region of England, adjusting for season and day-of-week. Using the latest climate and dementia projections data, we then estimate future heat-related dementia burdens under a high emission scenario (Representative Concentration Pathway (RCP8.5), where global greenhouse gas (GHG) emissions continue to rise, and a low emissions scenario (RCP2.6), where GHG emissions are sizeably reduced under a strong global mitigation policy.

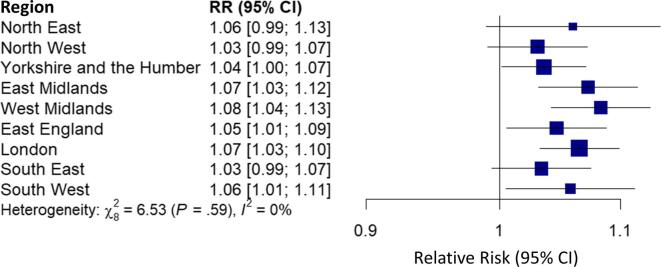
Results: A raised risk associated with high temperatures was observed in all regions. Nationally, a 4.5% (95% Confidence interval (CI) 2.9%-6.1%) increase in risk of dementia admission was observed for every 1 °C increase in temperature above 17 °C associated with current climate. Under a high emissions scenario, heat-related admissions are projected to increase by almost 300% by 2040 compared to baseline levels.

Conclusions: People living with dementia should be considered a high-risk group during hot weather. Our results support arguments for more stringent climate change mitigation policies.

Keywords: Ambient temperature; Climate change; Dementia; Hospital admission; Time series.


Conflict of interest statement

The authors declare that they have no known competing financial interests or personal relationships that could have appeared to influence the work reported in this paper.

Figures

None
Graphical abstract
Fig. 1
Fig. 1
Mean daily counts of emergency dementia-related admissions by day of year. Blue line summarizes the seasonal pattern using a natural cubic spline of time. Blue shading indicates months December-February; red shading indicates June-August. (For interpretation of the references to colour in this figure legend, the reader is referred to the web version of this article.)
Fig. 2
Fig. 2
Proportion (%) of days between 1998 and 2009 (blue bars) and estimated percentage change in risk of emergency hospital admission for dementia (black line) at daily mean temperature of 1 °C intervals. Dashed black lines indicate 95% confidence intervals of estimated change in risk. (For interpretation of the references to colour in this figure legend, the reader is referred to the web version of this article.)
Fig. 3
Fig. 3
Region-specific relative risk (RR) (95% CI) of emergency hospital admission for dementia per 1 °C increase in daily mean temperature above the heat threshold (91st centile): North East (15 °C), North West (16 °C), Yorkshire and the Humber (16 °C), East Midlands (17 °C), West Midlands (17 °C), East England (18 °C), London (19 °C), South East (18 °C), South West (17 °C).
Fig. 4
Fig. 4
Percentage change in risk of emergency dementia-related hospital admission per 1 °C increase in daily mean temperature above the heat threshold (17 °C), on the 6 days leading up to admission (lags 1–6) and on the day of admission (lag 0). Black dots represent estimated changes in risk and grey bars indicate their 95% confidence intervals.
Fig. 5
Fig. 5
Projected mean temperature in England over time (1980–2049). Solid blue and red lines represent mean annual temperature estimated across the 22 climate projections for each representative concentration pathway (RCP) scenario, expressed as the difference in annual mean temperature from the historical average temperature (black line). Shaded areas represent annual variability (range) in projected temperature across 22 UKCP18 climate projections. Blue and red horizontal bars represent mean annual maximum and minimum temperature for RCP2.6 and RCP8.5, respectively. Data source: UKCP18 Global Climate Model Projections (See: Met Office Hadley (Centre, 2018) UKCP18 Global Climate Model Projections for the entire globe. In. Centre for Environmental Data Analysis, 2021. http://catalogue.ceda.ac.uk/uuid/f1a2fc3c120f400396a92f5de84d596a). Contains public sector information licensed under the Open Government Licence v3.0. Using R code provided in Vicedo-Cabrera (See: Vicedo-Cabrera AM, Sera F, Gasparrini A (2019) Hands-on tutorial on a modeling framework for projections of climate change impacts on health. Epidemiology 30(3): 321–329). (For interpretation of the references to colour in this figure legend, the reader is referred to the web version of this article.)

References

    1. Ahmadi-Abhari, S., Guzman-Castillo, M., Bandosz, P., et al., 2017. Temporal trend in dementia incidence since 2002 and projections for prevalence in England and Wales to 2040: modelling study. BMJ 358, j2856. 10.1136/bmj.j2856. - PMC - PubMed
    1. Alavi Naini S.M., Soussi-Yanicostas N. Tau Hyperphosphorylation and Oxidative Stress, a Critical Vicious Circle in Neurodegenerative Tauopathies? Oxid. Med. Cell. Longevity. 2015;2015:1–17. - PMC - PubMed
    1. Anderson M., Carmichael C., Murray V., Dengel A., Swainson M. Defining indoor heat thresholds for health in the UK. Perspect. Public Health. 2013;133(3):158–164. doi: 10.1177/1757913912453411. - DOI - PubMed
    1. Arbuthnott K., Hajat S., Heaviside C., Vardoulakis S. Vardoulakis S Years of life lost and mortality due to heat and cold in the three largest English cities. Environ. Int. 2020;144:105966. doi: 10.1016/j.envint.2020.105966. - DOI - PubMed
    1. Armstrong B. Models for the relationship between ambient temperature and daily mortality. Epidemiology. 2006;17(6):624–631. - PubMed

Publication types