Observational Study
. 2021 Dec 10;6(1):418.
doi: 10.1038/s41392-021-00819-6.

Endothelial dysfunction contributes to severe COVID-19 in combination with dysregulated lymphocyte responses and cytokine networks

Affiliations
Observational Study

Endothelial dysfunction contributes to severe COVID-19 in combination with dysregulated lymphocyte responses and cytokine networks

Louisa Ruhl et al. Signal Transduct Target Ther. .

Abstract

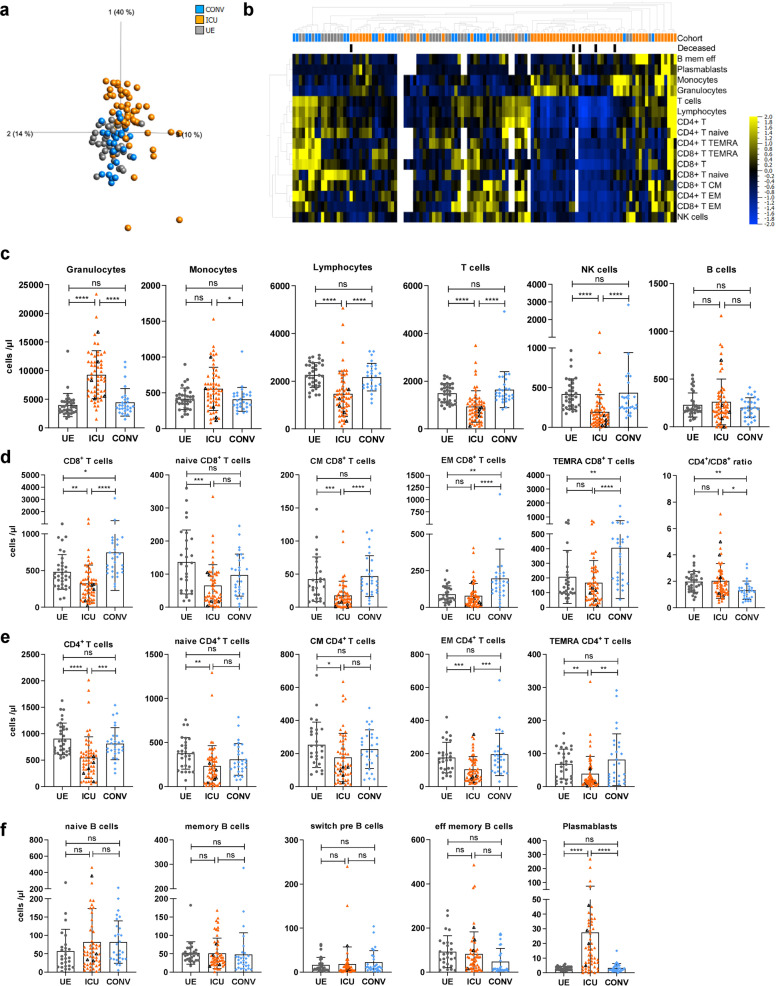
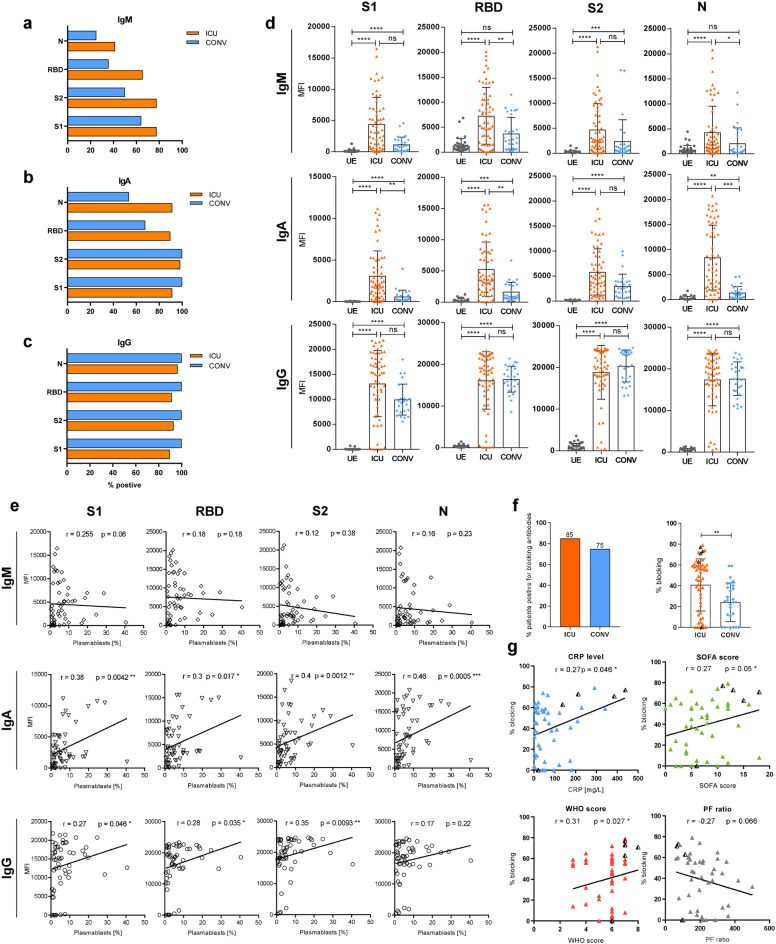
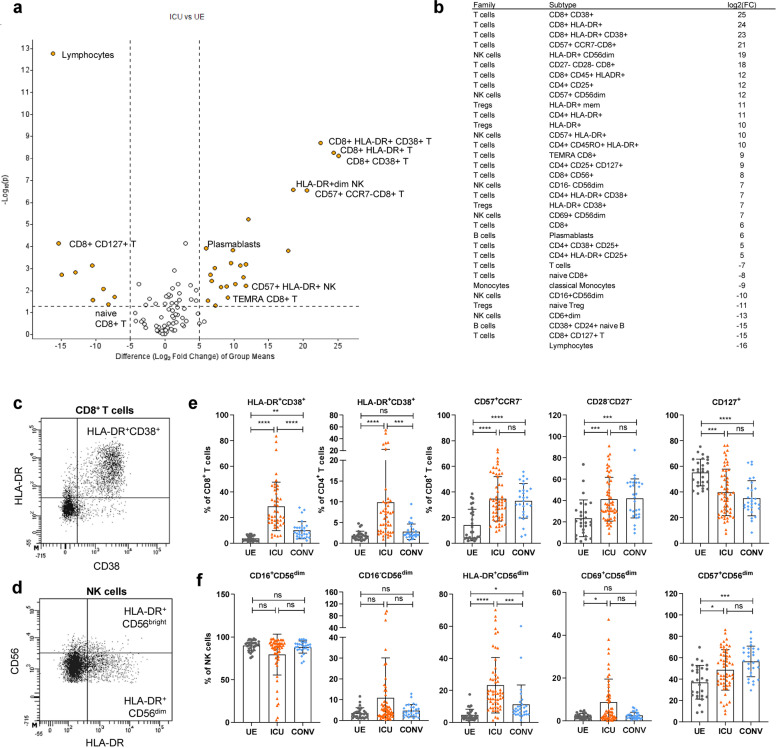
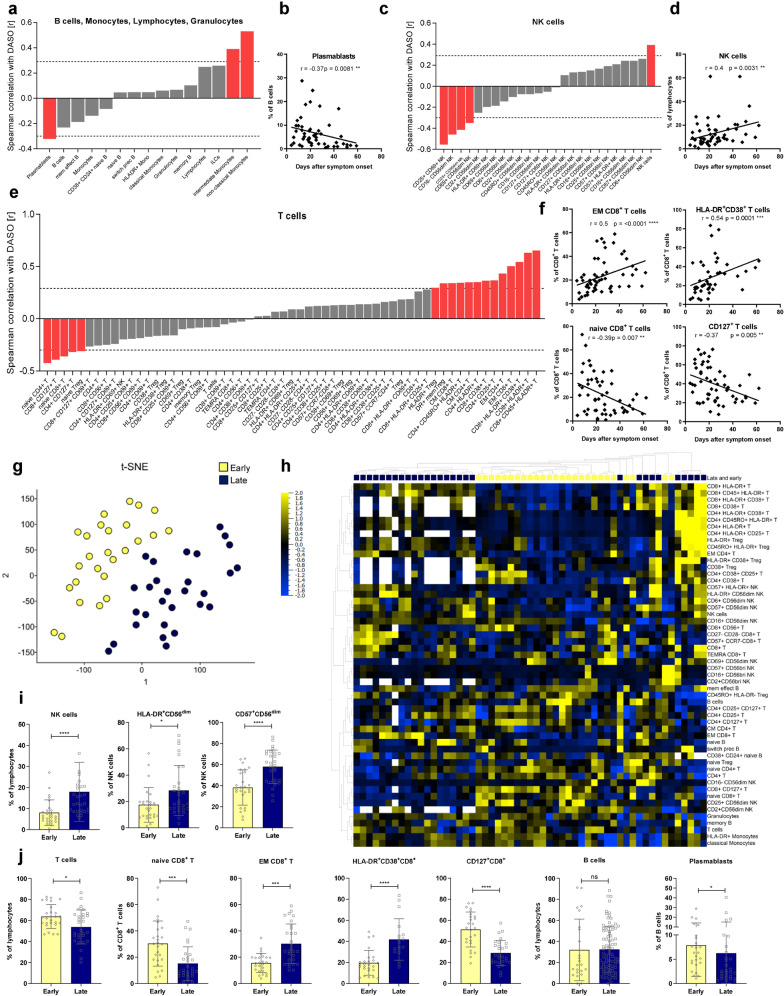
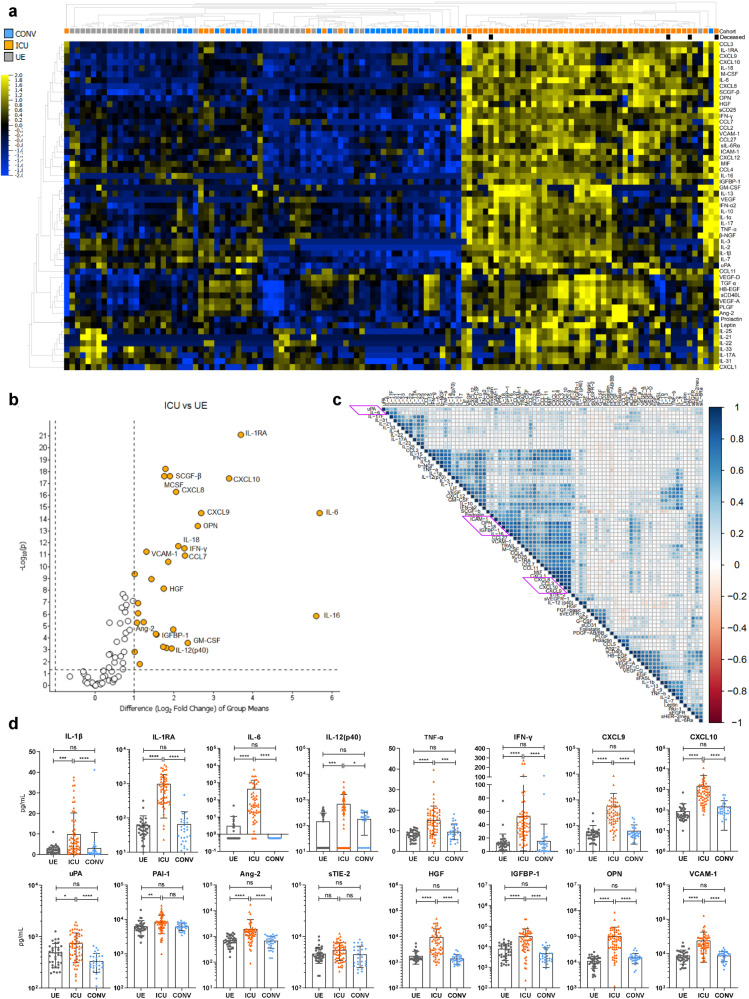
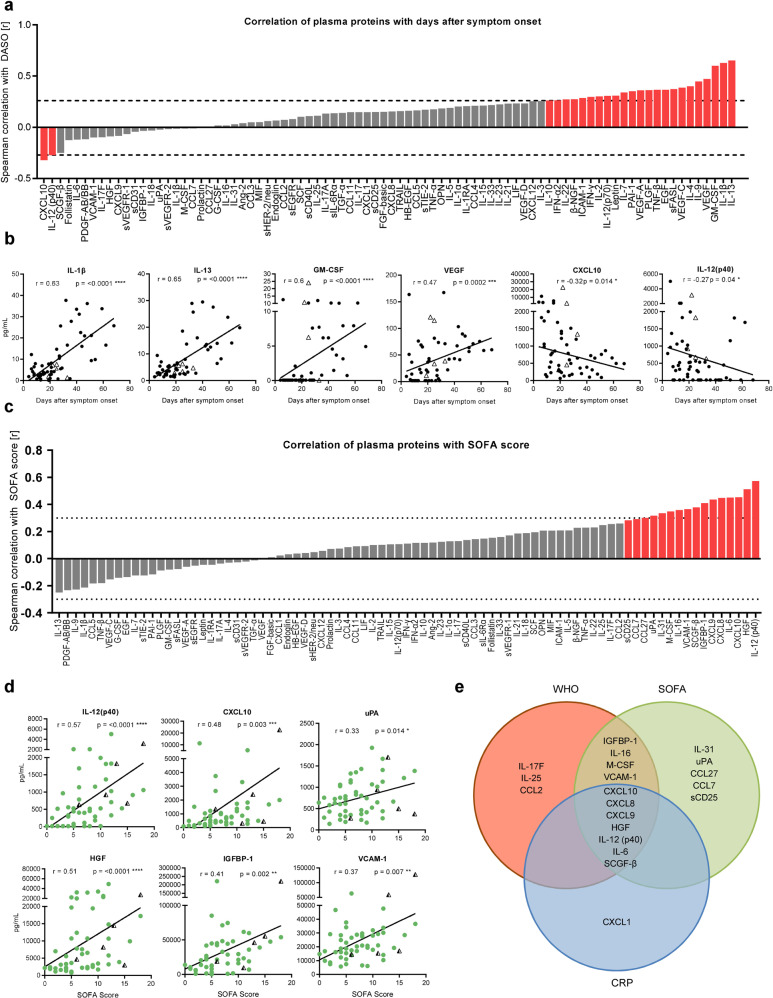
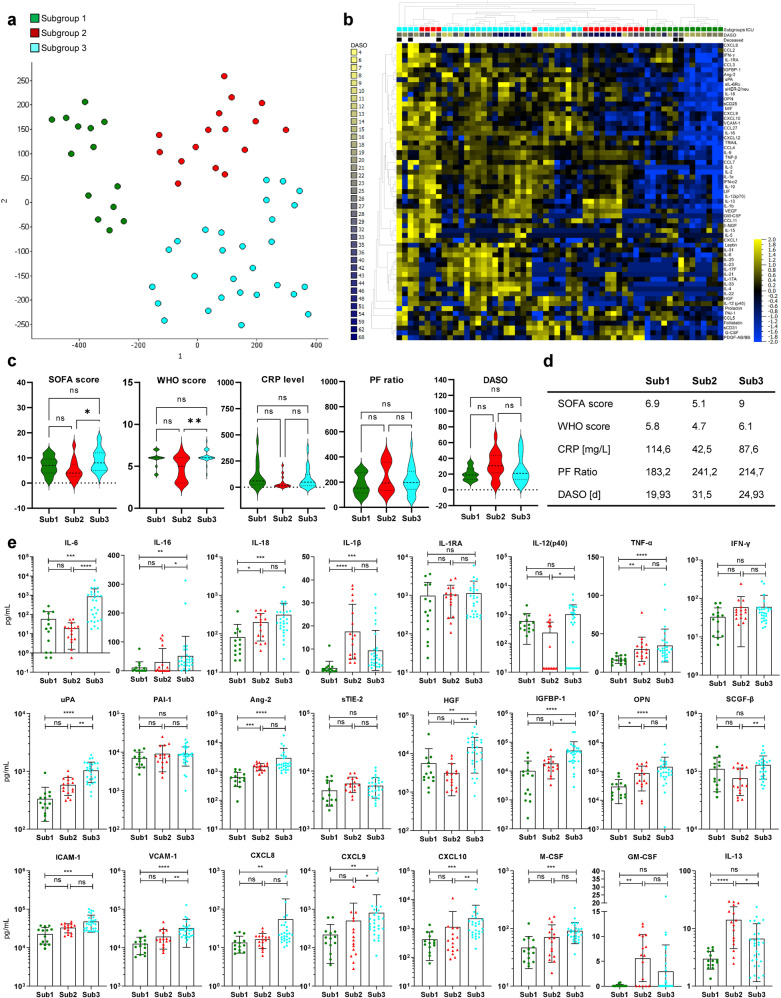
The systemic processes involved in the manifestation of life-threatening COVID-19 and in disease recovery are still incompletely understood, despite investigations focusing on the dysregulation of immune responses after SARS-CoV-2 infection. To define hallmarks of severe COVID-19 in acute disease (n = 58) and in disease recovery in convalescent patients (n = 28) from Hannover Medical School, we used flow cytometry and proteomics data with unsupervised clustering analyses. In our observational study, we combined analyses of immune cells and cytokine/chemokine networks with endothelial activation and injury. ICU patients displayed an altered immune signature with prolonged lymphopenia but the expansion of granulocytes and plasmablasts along with activated and terminally differentiated T and NK cells and high levels of SARS-CoV-2-specific antibodies. The core signature of seven plasma proteins revealed a highly inflammatory microenvironment in addition to endothelial injury in severe COVID-19. Changes within this signature were associated with either disease progression or recovery. In summary, our data suggest that besides a strong inflammatory response, severe COVID-19 is driven by endothelial activation and barrier disruption, whereby recovery depends on the regeneration of the endothelial integrity.


Conflict of interest statement

The authors declare no competing interests.

Figures

Fig. 1
Fig. 1
Dynamic changes in the entire immune cell composition in severe COVID-19 patients with memory T-cell development and plasmablast expansion. Immune cell distribution reflected by absolute numbers in patient blood was analyzed using TruCount analyses. a, b Multigroup comparison with a P value cutoff of 0.041 was used to identify significant differences among UE (n = 29), ICU (n = 58) and CONV (n = 28) for (a) principal component analysis and (b) heatmap analysis. Blue to yellow scale represents the expression values normalized to mean = 0, var = 1. Missing values are displayed in white. cf Numbers of different immune cells in patient blood. T cells: naive (CCR7 + CD45RO), central memory (CM, CCR7 + CD45RO + ), effector memory (EM, CCR7CD45RO + ) and TEMRA (CCR7CD45RO); B cells: naive (IgD + CD27) memory (mem, CD27 + IgD), switch precursor (switch pre, CD27 + IgD + ), effector memory (eff mem, IgDCD27) and plasmablasts (CD19 + CD20CD27 + CD38 + ). Black triangles represent last samples from deceased patients. UE: unexposed donors, ICU: intensive care unit patients, CONV: convalescent patients, CM: central memory, EM: effector memory, mem eff: memory effector, switch pre: switch precursor. Statistical analysis: ANOVA test with Turkey multiple comparison test or Kruskal–Wallis with test with Dunn’s multiple comparison test were performed. *P < 0.05, **P < 0.01, ***P < 0.001, ****P < 0.0001
Fig. 2
Fig. 2
Plasmablasts contribute to antibody development and blocking activity is associated with disease severity. ae Luminex-based multiplex assay was used to detect IgM, IgA, and IgG antibodies against S1-, RBD, S2-, or N-antigen of SARS-CoV-2 in patient sera. ac Percentage of seroconverted ICU (n = 58) and CONV (n = 28) patients for SARS-CoV-2-specific IgM (a), IgA (b), and IgG (c) antibodies. The threshold for positive samples was calculated based on the mean fluorescent intensity (MFI) of antibodies from 36 UEs + 2× standard deviation. d Antibody levels from UE (n = 36), ICU (n = 58), and CONV (n = 28) are displayed as MFI. e Correlation analysis between S- and N-specific antibodies from ICU patients and plasmablasts proportions. f Percentage of ICU (n = 58) and CONV (n = 28) which developed blocking antibodies against SARS-CoV-2 RBD (left) and efficacy of blocking activity (right), which was assessed by competitive ELISA. Efficient blocking was expressed as the percent blocking at a 1:50 serum dilution relative to a UE serum control. g Correlation analysis between COVID-19 severity markers (CRP levels, SOFA-, WHO score, and PF ratio) and blocking efficiency from ICU patients. Black triangles represent last samples from deceased patients. Statistical analysis: multigroup comparisons were performed using ANOVA test with Turkey multiple comparison test or Kruskal–Wallis with test with Dunn’s multiple comparison test. Two-group comparison was performed using Mann–Whitney test; Spearman correlation. *P < 0.05, **P < 0.01, ***P < 0.001, ****P < 0.0001
Fig. 3
Fig. 3
Expansion of activated and terminally differentiated T and NK cells in COVID-19 ICU patients. a Volcano plot visualizing two-group comparison of flow cytometry data including proportions of immune cells from ICU (n = 58) and UE (n = 29). b Significantly (P ≥ 0.05) altered immune cell subsets between ICU (n = 58) and UE (n = 29) ordered based on their fold change. c, d Representative flow cytometry plots. e, f Representative flow cytometry data of immune cell frequencies from UE (n = 29), ICU (n = 58) and CONV (n = 28). Statistical analysis: multigroup comparison was performed using ANOVA test with Turkey multiple comparison test or Kruskal–Wallis with test with Dunn’s multiple comparison test; *P < 0.05, **P < 0.01, ***P < 0.001, ****P < 0.0001
Fig. 4
Fig. 4
In severe COVID-19, lymphocyte dynamics correlate with disease progression. a, c, e Waterfall-plot representing correlation coefficient (r) of Spearman-correlation analysis between immune cell proportions of B cells, monocytes, lymphocytes, and granulocytes (a) or NK cells (c), or T cells (e) and disease duration as days after symptom onset (DASO) from ICUs (n = 58). Red columns represent significant results. Dotted lines represent the minimal Spearman-correlation coefficient (r) required for significant correlation. b, d, f Spearman-correlation analysis between proportions of plasmablasts (b), NK cells (d), or different T-cell populations (f) and DASO from ICUs (n = 58). G tSNE analysis of flow cytometry data from ICU (n = 58). A variance-value cutoff of 0.305 was used to identify significant differences within the ICU cohort. Patients were classified into two groups. Blue: late subgroup (n = 32), yellow: early subgroup (n = 26). h Heatmap of flow cytometry data including 98 immune cell populations from ICU (n = 58). A variance-value cutoff of 0.035 was used to identify significant differences within the ICU cohort. Samples and immune cell subsets were ordered according to hierarchical clustering. Blue to yellow scale represents the expression values normalized to mean=0, var=1. Missing values are displayed in white. i, j Representative immune cell proportions from early (n = 26) and late patients (n = 32) within the ICU cohort. Statistical analysis: Unpaired t test or Mann–Whitney test; Spearman correlation. *P < 0.05, **P < 0.01, ***P < 0.001, ****P < 0.0001
Fig. 5
Fig. 5
Systemic inflammation and endothelial injury in COVID-19 patients. Cytokine concentrations in patient sera were measured by Luminex-based multiplex assay. a Heatmap of cytokine data including 83 plasma proteins from UE (n = 36), ICU (n = 58), and CONV (n = 28). P value cutoff of 0.01 was used to identify significant differences among the three cohorts. Samples and immune cell subsets were ordered using to hierarchical clustering. Blue to yellow scale represents the expression values normalized to mean=0, var=1. Missing values are displayed in white. b Volcano plot visualizing a two-group comparison of plasma protein data from ICU (n = 58) and UE (n = 36). c Correlation matrix of 83 plasma proteins from ICUs. Spearman correlation was used to calculate correlation coefficients, which were displayed in circles. The strength of correlation was depicted by circle size. Cytokines were ordered using hierarchical clustering. Red to blue scale indicates the prevalence of each subset. d Representative cytokine concentrations from UE (n = 36), ICU (n = 58), and CONV (n = 28). Statistical analysis: Kruskal–Wallis test with Dunn’s multiple comparison test was performed. *P < 0.05, **P < 0.01, ***P < 0.001, ****P < 0.0001
Fig. 6
Fig. 6
Core plasma protein signature of severe COVID-19 consists of 11 inflammatory mediators and endothelial factors. Cytokine concentrations in patient sera were measured by Luminex-based multiplex assay. a, c Waterfall-plot representing correlation coefficient (r) of Spearman-correlation analysis between cytokines and disease duration as DASO (a) or SOFA score (c) from ICUs (n = 58). Red columns represent significant results. Dotted lines represent the minimal Spearman-correlation coefficient (r) required for significant correlation. b Spearman-correlation analysis between representative cytokines and DASO. d Spearman correlation analysis of representative cytokines with SOFA score. e Venn diagram displaying significantly positive correlations between plasma proteins and CRP levels, SOFA-, and WHO score. Triangles represent the last samples from deceased patients. Statistical analysis: Spearman correlation. *P < 0.05, **P < 0.01, ***P < 0.001, ****P < 0.0001
Fig. 7
Fig. 7
Endothelial dysregulation as a major contributor to severe COVID-19. Plasma protein concentrations in patient sera were measured by Luminex-based multiplex assay (a) tSNE analysis of 83 plasma protein data from ICU (n = 58). A variance-value cutoff of 0.146 was used to identify significant differences within the ICU cohort. Patients were classified into three subgroups. Green: subgroup 1 (sub1), red: subgroup 2 (Sub2), blue: subgroup 3 (Sub3). b Heatmap of 83 plasma protein from ICU (n = 58). A variance cutoff of 0.146 was used to identify significant differences among the three cohorts. Samples and cytokines were ordered using hierarchical clustering. Blue to yellow scale represents the expression values normalized to mean = 0, var = 1. Missing values are displayed in white. c Distribution of severity markers SOFA, WHO-score, CRP levels, PF ratio, and disease duration (DASO) among the three ICU subgroups. d Mean values of SOFA-, WHO-score, CRP level, PF ratio, and DASO for the three ICU subgroups. e Representative cytokine concentrations from ICU subgroups Sub1 (n = 14), Sub2 (n = 16), and Sub3 (n = 28). Statistical analysis: ANOVA test with Turkey multiple comparison test or Kruskal–Wallis with test with Dunn’s multiple comparison test were performed. *P < 0.05, **P < 0.01, ***P < 0.001, ****P < 0.0001

References

    1. Thi Nhu Thao T, et al. Rapid reconstruction of SARS-CoV-2 using a synthetic genomics platform. Nature. 2020;582:561–565. - PubMed
    1. Yuki K, Fujiogi M, Koutsogiannaki S. COVID-19 pathophysiology: a review. Clin. Immunol. 2020;215:108427. - PMC - PubMed
    1. Jain V, Yuan JM. Predictive symptoms and comorbidities for severe COVID-19 and intensive care unit admission: a systematic review and meta-analysis. Int. J. Public. Health. 2020;65:533–546. - PMC - PubMed
    1. Hoffmann M, et al. SARS-CoV-2 cell entry depends on ACE2 and TMPRSS2 and is blocked by a clinically proven protease inhibitor. Cell. 2020;181:271–280.e8. - PMC - PubMed
    1. Teuwen LA, Geldhof V, Pasut A, Carmeliet P. COVID-19: the vasculature unleashed. Nat. Rev. Immunol. 2020;20:389–391. - PMC - PubMed

Publication types

MeSH terms