. 2021 Dec 10;12(1):7229.
doi: 10.1038/s41467-021-27444-9.

Simultaneous two-photon imaging of action potentials and subthreshold inputs in vivo

Affiliations

Simultaneous two-photon imaging of action potentials and subthreshold inputs in vivo

Yuki Bando et al. Nat Commun. .

Abstract

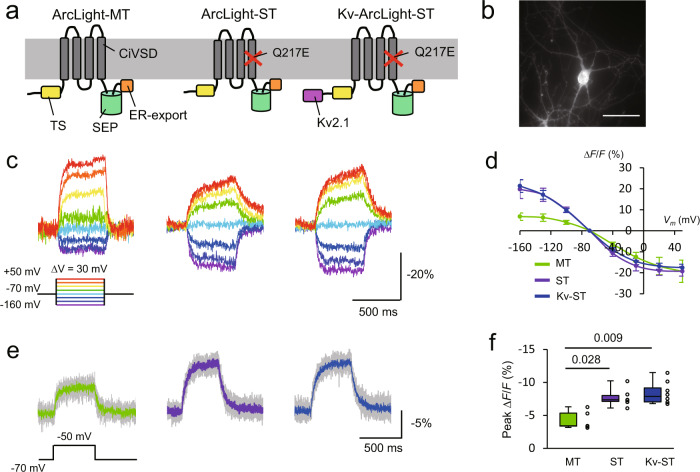
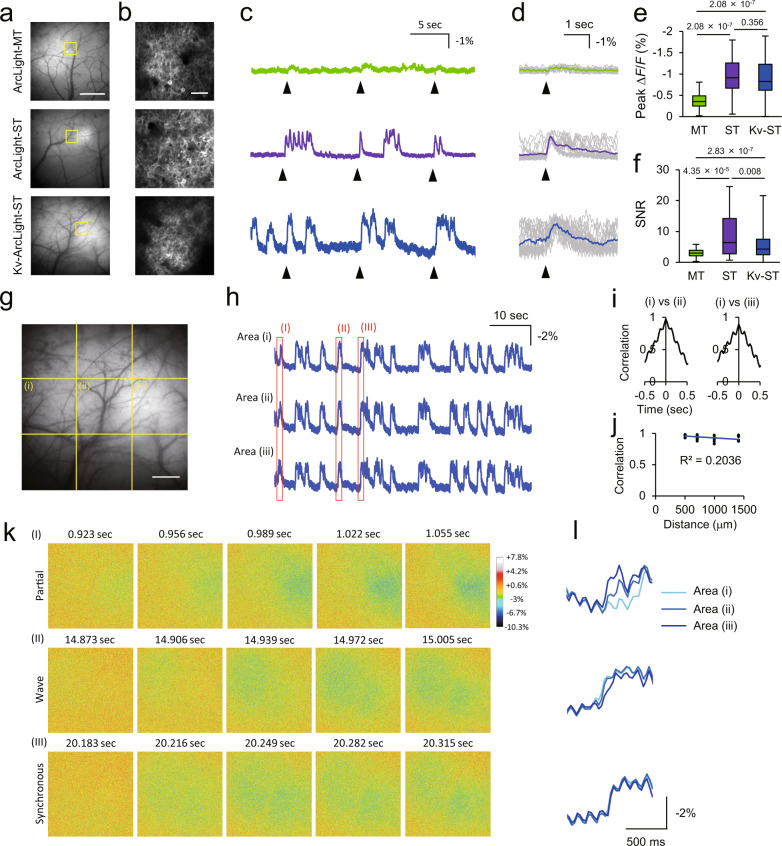
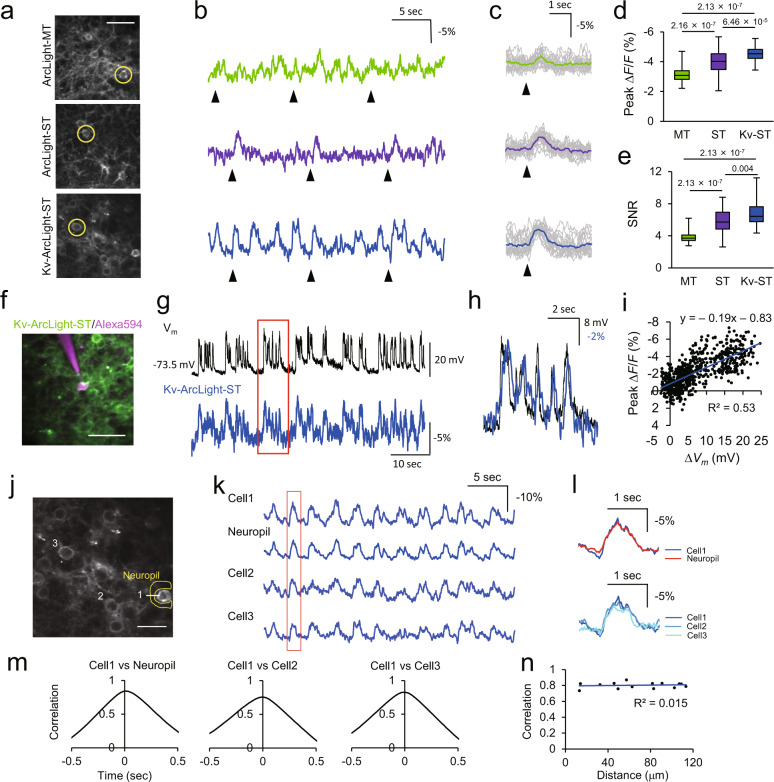
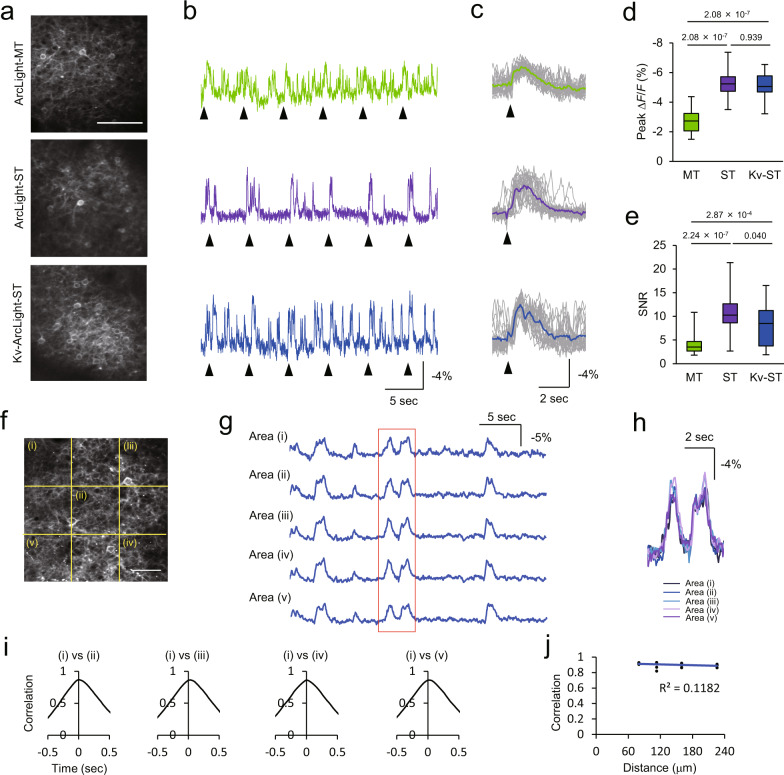
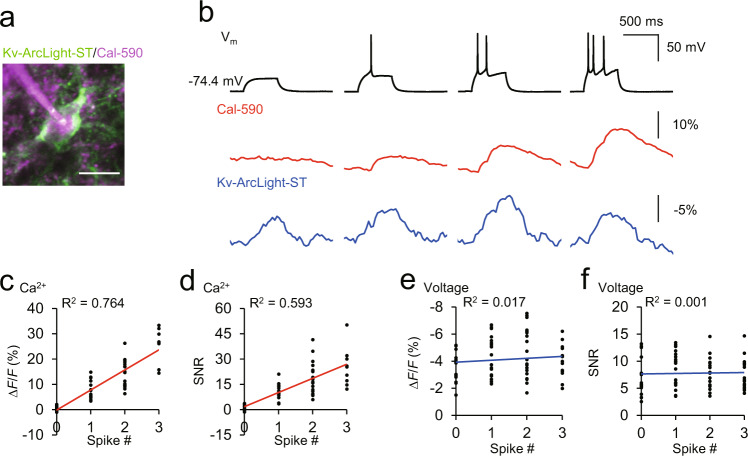
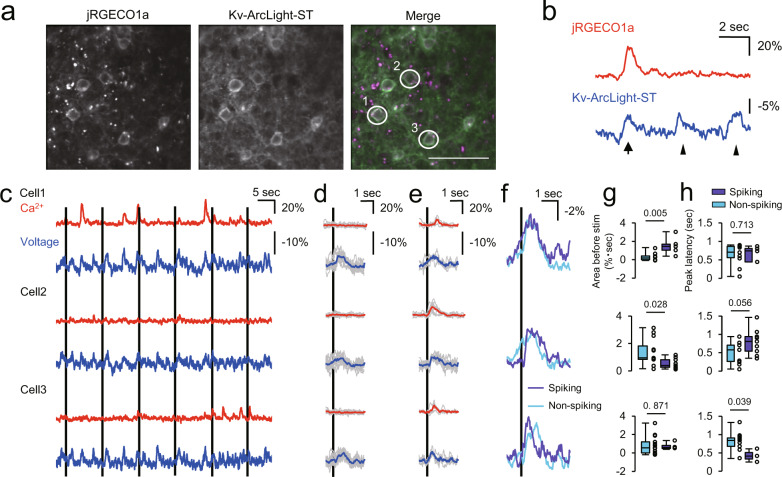
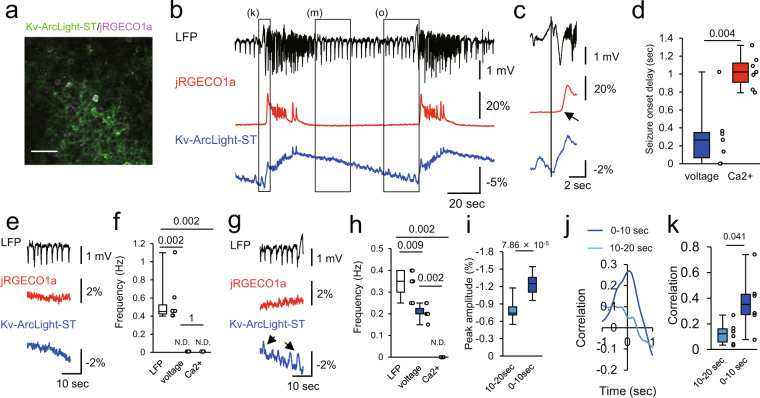
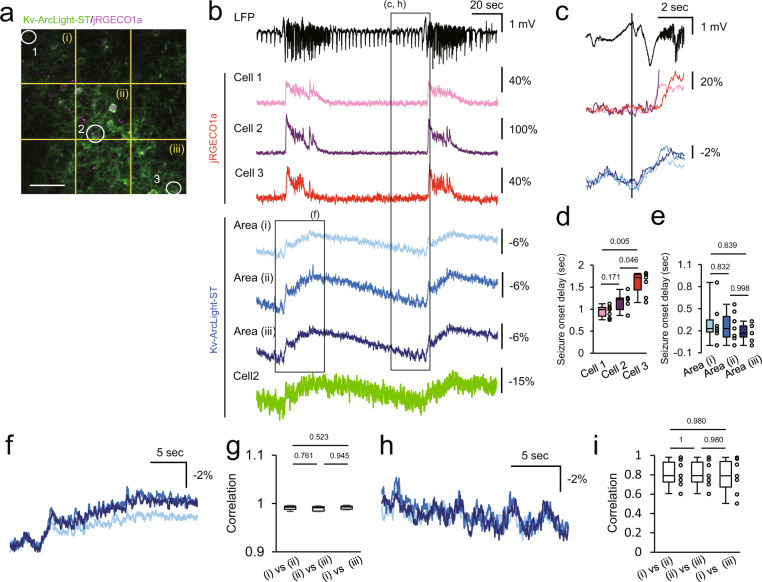
To better understand the input-output computations of neuronal populations, we developed ArcLight-ST, a genetically-encoded voltage indicator, to specifically measure subthreshold membrane potentials. We combined two-photon imaging of voltage and calcium, and successfully discriminated subthreshold inputs and spikes with cellular resolution in vivo. We demonstrate the utility of the method by mapping epileptic seizures progression through cortical circuits, revealing divergent sub- and suprathreshold dynamics within compartmentalized epileptic micronetworks. Two-photon, two-color imaging of calcium and voltage enables mapping of inputs and outputs in neuronal populations in living animals.


Conflict of interest statement

The authors declare no competing interests.

Figures

Fig. 1
Fig. 1. Design and characterization of ArcLight variants with one-photon imaging in vitro.
a Schematic drawing of ArcLight variants. TS, the export signal from the Golgi apparatus. SEP super ecliptic pHluorin. b A one-photon image of a cultured hippocampal neuron expressing Kv-ArcLight-ST. Scale bar, 50 μm. ArcLight variants were expressed under CMV promoter using calcium phosphate. c Optical signals during depolarizing and hyperpolarizing voltage steps in voltage-clamp mode. d Relationship between membrane potential and normalized fluorescence (mean ± SEM). n = 5 cells for each ArcLight variant. e Optical responses to small depolarizing voltage steps of 20 mV from −70 mV. Gray traces are individual trials, and colored traces are an average of five trials. f Peak fluorescence change in response to depolarizing voltage steps of 20 mV. n = 5 cells (ArcLight-MT), 6 (ArcLight-ST), 8 (Kv-ArcLight-ST). The Steel-Dwass test was used for statistical analysis. Excitation: 460–500 nm, ~5.5 mW (~ 36 mW/mm2) at the stage. Imaging was performed at 1 kHz. On each box, the central line represents the median, and the bottom and the top edges of the box represent the 25th and 75th percentile, respectively. The lower and the upper whiskers extend to the minimum and the maximum data points, respectively. Numbers on the graphs represent P values.
Fig. 2
Fig. 2. Performance of ArcLight variants with one-photon wide-field imaging in vivo.
a One-photon images of mouse primary visual cortex (V1) expressing ArcLight variants. Scale bar, 1 mm. b Two-photon images of areas indicated with yellow square in (a). Scale bar, 50 μm. c Representative optical traces of ArcLight variants. Arrowheads indicate the timing of visual stimulation with 10 ms flash light. d Stimulus-triggered average. Gray traces are individual trials, and colored traces are average over 20 trials. Arrowheads indicate the timing of visual stimulation. e, f Peak fluorescence change (e) and signal-to-noise ratio (SNR) (f) for visually evoked optical signals. SNR was calculated as peak ΔF/F over standard deviation of the baseline fluctuation for 0.5 s before visual stimulation. n = 5 FOVs from 5 mice in each condition. Steel-Dwass test was used for statistical analysis. gl Spatiotemporal structure of subthreshold events in vivo. g An enlarged image of V1 expressing Kv-ArcLight-ST shown in (a). Average optical traces of fragments of FOV indicated with dotted lines are shown in (h). Scale bar, 500 μm. h Fluorescence change of Kv-ArcLight-ST. i Cross correlation among areas. j Relationship between correlation and distance. This result suggests that subthreshold events are roughly correlated among areas. k Representative propagation patterns of subthreshold events indicated with red rectangles in (h). Event I shows the partial activation in the right side of the FOV, event (II) shows the propagating activity from left to right in the FOV, and event (III) shows nearly synchronous activation in the FOV. (l) Magnified optical traces in areas (I)–(III) indicated with red rectangles in (h). Imaging was performed in anaesthetized mice with isoflurane (1.5% v/v). Excitation: 460–500 nm, ~1 mW (~0.05 mW/mm2) at the imaging plane. In each box plots, the central line represents median, and the bottom and the top edges of the box represent 25th and 75th percentile, respectively. The lower and the upper whiskers extend to the minimum and the maximum data points, respectively. Numbers on the graphs represent P values.
Fig. 3
Fig. 3. Performance of ArcLight variants with two-photon imaging in vivo.
a Two-photon images of cells expressing ArcLight variants in V1. Scale bar, 40 μm. b Representative traces of ArcLight variants in the cells indicated with circles in (a) in vivo. Arrowheads indicate timing of visual stimulation with flash light of 10 ms. c Stimulus-triggered average. Gray traces are individual trials, and colored traces are average of 20 trials. Arrowheads indicate timing of visual stimulation. d, e Peak ΔF/F (d) and SNR (e) for visually evoked optical signals. n = 56 cells from 2 mice (ArcLight-MT), 77 cells from 5 mice (ArcLight-ST) and 62 cells from five mice (Kv-ArcLight-ST). Steel-Dwass test was used for statistical analysis. f A two-photon image of a Kv-ArcLight-ST-expressing neuron recorded with whole-cell patch-clamp in vivo. Alexa594 was filled through a patch pipette. Scale bar, 50 μm. g Simultaneous current-clamp recording and two-photon voltage imaging in vivo. h Magnified optical trace overlaid with electrical trace in the area shown with a red rectangle in (g). i Correlation between electrical and optical signals (2 cells from 2 mice). jn Spatiotemporal structure of subthreshold events in the local cortical circuits in vivo. j Two-photon image of layer 2/3 neurons expressing Kv-ArcLight-ST. Optical traces of cells and a neuropil indicated with white number and yellow characters are shown in (k). Scale bar, 25 μm. k Fluorescence change of Kv-ArcLight-ST. l Magnified traces in the area shown with a red rectangle in (k). m Cross correlation between cells and neuropil. n Relationship between correlation and distance of neurons. Imaging was performed 150–300 μm below the pial surface (two-photon) in lightly anaesthetized mice (isoflurane, ~1.5% v/v). Excitation: 940 nm, 130–150 mW (0.50–0.61 μW/pixel) at the imaging plane. In each box plots, the central line represents median, and the bottom and the top edges of the box represent 25th and 75th percentile, respectively. The lower and the upper whiskers extend to the minimum and the maximum data points, respectively. Numbers on the graphs represent P values.
Fig. 4
Fig. 4. Two-photon imaging of optical field potential (OFP) with ArcLight variants in vivo.
a Two-photon image of layer 2/3 neurons expressing ArcLight variants in V1. Average optical traces of entire field-of-view are shown in (b). Scale bar, 100 μm. b, c Fluorescence change of ArcLight variants (b) and stimulus-triggered average over 20 visual stimuli (c). Individual trials are shown with gray. Arrowheads indicate the timing of visual stimuli with flash light for 10 ms. d, e Peak ΔF/F (d) and SNR (e) of OFP in response to visual stimuli. Steel-Dwass test was used for statistical analysis. n = 40 events for each condition. Visual response was recorded 20 times in each FOV. Two mice were examined in each condition. f Two-photon image of primary visual cortex expressing Kv-ArcLight-ST under CAG promoter. Optical traces of small areas indicated with yellow dotted lines are shown in (g). Scale bar, 50 μm. g Fluorescence change of Kv-ArcLight-ST. h Magnified traces in the area shown with a red rectangle in (g). Optical signals of neighboring areas showed similar dynamics. i Cross-correlation between areas. j Relationship between correlation and distance areas. Two-photon imaging was performed in anaesthetized mice with isoflurane (1.5% v/v). Excitation: 940 nm, 130–150 mW (0.50–0.61 μW/pixel) at the imaging plane. In each box plot, the central line represents the median, and the bottom and the top edges of the box represent the 25th and 75th percentile, respectively. The lower and the upper whiskers extend to the minimum and the maximum data points, respectively. Numbers on the graphs represent P values.
Fig. 5
Fig. 5. Discrimination of spiking and subthreshold events with simultaneous two-photon voltage and calcium imaging in brain slices.
a Two-photon image of layer 2/3 neurons expressing Kv-ArcLight-ST. Red calcium indicator, Cal-590 was filled through a patch pipette. Scale bar, 20 μm. b Simultaneous whole-cell recording, two-photon voltage, and calcium imaging. Depolarizing current steps were applied to induce subthreshold depolarization, single and multiple action potentials. Resting potential was -68.5 ± 2.6 mV (mean ± SEM, n = 8 cells). c, d Correlation between spike number and fluorescence change (c) and SNR (d) of Cal-590. Cal-590 showed spike number-dependent fluorescence change, and optical signal was not detectable for subthreshold events (ΔF/F, 0.57 ± 0.21%; SNR, 1.10 ± 0.38, mean ± SEM). e, f Correlation between spike number and fluorescence change (e) and SNR (f) of Kv-ArcLight-ST. Optical signal of Kv-ArcLight-ST was not spike number-dependent, but was sensitive to subthreshold events (ΔF/F, −3.41 ± 0.33%; SNR, 6.57 ± 0.91, mean ± SEM). Large depolarizing events (ΔVm > 20 mV) were analyzed. Eight cells from three mice were examined. Excitation: 990 nm, 150–180 mW (0.57–0.69 μW/pixel) at the imaging plane.
Fig. 6
Fig. 6. Simultaneous two-photon voltage and calcium imaging in physiological conditions in vivo.
a wo-photon images of layer 2/3 pyramidal neurons co-expressing Kv-ArcLight-ST and jRGECO1a in V1 in vivo. Scale bar, 50 μm. b Simultaneously recorded dynamics of calcium and voltage. Arrow indicates spiking event, and arrowheads putative subthreshold events. c Multi-cell recording of voltage and calcium dynamics. Black lines indicate timing of visual stimulation. Cell numbers correspond with those in (a). d, e Stimulus-triggered average of non-spiking (d) and spiking (e) events. Gray traces are individual trials, and colored traces are average traces. Black line indicates the timing of visual stimulation. f Average voltage traces for spiking and non-spiking events. Black line indicates timing of visual stimulation of 10 ms. g, h Area of membrane potential change for 500 ms ahead of visual stimulation (g) and Peak latency of visually evoked potential from the timing of stimulation (h). n = 10 events (cell 1, non-spiking), 5 (cell 1, spiking), 11 (cell 2, non-spiking), 9 (cell 2, spiking), 13 (cell 3, non-spiking), 3 (cell 3, spiking). Mann–Whitney test was used for statistical analysis. Kv-ArcLight-ST and jRGECO1a were expressed under a CAG promoter using in utero electroporation. Imaging was performed 150–300 μm below the surface (two-photon) in lightly anaesthetized mice (isoflurane, ~1.5% v/v). Excitation: 990 nm, 150–180 mW (0.57–0.69 μW/pixel) at the imaging plane. In each box plots, the central line represents median, and the bottom and the top edges of the box represent 25th and 75th percentile, respectively. The lower and the upper whiskers extend to the minimum and the maximum data points, respectively. Numbers on the graphs represent P values.
Fig. 7
Fig. 7. Simultaneous two-photon voltage and calcium imaging in pathophysiological conditions in vivo.
a A two-photon image of layer 2/3 pyramidal neurons co-expressing Kv-ArcLight-ST and jRGECO1a in V1. 4-AP was injected about 1–1.5 mm away from the imaging site, while LFP was recorded at the injection site. Scale bar, 50 μm. b LFP, calcium and voltage dynamics during epileptic activity. OFP signals were analyzed. c Magnified traces around onset of seizure indicated with left rectangle in (a). Black line indicates the onset of seizure. Arrow indicates delayed onset of calcium transient. d Onset delay of voltage and calcium signals at the imaging site. n = 6 events from 2 mice. Mann–Whitney test was used for statistical analysis. e Interictal period after seizure indicated with middle rectangle in (b). f Frequency of interictal events. n = 6 events from 2 mice. Steel-Dwass test was used for statistical analysis. N.D., not detected. g Interictal period right before seizure onset indicated with rectangle on the right side in (b). h Frequency of interictal events. n = 6 events from 2 mice. Steel-Dwass test was used for statistical analysis. ND not detected. Arrows indicate interictal events detected at the imaging site. i Peak amplitude of interictal EPSPs recorded with Kv-ArcLight-ST at 0–10 s before seizure and 10–20 s before seizure onset. n = 13 events in each condition. Mann–Whitney test was used for statistical analysis. j, k An example of cross-correlation between LFP and signal of Kv-ArcLight-ST at 10–20 s before LFP seizure onset and 0–10 s before seizure during the late interictal period shown in (g). n = 6 events in each condition. The Steel-Dwass test was used for statistical analysis. In each box plots, the central line represents median, and the bottom and the top edges of the box represent 25th and 75th percentile, respectively. The lower and the upper whiskers extend to the minimum and the maximum data points, respectively. Numbers on the graphs represent P values.
Fig. 8
Fig. 8. Spatiotemporal structure of sub- and suprathreshold events in acute focal epileptic seizures in vivo.
a Two-photon image of layer 2/3 neurons expressing Kv-ArcLight-ST and jRGECO1a under CAG promoter in V1. Cells and neuropil indicated with white numbers and yellow characters; their optical traces are shown in (b). Scale bar, 50 μm. b LFP at the 4-AP injection site and fluorescence change of Kv-ArcLight-ST and jRGECO1a about 1–1.5 mm away from the injection site. c Magnified traces from the dotted rectangle in (b). Optical signals of calcium and voltage showed different dynamics at LFP seizure onset. At the imaging site, suprathreshold calcium imaging showed sequential recruitment of neighboring cells, whereas voltage signals were nearly synchronized. d, e Suprathreshold (calcium imaging) (d) and subthreshold (voltage imaging) during LFP seizure onset (e). n = 7 events from 2 mice. Steel-Dwass test was used for statistical analysis. f Optical signals of Kv-ArcLight-ST in 3 areas during seizure. Colors of traces correspond to those in (b). g Correlation of OFP in neighboring areas during electrographic (LFP) seizure. n = 7 events from 2 mice. h Optical signals of Kv-ArcLight-ST in three areas during late interictal period. Individual trace colors correspond to those in (b). i Correlation of OFP in neighboring areas during late interictal period. Optical signals showed similar dynamics in the local cortical circuit in the imaged field of view. n = 7 events from 2 mice. Two-photon imaging was performed in lightly anaesthetized mice with isoflurane (~1.5% v/v). Excitation wavelength was 990 nm, and excitation power was 150–180 mW (0.57–0.69 μW/pixel) at the imaging plane. Steel-Dwass test was used for statistical analysis. In each box plots, the central line represents median, and the bottom and the top edges of the box represent 25th and 75th percentile, respectively. The lower and the upper whiskers extend to the minimum and the maximum data points, respectively. Numbers on the graphs represent P values.

References

    1. Poulet JF, Petersen CC. Internal brain state regulates membrane potential synchrony in barrel cortex of behaving mice. Nature. 2008;454:881–885. doi: 10.1038/nature07150. - DOI - PubMed
    1. Jayant K, et al. Flexible nanopipettes for minimally invasive intracellular electrophysiology in vivo. Cell Rep. 2019;26:266–278. doi: 10.1016/j.celrep.2018.12.019. - DOI - PMC - PubMed
    1. Jin L, et al. Single action potentials and subthreshold electrical events imaged in neurons with a fluorescent protein voltage probe. Neuron. 2012;75:779–785. doi: 10.1016/j.neuron.2012.06.040. - DOI - PMC - PubMed
    1. Gong Y, et al. High-speed recording of neural spikes in awake mice and flies with a fluorescent voltage sensor. Science. 2015;350:1361–1366. doi: 10.1126/science.aab0810. - DOI - PMC - PubMed
    1. Piatkevich KD, et al. Population imaging of neural activity in awake behaving mice. Nature. 2019;574:413–417. doi: 10.1038/s41586-019-1641-1. - DOI - PMC - PubMed

Publication types