. 2021 Dec 10;12(1):7198.
doi: 10.1038/s41467-021-27393-3.

RNA modifications detection by comparative Nanopore direct RNA sequencing

Affiliations

RNA modifications detection by comparative Nanopore direct RNA sequencing

Adrien Leger et al. Nat Commun. .

Abstract

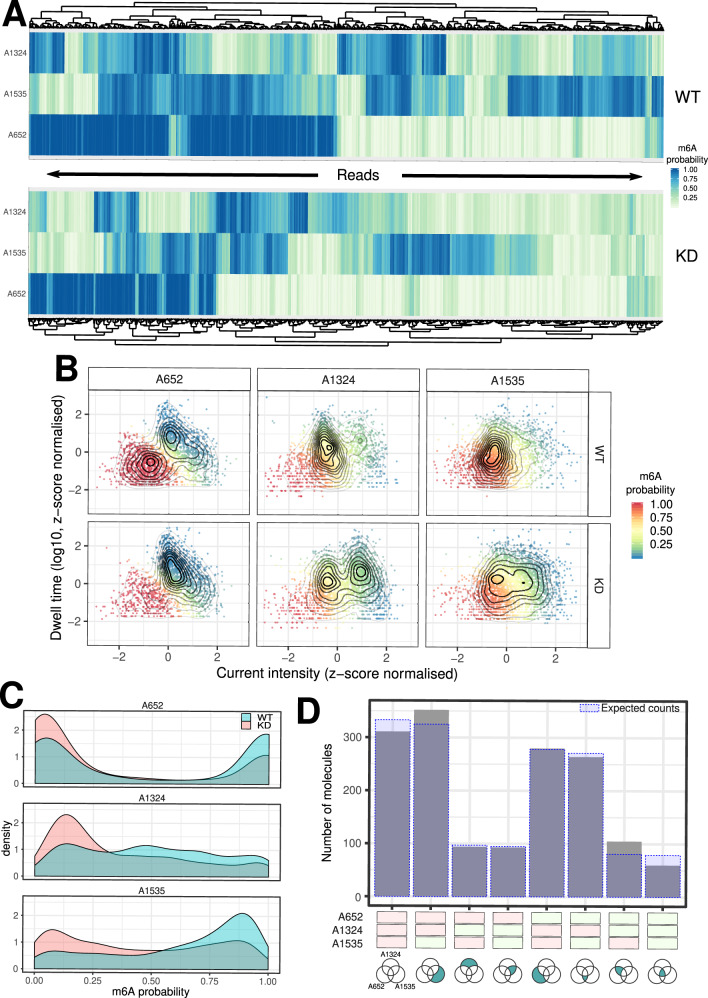
RNA molecules undergo a vast array of chemical post-transcriptional modifications (PTMs) that can affect their structure and interaction properties. In recent years, a growing number of PTMs have been successfully mapped to the transcriptome using experimental approaches relying on high-throughput sequencing. Oxford Nanopore direct-RNA sequencing has been shown to be sensitive to RNA modifications. We developed and validated Nanocompore, a robust analytical framework that identifies modifications from these data. Our strategy compares an RNA sample of interest against a non-modified control sample, not requiring a training set and allowing the use of replicates. We show that Nanocompore can detect different RNA modifications with position accuracy in vitro, and we apply it to profile m6A in vivo in yeast and human RNAs, as well as in targeted non-coding RNAs. We confirm our results with orthogonal methods and provide novel insights on the co-occurrence of multiple modified residues on individual RNA molecules.


Conflict of interest statement

E.B. is a paid consultant and shareholder of O.N.T. T.K. is a co-founder of Abcam and a co-founder of STORM Therapeutics Limited. P.P.A. was a Research Scientist and paid Consultant at STORM Therapeutics Limited. T.L. is a paid consultant of STORM Therapeutics Limited and received reimbursement of registration fees from ONT to speak at an event. A.L. received free consumables from ONT during the project and is currently an employee of ONT. The remaining authors declare no competing interests.

Figures

Fig. 1
Fig. 1. Overview of data preparation and Nanocompore steps.
A Raw fast5 reads from 2 conditions are basecalled with Guppy, filtered with Samtools and the signal is then resquiggled with Nanopolish eventalign. The output of Nanopolish is then collapsed and indexed at the kmer level by NanopolishComp Eventalign_collapse. B Nanocompore aggregates median intensity and dwell time at transcript position level. The data is compared in a pairwise fashion position per position using univariate tests (KS, MW, t-tests) and/or a bivariate GMM classification method. The p-values are corrected for multiple tests and these data are saved in a database for further analyses. The signal graph is as an illustration not representative of all possible kmers.
Fig. 2
Fig. 2. Nanocompore benchmarks with synthetic modified oligonucleotides.
A Nanocompore p-values (GMM logit method, y-axis) reported at each position (x-axis) along three oligonucleotides of 100nt carrying multiple modifications at defined positions. Oligo1: three m6A sites in different sequence contexts; Oligo2: I, m5C and Ψ; Oligo3: m6,2A, m1G and 2’-OMeA Kmers shown in blue represent the peaks identified through Nanocompore’s peak calling procedure. Shaded areas contain the 5 consecutive kmers that contain each modification. Each oligonucleotide was sequenced in a separate flowcell, producing on average 648,543.5 reads after quality filtering. The dotted horizontal lines correspond to a p-value of 0.01. B Nanocompore ROC curves for m6A detection (Oligo1) at varying levels of coverage and using different statistical tests (GMM logit test, KS test on intensity or KS test on dwell time). C F1 score for m6A detection (Oligo1) with the GMM logit test, KS test on intensity or KS test on dwell time at varying levels of coverage. Nominal p-value threshold of 0.05. D, E True Positive (D) and False Positive (E) rates for m6A detection (Oligo1). The values reported are the means of n = 100 artificial samples generated as described (see Materials and Methods). The error bars show the 95% confidence interval. TPR and FPR were calculated at a nominal p-value threshold of 0.05.
Fig. 3
Fig. 3. Nanocompore benchmarks with simulated modification stoichiometry and knock down efficiency.
A Diagram illustrating the procedure used to generate in silico datasets at varying levels of coverage, modification stoichiometry and knock down efficiency. B Plots showing the F1 score for m6A detection (Oligo1) with the various tests implemented in Nanocompore at varying levels of (1) coverage (x-axis), (2) modification reduction in control (columns), and (3) percentage of modified reads (rows). Nominal p-value threshold of 0.05.
Fig. 4
Fig. 4. m6A profiling in MOLM13 cells.
A Sharkfin plot showing the absolute value of the Nanocompore logistic regression log odd ratio (GMM logit method with context 2, x-axis) plotted against its p-value (-log10, y-axis, see Material and Methods). Each point represents a specific kmer of a transcript. Red points are DRACH kmers. B Metagene plot showing the distribution of significant m6A sites identified by Nanocompore (blue) and miCLIP (red). C Genome browser screenshot showing METTL3-dependent m6A sites in the ACTB transcript. The p-value track reports the Nanocompore GMM+Logistic regression method (see Material and Methods). D–F As in C but showing the three most significant β-actin sites at higher magnification. The sequence reported at the bottom corresponds to the RNA sequence in the 3’ to 5’ orientation, as the ACTB transcript is encoded on the minus strand. The m6A consensus GGACU sequences are highlighted in red. G Sylamer plot showing kmer enrichment in Nanocompore significant sites. The x-axis reports all Nanocompore sites with p-value<0.5 ranked from the most to the least significant. The y-axis reports the uncorrected Sylamer hypergeometric p-value of enrichment (one-sided test) of a certain motif in the first x Nanocompore sites vs the rest. The vertical dotted line delineates Nanocompore sites with p-value<0.01 (to the left of the line). The red line corresponds to the combined p-value (Fisher’s method) of all DRACH kmers. H m6A miCLIP coverage of clusters of significant Nanocompore sites (GMM logit (context 2) p-value<0.01). The y-axis shows the mean input-normalised miCLIP counts across sites. Shaded regions on the plot represent the mean±the standard deviation at each position in the profile (WT miCLIP n = 4, KO n = 2). Both the mean and bounds were smoothed using loess regression with a span of 0.6. The difference between WT and KO in the windows 0+/-20nt is statistically significant (p-value = 7.90 × 10−11, Mann-Whitney test). I Plot showing the fraction of Nanocompore significant peaks supported by a varying number of miCLIP reads (x-axis) in WT MOLM13 cells.
Fig. 5
Fig. 5. Single molecule identification of m6A sites.
A Heatmap organised by hierarchical clustering showing the probability of A652, A1324, and A1535 in the β-actin gene to be modified in the WT and METTL3 KD samples. Each column corresponds to a single molecule. B Scatter plot with overlaid kernel density estimates showing the scaled median intensity vs the scaled log10 dwell time for each read covering A652, A1324 and A1535. Data points are colour coded according to the probability that the read belongs to the cluster of m6A modified reads. For visualisation purposes the x- and y-axis were limited to the +/-3 range. C Density plot showing the distribution of modification probability for A652, A1324, and A1535 of β-actin in WT (blue) and KD (red). D Bar chart showing the number of molecules identified in each of the 8 possible m6A configurations for the A652, A1324, and A1535 sites of β-actin. Each site was considered modified if the modification probability was >0.75. The shaded blue areas indicate the expected number of molecules in each given configuration under the null hypothesis of independence of the three modifications.
Fig. 6
Fig. 6. m6A identification in 7SK RNA.
A On the left, the secondary structure of 7SK showing positions of known protein binding sites and structural conservation. On the right, the secondary structure of 7SK with the Nanocompore p-value (METTL3-KD vs WT, GMM-logit test) overlaid as a colour scale. For each nucleotide the colour indicates the lowest p-value among those of the 5 kmers that overlap it. Only p-values<0.01 are shown in colour. B m6A profile of 7SK, showing the Nanocompore GMM-logit p-value (y axis, -log10) across the transcript length. C Scatter plot showing the scaled median intensity vs the scaled log10 dwell time for each read covering kmer 41 of 7SK. Each point shows data for a distinct read colour coded according to the sample. The contour lines show the kernel density estimates for the two samples. For visualisation purposes the x- and y- axis are truncated at -4 and +3 respectively. D Violin plots showing the distributions of median intensity (top) and scaled log10 dwell time (bottom) for the Hexim1 binding sites and neighbouring kmers. All coordinates refer to the first nucleotide of each kmer relative to ENST00000636484. The cross mark indicates the intensity and dwell time value of the kmer according to the unmodified model. E m6A RIP-qPCR results in three non-overlapping regions of 7SK in WT and METTL3 KD MOLM13 cells. Bars show the mean of 6 independent experiments. Vertical bars show the standard error of the mean. The p-values were calculated using a one-sided Welch’s t-test. Full uncropped scans of Western Blots confirming METTL3 KD are shown in Figure S14.

References

    1. Boccaletto P, et al. MODOMICS: a database of RNA modification pathways. 2017 update. Nucleic Acids Res. 2018;46:D303–D307. - PMC - PubMed
    1. Mathlin, J., Le Pera, L. & Colombo, T. A Census and categorization method of epitranscriptomic marks. Int. J. Mol. Sci. 21, (2020). - PMC - PubMed
    1. He PC, He CmA. RNA methylation: from mechanisms to therapeutic potential. EMBO J. 2021;40:e105977. - PMC - PubMed
    1. Dominissini D, et al. Topology of the human and mouse m6A RNA methylomes revealed by m6A-seq. Nature. 2012;485:201–206. - PubMed
    1. Meyer KD, et al. Comprehensive analysis of mRNA methylation reveals enrichment in 3’ UTRs and near stop codons. Cell. 2012;149:1635–1646. - PMC - PubMed

Publication types