. 2021 Dec 10;12(1):7200.
doi: 10.1038/s41467-021-27312-6.

Multiple site place-of-care manufactured anti-CD19 CAR-T cells induce high remission rates in B-cell malignancy patients

Affiliations

Multiple site place-of-care manufactured anti-CD19 CAR-T cells induce high remission rates in B-cell malignancy patients

Michael Maschan et al. Nat Commun. .

Abstract

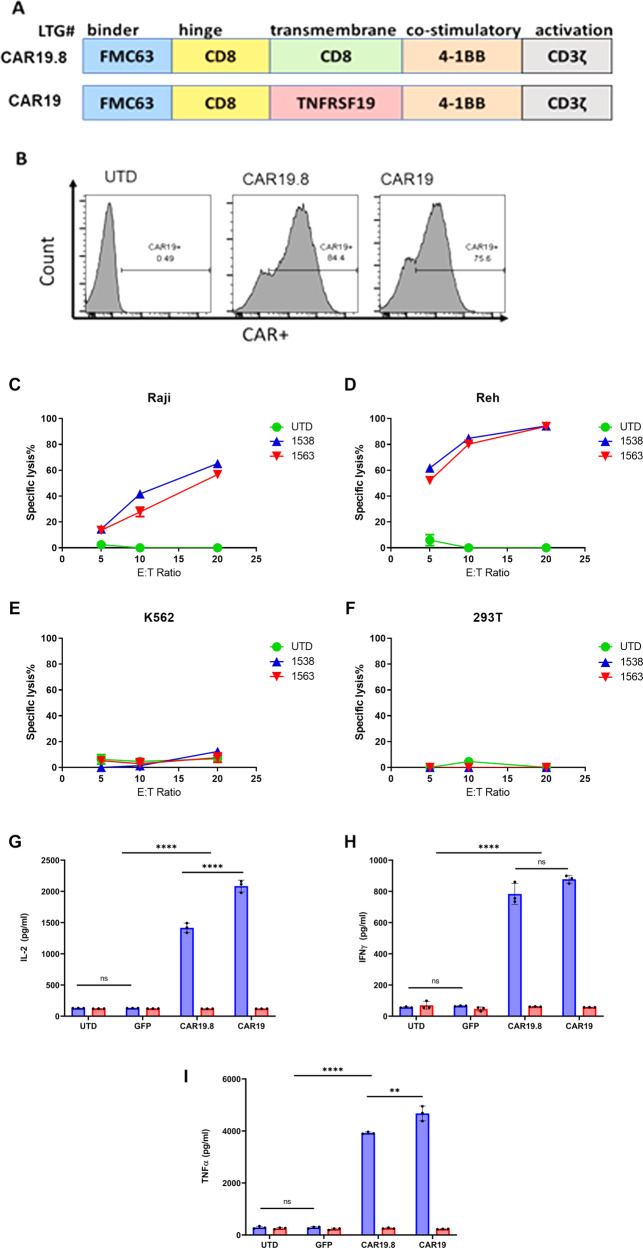
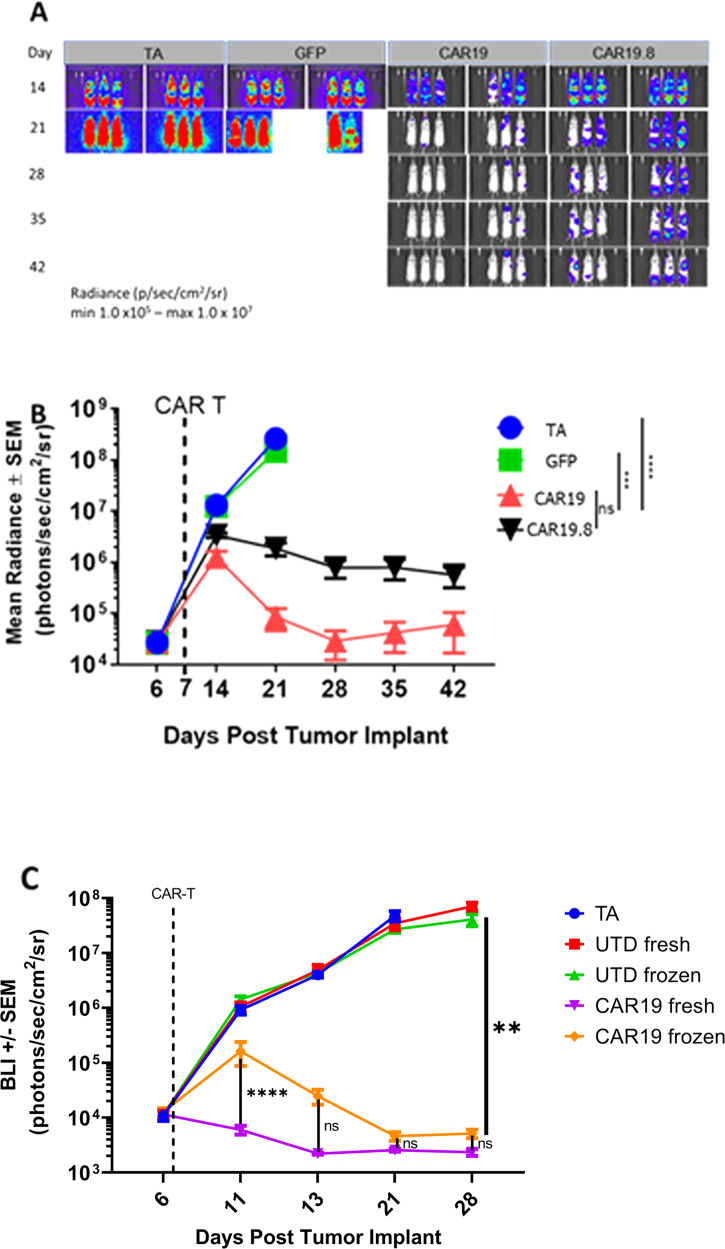
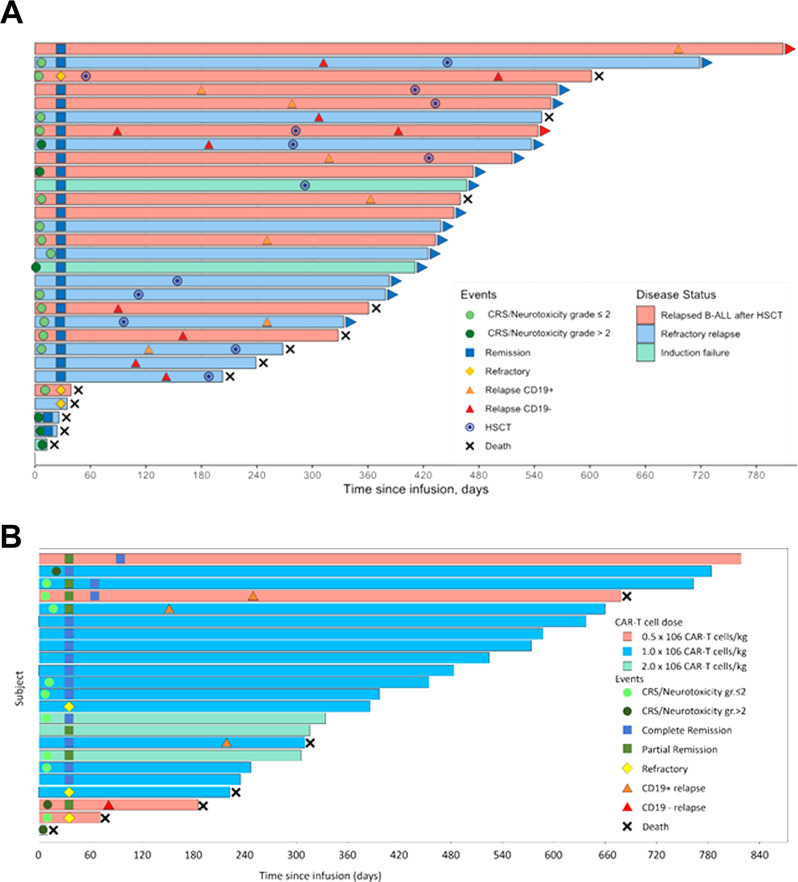
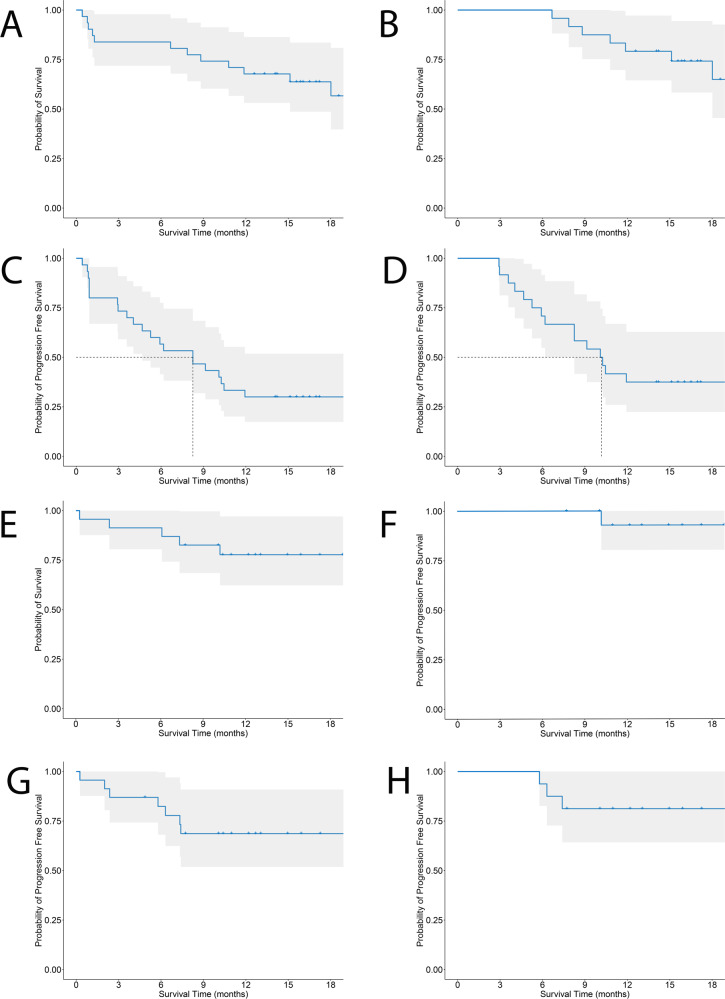
Chimeric antigen receptor (CAR) T cells targeting the CD19 antigen are effective in treating adults and children with B-cell malignancies. Place-of-care manufacturing may improve performance and accessibility by obviating the need to cryopreserve and transport cells to centralized facilities. Here we develop an anti-CD19 CAR (CAR19) comprised of the 4-1BB co-stimulatory and TNFRSF19 transmembrane domains, showing anti-tumor efficacy in an in vivo xenograft lymphoma model. CAR19 T cells are manufactured under current good manufacturing practices (cGMP) at two disparate clinical sites, Moscow (Russia) and Cleveland (USA). The CAR19 T-cells is used to treat patients with relapsed/refractory pediatric B-cell Acute Lymphocytic Leukemia (ALL; n = 31) or adult B-cell Lymphoma (NHL; n = 23) in two independently conducted phase I clinical trials with safety as the primary outcome (NCT03467256 and NCT03434769, respectively). Probability of measurable residual disease-negative remission was also a primary outcome in the ALL study. Secondary outcomes include complete remission (CR) rates, overall survival and median duration of response. CR rates are 89% (ALL) and 73% (NHL). After a median follow-up of 17 months, one-year survival rate of ALL complete responders is 79.2% (95%CI 64.5‒97.2%) and median duration of response is 10.2 months. For NHL complete responders one-year survival is 92.9%, and median duration of response has not been reached. Place-of-care manufacturing produces consistent CAR-T cell products at multiple sites that are effective for the treatment of patients with B-cell malignancies.


Conflict of interest statement

D.S., Y.X., D.W., A.K., W.K., A.W. and M.K. are employees of Lentigen, a MiltenyiBiotec Company. The remaining authors declare no competing interests.

Figures

Fig. 1
Fig. 1. CAR19 design, expression in human primary T cells, cytotoxicity in vitro, and tumor-specific cytokine response in vitro.
Schematic representation of CAR19.8 and CAR19 (A). CAR19.8 has a CD19-targeting ScFv sequence FMC63, CD8 hinge sequence, CD8 transmembrane region sequence, a co-stimulatory domain derived from 4-1BB/CD137, and a CD3ζ activation domain. CAR19 has a CD19-targeting ScFv sequence FMC63 in frame with CD8 hinge sequence, a transmembrane region sequence from TNFRSF19, a co-stimulatory domain derived from 4-1BB/CD137, and a CD3ζ activation domain. B Representative detection of anti-CD19 CARs. Target-specific cytotoxicity was evaluated by co-incubation of CAR19, or comparator CAR19.8 with target cell lines Raji (C), Reh (D), K562 (E), and 293T (F) for 18 h at effector to target ratio 5:1, 10:1, or 20:1, in triplicate, red lines represent CAR19, blue lines represent CAR19.8 and green line represents untransduced (UTD). Then, target cell lysis was analyzed by luminometry. Sample means were compared by one-way ANOVA followed by Tukey’s multiple comparisons test. IL-2 (G), IFNγ (H), and TNFα (I) cytokine secretion analysis was performed on supernatants from CAR T cells challenged overnight with Raji lymphoma cells at effector to target ratio 10:1, in triplicate, and measured by ELISA, blue bars represent Raji cells, and red bars represent CAR alone. Data are representative of three independent experiments, each performed on CAR T cells produced from a different donor, bars represent mean, error bars represent SD. Sample means were compared by One-way ANOVA followed by Tukey’s multiple comparisons test. ****p < 0.0001, **p < 0.01, ns-non-significant. Source data are provided as a Source Data File for panels ci.
Fig. 2
Fig. 2. CAR19 controls Raji lymphoma tumors in NSG xenograft model.
Xenograft model demonstrating clearance of Raji lymphoma tumors by CAR19 or CAR19.8 (A). Graph depicting change in mean radiance over time (B). NSG mice were engrafted with Raji-luc tumor cells at 5 × 105 Raji/mouse. On day 7 mice were dosed with 5 × 106 CAR T cells. Xenograft model demonstrating clearance of Raji lymphoma tumors by fresh vs. frozen CAR19 T cells, blue line represents tumor alone (TA), green line represents GFP expressing CAR-T cells, red line represents CAR-T cells transduced with CAR19 vector and black line represents CAR-T cells transduced with CAR19.8 vector (C). Fresh CAR19-T cells reduce tumor burden faster in vivo than cryopreserved CAR19-T cells. NSG mice were engrafted with Raji-luc tumor cells at 5 × 105 Raji/mouse. On day 7 mice were dosed with 2 × 106 CAR T+ cells. Tumor burden was assessed by bioluminescent imaging. Blue line represents tumor alone, red line represents fresh untransduced T cells, green line represents thawed frozen untransduced T cells, orange line represents thawed frozen CAR-T cells transduced with CAR19 vector and violet color represents fresh CAR-T cells transduced with CAR19 vector. N = 5 mice/group, mean ± SEM. Groups were compared by two-way ANOVA, followed by Tukey’s multiple comparison test for days 6–21, for which observations in all groups were available. ****p < 0.0001, **p < 0.001. Source data are provided as a Source Data File for panels B and C.
Fig. 3
Fig. 3. CAR19 is active against pediatric ALL and adult lymphoma.
A ALL patients (n = 31). Horizontal bars correspond to each individual patient; bar color corresponds to type of indication (pink—ALL relapsed after HSCT, sky blue—refractory relapse, green—induction failure); blue squares represent complete remission on day 28; yellow diamonds—persistent disease on day 28; light green circle—either CRS or ICANS < / = grade 2; dark green circle—either CRS or ICANS > grade 2; orange triangle—CD19-positive relapse; red triangle—CD19-positive relapse; black cross—death. B NHL patients (n = 23). Horizontal bars correspond to each individual patient; bar color corresponds to dose level (pink—0.5 × 106 CAR-T cells/kg, blue—1.0 × 106 CAR-T cells/kg, green—1.0 × 106 CAR-T cells/kg; blue squares represent complete metabolic response determined by PET/CT scan; green squares represent partial metabolic response determined by PET/CT scan; yellow diamonds indicate refractory or persistent disease determined by PET/CT scan, light green circle represents CRS/ICANS grade ≤ 2; dark green circle represents CRS/ICANS > 2; orange triangle represents CD19-positive relapse; red triangle represents CD19-negative relapse; black cross represents death.
Fig. 4
Fig. 4. Overall and progression-free survival of leukemia and lymphoma patients.
A Overall survival of the intention to treat ALL cohort (n = 31), including one patient with manufacturing failure. Gray area denotes 95% confidence interval of Kaplan–Meier survival estimate. B Overall survival of ALL patients achieving complete remission on day 28 assessment (n = 24). Gray area denotes 95% confidence interval of Kaplan–Meier survival estimate. C Progression-free survival of ALL patients infused CAR19 (n = 30). Gray area denotes 95% confidence interval of Kaplan–Meier survival estimate. D Progression-free survival of ALL patients achieving complete remission on day 28 assessment (n = 24). Gray area denotes 95% confidence interval of Kaplan–Meier survival estimate. E Overall survival of the lymphoma cohort (n = 23). Gray area denotes 95% confidence interval of Kaplan–Meier survival estimate. F Overall survival of lymphoma patients achieving complete remission by day 90 (n = 16) Gray area denotes 95% confidence interval of Kaplan–Meier survival estimate. G Progression-free survival of lymphoma patients infused CAR19 (n = 23). Gray area denotes 95% confidence interval of Kaplan–Meier survival estimate. H Progression-free survival of lymphoma patients achieving complete remission by day 90 (n = 16). Gray area denotes 95% confidence interval of Kaplan–Meier survival estimate.
Fig. 5
Fig. 5. Responders have a higher frequency of CD19 CAR T cells and memory-like CD8+ CD19 CAR T cells.
Patients with CRS have higher IL-6 levels and transitional memory-like CD4+ CD19 CAR T cells. A Left: Line graph showing the percentage of CAR T cells in participants until day 21. Each line represents a single patient. Right: Statistically significant difference of percentage of CAR T (area under the curve—AUC) between responders (n = 12) and non-responders (n = 5) (p < 0.05). Each dot represents the AUC of a single individual and lines represent the interquartile range. Blue lines and dots represent responders and red dots and lines represent non-responders. B Right: UMAP showing the distribution of cluster 4 in CD8+ CAR+ T cells. Left: Scatter plot showing significant positive correlation (Rho = 0.7187, p < 0.05) of frequency of cluster 4 (memory-like phenotype) in CD8+ CAR+ T cells and % CAR T cells in participants. Blue dots represent responders and red dots represent non-responders. C IL-6 levels were significantly higher (p < 0.05) in patients that present CRS vs. patients that did not present CRS. Each dot represents the Il_6 levels of a single individual and lines represent the interquartile range. Red dots represent patients with CRS, blue dots represent patients without CRS. D Left: UMAP showing the distribution of cluster 9 in CD4+ CAR+ T cells. Right: Frequency of transitional memory-like CD4+ CAR+ T cells (cluster 9) was higher (p < 0.05) in patients with grade 1 or no CRS compared to patients with CRS grade 2 or higher. Red dots represent patients with CRS, blue dots represent patients without CRS. Each dot represents the frequency of Cluster 9 CAR-T cells in a single individual and lines represent the interquartile range. Statistical significance was assessed by performing Mann–Whitney U test. Source data are provided as a Source Data File for panels AD.
Fig. 6
Fig. 6. Phenotypic characterization of clusters associated with outcome and toxicity.
A Right: UMAP showing the distribution of all clusters in CD8+ CAR+ T cells. Left: Phenotypic characterization of cluster 4 shows an expression of CD45RO, TCF7, CD27, and CCR7 in comparison with other clusters and with control (blue). B Right: UMAP showing the distribution of cluster among clusters in CD4+ CAR+ T cells. Left: Phenotypic characterization of cluster 9 shows an expression of CD45RO, TCF7, and CCR7, and lack of expression of CD27 in comparison with other clusters and with control (blue).

References

    1. Hunger SP, Mullighan CG. Acute lymphoblastic leukemia in children. N. Engl. J. Med. 2015;373:1541–1552. doi: 10.1056/NEJMra1400972. - DOI - PubMed
    1. Ko RH, et al. Outcome of patients treated for relapsed or refractory acute lymphoblastic leukemia: a Therapeutic Advances in Childhood Leukemia Consortium study. J. Clin. Oncol. 2010;28:648–654. doi: 10.1200/JCO.2009.22.2950. - DOI - PMC - PubMed
    1. Pui CH, Carroll WL, Meshinchi S, Arceci RJ. Biology, risk stratification, and therapy of pediatric acute leukemias: an update. J. Clin. Oncol. 2011;29:551–565. doi: 10.1200/JCO.2010.30.7405. - DOI - PMC - PubMed
    1. Schrappe M, et al. Outcomes after induction failure in childhood acute lymphoblastic leukemia. N. Engl. J. Med. 2012;366:1371–1381. doi: 10.1056/NEJMoa1110169. - DOI - PMC - PubMed
    1. Sehn LH, Gascoyne RD. Diffuse large B-cell lymphoma: optimizing outcome in the context of clinical and biologic heterogeneity. Blood. 2015;125:22–32. doi: 10.1182/blood-2014-05-577189. - DOI - PubMed

Publication types

MeSH terms

Substances

Associated data