. 2021 Dec 10;12(1):7189.
doi: 10.1038/s41467-021-27394-2.

Fine-scale population structure and demographic history of British Pakistanis

Affiliations

Fine-scale population structure and demographic history of British Pakistanis

Elena Arciero et al. Nat Commun. .

Abstract

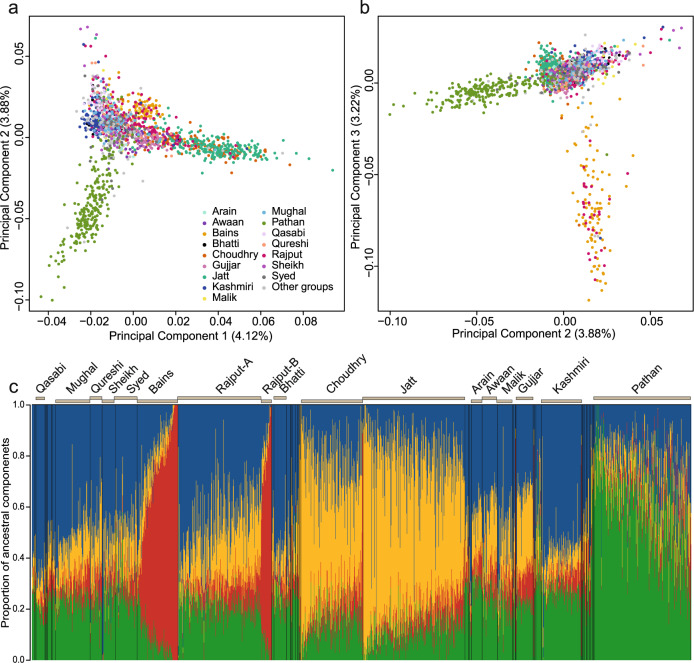
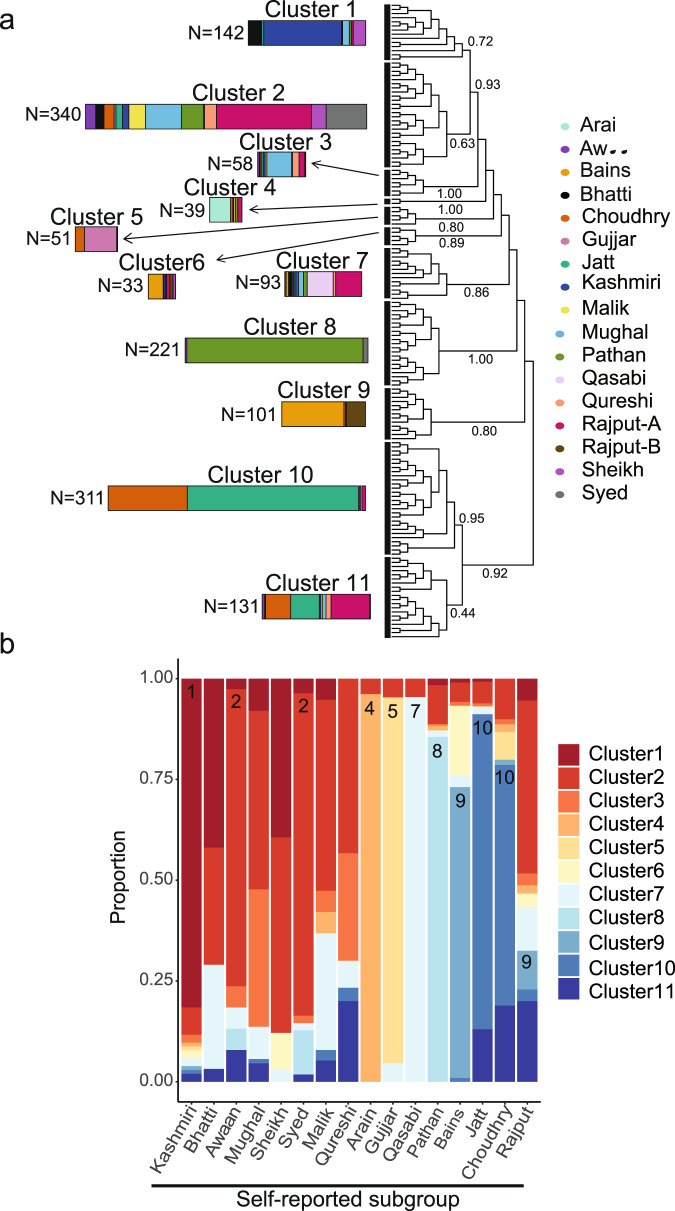
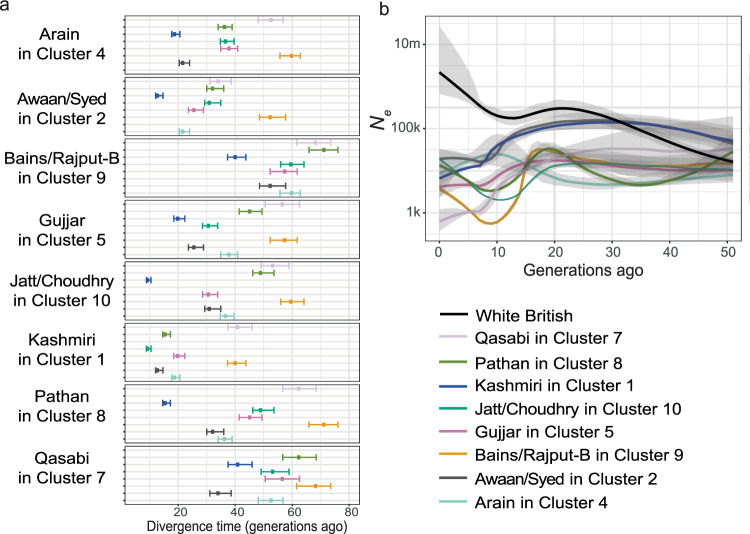
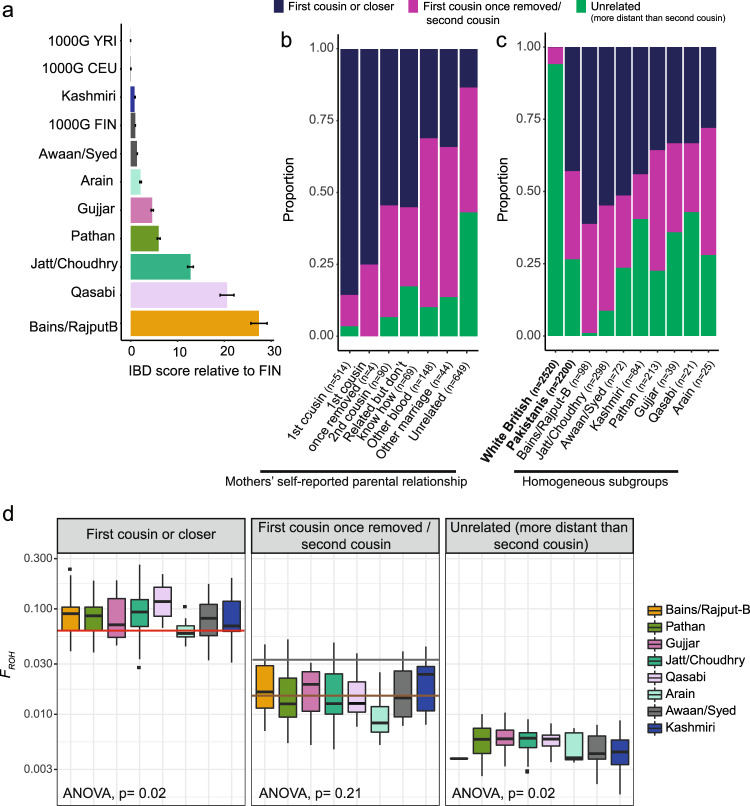
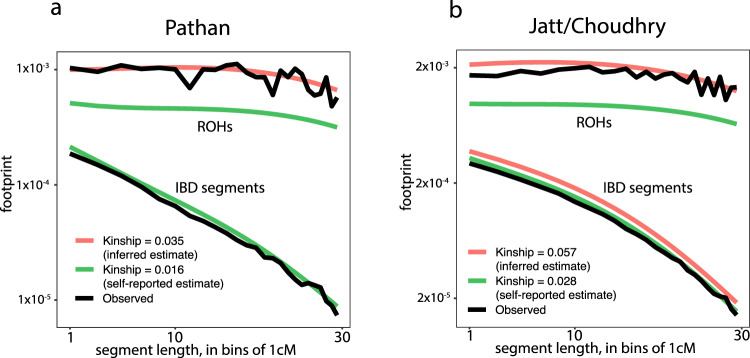
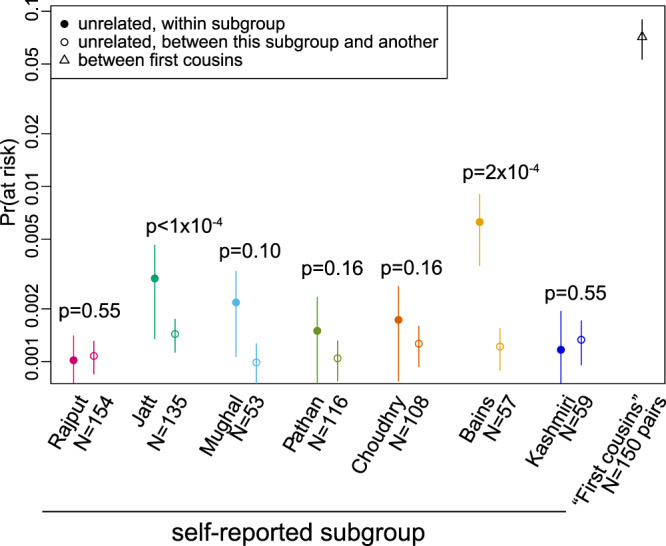
Previous genetic and public health research in the Pakistani population has focused on the role of consanguinity in increasing recessive disease risk, but little is known about its recent population history or the effects of endogamy. Here, we investigate fine-scale population structure, history and consanguinity patterns using genotype chip data from 2,200 British Pakistanis. We reveal strong recent population structure driven by the biraderi social stratification system. We find that all subgroups have had low recent effective population sizes (Ne), with some showing a decrease 15‒20 generations ago that has resulted in extensive identity-by-descent sharing and homozygosity, increasing the risk of recessive disorders. Our results from two orthogonal methods (one using machine learning and the other coalescent-based) suggest that the detailed reporting of parental relatedness for mothers in the cohort under-represents the true levels of consanguinity. These results demonstrate the impact of cultural practices on population structure and genomic diversity in Pakistanis, and have important implications for medical genetic studies.


Conflict of interest statement

The authors declare no competing interests.

Figures

Fig. 1
Fig. 1. Population structure within British Pakistanis from Bradford.
a, b Principal components analysis of 2200 unrelated Pakistani mothers, with the self-reported subgroups with >20 samples indicated in different colours. Plots show PC1 versus PC2 (a) and PC2 versus PC3 (b). Proportion of overall variation explained by each PC is noted in brackets on the axis label. c ADMIXTURE plot (K = 4) illustrating different ancestral components making up the various subgroups, with the largest self-reported subgroups indicated. We have indicated the two distinct subgroups amongst the Rajput.
Fig. 2
Fig. 2. Fine-scale population structure inferred amongst 1520 Bradford Pakistani mothers using fineSTRUCTURE.
a The tree illustrates the results of hierarchical clustering of the co-ancestry matrix using patterns of haplotype sharing from ChromoPainter. Each ‘leaf’ on the tree contains multiple individuals. The coloured bars represent the composition of each of the major clusters indicated by the thick black vertical lines. The length of each coloured bar is proportional to the number of individuals in that cluster, with the proportion of each colour representing the fraction of individuals from each self-reported subgroup that make up the cluster. The labels on the edges are the posterior assignment probabilities from fineSTRUCTURE. b The barplot illustrates the fraction of individuals from each self-reported subgroup that fall into the indicated clusters defined by fineSTRUCTURE. The numbers on the barplot indicate the clusters that were used to define a homogeneous subset of individuals from that self-reported subgroup for subsequent demographic analyses.
Fig. 3
Fig. 3. Divergence times and historical effective population size changes of Bradford Pakistani subgroups.
Note that these are the homogeneous subgroups defined using the fineSTRUCTURE clusters. a Divergence times estimated using NeON (n = 850 independent individuals). Within each panel, the points show the estimated divergence time between the group indicated on the left on the y-axis and those indicated in the legend. The horizontal lines indicate 95% confidence intervals of the estimated divergence time. b Change in effective population size (Ne) through time estimated with IBDNe. The coloured lines indicate the mean estimate and the grey shading indicates 95% confidence intervals of the Ne estimates.
Fig. 4
Fig. 4. Effect of endogamy and consanguinity on IBD sharing and ROH patterns in BiB Pakistani subgroups.
Note that these are the homogeneous subgroups defined using the fineSTRUCTURE clusters. a IBD scores were calculated as the average total length of IBD segments between 5 and 30 cM shared between individuals from the indicated group (n = 964 independent samples), standardised by the value for the 1000 Genomes Finns (FIN). The error bars indicate the IBD score standard error. YRI Yoruba, CEU Western Europeans. b, c Stacked bar plots showing inferred parental relatedness b in the Pakistani mothers broken down by self-reported parental relatedness or c in all white British versus all Pakistani mothers, and in Pakistani mothers broken down by subgroup. d Boxplots showing the fraction of the genome in regions of homozygosity (FROH) broken down by subgroup and inferred degree of parental relatedness (n = 850 independent samples). In each boxplot the centre is equal to the median, the upper and lower bounds of the box correspond to 25th and 75th percentiles and the whiskers represent 1.5 times the inter-quartile range (IQR) from the bounds of the box. Outliers are represented as points. Lines indicated expected FROH for individuals with parents who are first cousins (red), first cousins once removed (grey) and second cousins (brown). The two-way ANOVA tests whether FROH differs between the subgroups.
Fig. 5
Fig. 5. Observed ROH and IBD footprints compared to the expectation under a coalescent model.
The footprint is the average fraction of the genome covered by segments of a given length interval. The top lines represent the ROH footprint and the bottom lines the IBD footprint. Points are plotted at the beginning of each 1 cM interval. The Ne profile used to compute the expected footprints was determined by IBDNe using a the Pathan from fineSTRUCTURE’s Cluster 8 or b Jatt/Choudhry from Cluster 10. In a, for the IBD segments, the pink line is beneath the green one. We used kinship values calculated using either the self-reported relationships or the inferred estimates of consanguinity for the relevant group. The observed footprints (black lines) were determined using filtered IBD and ROH calls from IBDseq and bcftools/roh, respectively. Supplementary Fig. 16 shows equivalent plots using the upper and lower bounds of the 95% confidence interval for the IBDNe estimate as the Ne trajectory, and using observed footprints from different ROH or IBD calling/filtering strategies.
Fig. 6
Fig. 6. Estimated fraction of couples from intra-biraderi, inter-biraderi and first cousin unions who would be at risk of having a child with a recessive developmental disorder.
These estimates are based on simulations that use P/LP variants ascertained from exome-sequence data in Bradford Pakistani mothers, and rely on the self-reported subgroup information. The y-axis indicates an estimate of the fraction of couples that would be ‘at risk’ of having a child with a recessive developmental disorder since both parents are carriers of P/LP variants in the same gene. Note that this is undoubtedly an under-estimate of absolute risk (see ‘Discussion’), but one can still compare the relative risk for intra- versus inter-biraderi unions. Error bars indicate standard deviations of the risk estimates and one-sided p-values are from permutation tests (see ‘Methods’). The ‘first cousins’ were sampled to match the IBD distribution observed for self-reported first cousin couples (see ‘Methods’), regardless of biraderi group.

Similar articles

Cited by

  • Exome sequencing of UK birth cohorts.
    Koko M, Fabian L, Popov I, Eberhardt RY, Zakharov G, Huang QQ, Wade EE, Azad R, Danecek P, Ho K, Hough A, Huang W, Lindsay SJ, Malawsky DS, Bonfanti D, Mason D, Plowman D, Quail MA, Ring SM, Shireby G, Widaa S, Fitzsimons E, Iyer V, Bann D, Timpson NJ, Wright J, Hurles ME, Martin HC. Koko M, et al. Wellcome Open Res. 2024 Dec 5;9:390. doi: 10.12688/wellcomeopenres.22697.2. eCollection 2024. Wellcome Open Res. 2024. PMID: 39839975 Free PMC article.
  • South Asia: The Missing Diverse in Diversity.
    Dokuru DR, Horwitz TB, Freis SM, Stallings MC, Ehringer MA. Dokuru DR, et al. Behav Genet. 2024 Jan;54(1):51-62. doi: 10.1007/s10519-023-10161-y. Epub 2023 Nov 2. Behav Genet. 2024. PMID: 37917228 Free PMC article. Review.
  • Genetic Screening of a Nonsyndromic Amelogenesis Imperfecta Patient Cohort Using a Custom smMIP Reagent for Selective Enrichment of Target Loci.
    Hany U, Watson CM, Liu L, Nikolopoulos G, Smith CEL, Poulter JA, Antanaviciute A, Rigby A, Balmer R, Brown CJ, Patel A, de Camargo MGA, Rodd HD, Moffat M, Murillo G, Mudawi A, Jafri H, Mighell AJ, Inglehearn CF. Hany U, et al. Hum Mutat. 2025 Jul 22;2025:8942542. doi: 10.1155/humu/8942542. eCollection 2025. Hum Mutat. 2025. PMID: 40741335 Free PMC article.
  • Parent-offspring inference in inbred populations.
    Runge JN, König B, Lindholm AK, Bendesky A. Runge JN, et al. Mol Ecol Resour. 2022 Nov;22(8):2981-2993. doi: 10.1111/1755-0998.13680. Epub 2022 Jul 22. Mol Ecol Resour. 2022. PMID: 35770342 Free PMC article.
  • Disease risk and healthcare utilization among ancestrally diverse groups in the Los Angeles region.
    Caggiano C, Boudaie A, Shemirani R, Mefford J, Petter E, Chiu A, Ercelen D, He R, Tward D, Paul KC, Chang TS, Pasaniuc B, Kenny EE, Shortt JA, Gignoux CR, Balliu B, Arboleda VA, Belbin G, Zaitlen N. Caggiano C, et al. Nat Med. 2023 Jul;29(7):1845-1856. doi: 10.1038/s41591-023-02425-1. Epub 2023 Jul 18. Nat Med. 2023. PMID: 37464048 Free PMC article.

References

    1. Bittles AH, Black ML. Consanguinity, human evolution, and complex diseases. Proc. Natl Acad. Sci. USA. 2010;107:1779–1786. - PMC - PubMed
    1. Bittles, A. H. In Vogel and Motulsky’s Human Genetics (eds Speicher, M. R., Motulsky, A. G. & Antonarakis, S. E.) 507–528 (Springer, 2010).
    1. Zaidi, A. A. & Mathieson, I. Demographic history mediates the effect of stratification on polygenic scores. Elife 9, (2020). - PMC - PubMed
    1. Martin AR, et al. Human demographic history impacts genetic risk prediction across diverse populations. Am. J. Hum. Genet. 2017;100:635–649. - PMC - PubMed
    1. Office For National Statistics. Census: Ethnic Group, Local Authorities in the United Kingdom (Office For National Statistics, 2011).

Publication types